
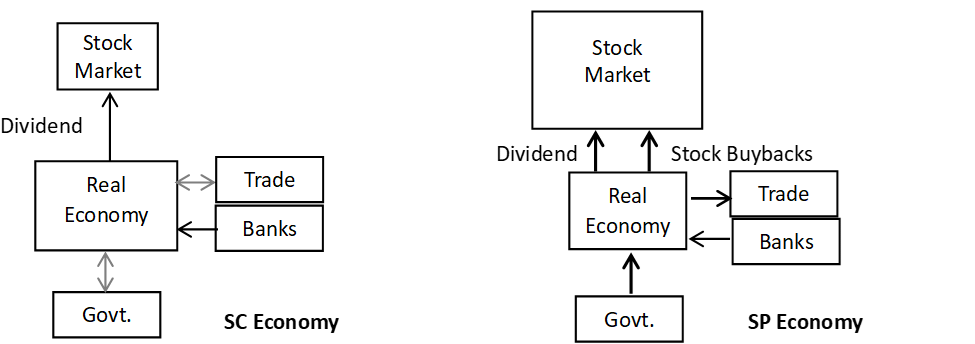
Higher flow of funds into the stock market (right) illustrates operation of the wealth pump.
Peter Turchin’s work analyzing historical data with the tools of complexity science has identified the deep structural forces that destabilize sociopolitical stability. One of the most important of these forces is a perverse “wealth pump” that, under certain conditions, begins to transfer wealth from the “99 percent” to “1 percent.” If allowed to run unchecked, the wealth pump results in both relative impoverishment of most people and increasingly desperate competition among elites. This, in turn, leads to rising political instability, as I have previously described. In this post I characterize the wealth pump, estimating its size and describing how it works.
Quantification of the Wealth Pump
Figure 1 shows an estimate for the size of the wealth pump flow, some of its constituents, and growth of stock market capitalization, the chief recipient of wealth pump flows, since the beginnings of SP capitalism around 1980. The wealth pump refers to flows of income redirected from commoners to elites that are responsible for rising inequality since 1980. Total wealth pump flows were estimated using the growth in the top 10% income share from its average value in the 1970’s. This difference was multiplied by nominal GDP and adjusted for inflation with the CPI. The resulting annual flows were summed to give the total curve in Figure 1. Dividend payments and buyback expenditures as a fraction of GDP are plotted here. Their average value in the 1970’s was subtracted to give the increase in these payments since then. These were multiplied by nominal GDP, the result adjusted for inflation using the CPI and the cumulative sum of both shown as financial flows in Figure 3. The financial flows were subtracted from the total to give the flow going to top 10% as income. Finally, growth in stock market capitalization since 1980, adjusted for inflation, is also shown to provide a check on the numbers.
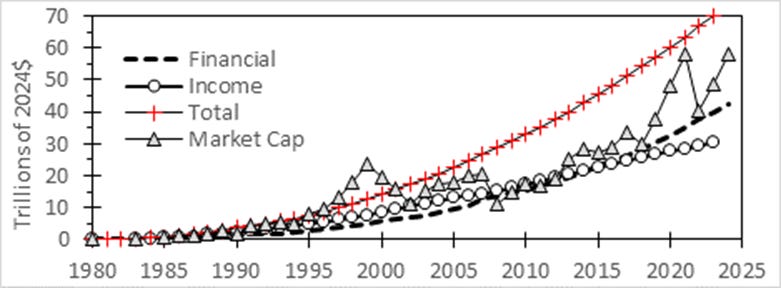
Figure 1. Cumulative wealth pump flows and growth in market capitalization
The cumulative total wealth pump flow is usually larger than market capitalization. This makes sense as not all of the additional wealth flowing to elites has gone into the stock market, some of it has gone into higher real estate value, which I estimate is some $20 trillion higher today than it would be if the 1890-1995 valuations were still operative. There are also foreign flows into the country that result from chronic trade deficits the US has maintained since the 1970’s. A trade deficit in goods and services is countered by a flow of dollars out of the country. These dollars then come back as financial flows going into assets, mostly government debt. The existence of a government fiscal surplus in the late 1990’s meant trade-related financial flows that usually went into government bonds could now flow into other asset classes such as stocks. The rise in stock market capitalization above the volume pumped at this time (see Figure 3) may have involved such redirected flows.
Why the wealth pump did not operate before 1980
Having quantified the size of the wealth pump, the next question is how does it work? Why did it begin when it did and what keeps it pumping? Wealth pump operation results from behavior by both business executives and economic policymakers in accordance with shareholder primacy (SP) culture. Two changes, the cut in top income tax rate from 70% to 50% and legalization of stock buybacks created a new environment for business executives. Under the pre-1981 policy regime, boards were leery of awarding high levels of monetary compensation to executives because it was costly. In 1980 when the top income tax rate was 70% and the corporate rate was 46%, $1 of after-tax compensation going to executives cost shareholders $1.80 in lost earnings. This acted to discourage high levels of cash compensation. Ordinary stock options are a low-cost form of compensation compared to cash. But they dilute earnings per share, which exerts an indirect cost on shareowners. In general, high levels of cash or ordinary stock compensation were eschewed in favor of other compensation.
This compensation was of two types: qualified stock options (QSO) and in-kind compensation. A QSO is an option used to buy company stock at a discount price, which was then held for a period of time long enough (3 years after 1976, one year before) so that the capital gain obtained upon sale would be taxed at the lower long-term rate. Using QSOs meant the executive had to come up with the money to buy the shares at the discount price and have it tied up and subject to market risk for the holding time. In contrast, ordinary options are exercised to buy the stock, which is immediately sold meaning the executive does not need to put their own money up front—but the proceeds are taxed as ordinary income. Thus, the amount of QSOs that can be used is limited by the cash put at risk by the executive, while the size of ordinary options has no intrinsic limit. Hence pre-1981 QSO compensation was much lower than use of regular option compensation after. In all executive compensation was far lower in the pre-1980 era
In-kind compensation included such things as executive use of the company jet, a company car and driver, company-paid investment management, tax preparation, and personal legal services. Companies might maintain an executive retreats or paid for membership in exclusive private clubs that also served as business venues. These things could serve as status/prestige signals, as did the size and social importance of the firms they ran. In the pre-1981 world executive rewards for their work came from a mix of money, stock, perks, and intangible rewards. Stock was only a small part of the total. Hence executives had little incentive to focus exclusively on shareholder value.
They were incented through cash bonuses to achieve business objectives such as sales growth, market penetration and new product introduction. Intangible rewards would be rising status achieved through business success relative to peers as evaluated through business metrics analogous to how player “stats” define sports greats. Outstanding performance was often reported in the business media. Stock performance still mattered, but it was only one of several measures of success. This meant that after paying the historical dividend yield, executives were incented to invest more on growing the company rather than share price. In the absence of share buybacks, the only direct way to boost share prices was to pay higher dividends, which was discouraged by the high rate at which they were taxed. It was better to invest for business growth that promised to deliver long-term capital gains to patient shareholders over time, which would be taxed at the lower long-term capital gains rate.
A focus on sales growth1 led to strong demand for workers and rising wages. These served to direct a larger fraction of income to workers/consumers, which meant strong demand for the increased output produced by investment of profits and strong hiring. This created a virtuous cycle of strong growth benefiting all classes that produced the declining postwar income inequality shown here.
The activation and operation of the wealth pump after 1981
A series of tax cuts beginning in 1981 reduced the top tax rate on regular stock options from 70% to an average value of 37% after 1986. This meant the number of options required to produce the same after-tax compensation after the tax cuts was less than half those needed before 1981. Not only that but the dilution caused by this smaller number of options could be and was offset by stock buybacks, which were legalized in 1982. As previously noted, executive compensation soared during the 1980’s, as did stock buybacks. This happened because tax cuts and now-legal stock buybacks created a new way to massively increase executive stock compensation at little cost to shareholders. Executive compensation quadrupled, mostly provided by stock compensation, which strongly incented executives to focus on share price above all else. This supported development of a belief that the objective of business was to maximize shareholder value, that is at the core of shareholder primacy culture. Previously this had not been the case.
Initiation of stock buybacks began wealth pump operation. Historically companies try to maintain their dividend yields, which requires that more profits be used for dividends as stock prices rise. Profit remaining after dividends are paid is called retained earnings. Traditionally, retained earnings have been reinvested into the company’s growth. Stock buybacks provide an alternative to such investment, which can be thought of as a different kind of investment, one which directly injects funds into the stock market leading to rising market capitalization.
Suppose a company issues incentive bonuses to executives in the form of 50,000 options for shares at the current price of $20. Simultaneously the company buys 50,000 shares of its stock at $20 for $1 million. Assume the stock price rises at the 8.4% rate at which the S&P500 has risen over the past thirty years, in which case the price reaches $30 five years later. The options are then used by their recipients to buy 50,000 shares of stock for $20 from the company and sell it to the public for $30, clearing $0.5 million of profit. The company has been fully reimbursed for their initial stock purchase—the $500 thousand in bonuses cost the company nothing—with no net dilution for shareholders since the shares sold by the executives were those initially bought by the company.
Using options in this way amounts to the company making a stock market investment and using the profits obtained from this investment to pay employees. If the investment does not pan out, the executives do not get the incentive bonus, which should serve as an incentive to manage the company so that the investment does succeed. The alternative to stock buybacks is to pay the $0.5 million bonus directly, which will reduce earnings, adversely affecting shareholders. There is no consequence for shareholders of using all profits for dividends and stock buybacks because investment continues at the planned rate—it is just funded with debt. The catch is, if one is to use debt in place of profits for investment, the return that investment generates needs to be higher than the cost of that debt (interest rate). Also, accumulation of excessive debt places a firm at risk of insolvency during unexpected downturns.
Figure 2 shows plots of the return on equity (a proxy for profit from investment) and the real AAA bond yield. Real interest rate places a limit on minimally acceptable real returns from business investment. Before 1981, real interest rates were very low, meaning ROE values as low as 2.5% were minimally acceptable. This meant firms were free to pursue capital-intensive business opportunities in large markets where there would be competition serving to reduce margins. The effect of lower margins on total profit can be offset by higher volume, so pursuit of sales growth rather than high profitability made sense. That is, behavior consistent with SC culture made economic sense as well as leading to greater prestige.
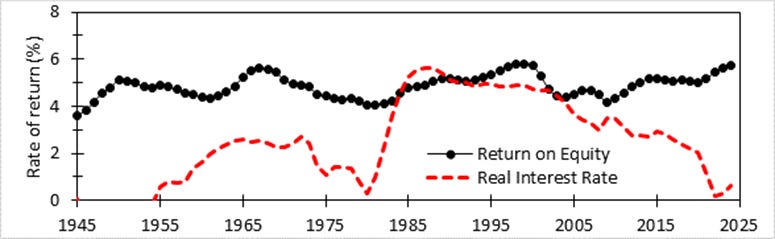
Figure 2. ROE vs real interest rates since 1945 (values exponentially smoothed with factor 0.2)
The world changed abruptly after 1981. Real interest rates rose to levels similar to average ROE. In this world the minimum acceptable ROE from investments rose and profitability became a central concern. Most executives at the time were still operating under SC culture but this new reality strongly selected for a focus on profitability over growth, which is a key element of SP culture. Legalized stock buybacks now provided an investment alternative for retained earnings and use of stock buybacks began to increase.
The mechanism of the wealth pump
The wealth pump reflects a shift in investment from input-heavy to input-light business investment. Input heavy means investment requiring the mobilization of large amounts of labor, resources and capital to produce a profit stream. For example, construction of a new industrial plant, electrical power generation/transmission infrastructure, or residential construction requires production of a large quantity of physical capital goods, requiring large amounts of materials and labor, which requires a lot of capital, all of which needs to be expended before the project can start generating a return. In the pre-1980 world in which real interest rate was low, a project whose return ended up being subpar, would still be higher than the cost of the capital and so profitable, just not as profitable as expected. But in the post-1980 world this luxury no longer existed; such projects would require more scrutiny.
Financial projects did not require mobilization of materials and labor, just capital and could produce quicker returns. These were less risky and industrial firms pursued expansion into financial services as new lines of business. For example, GM diversified their GMAC financial unit that provided loans to car buyers into mortgage lending in 1985. In that same year, Sears came out with their Discover™ credit card. These initiatives were very profitable, leading financial analysts to quip that GM was more a bank than a car company. These developments were part of a general shift to finance that can be seen as a adaptation to a world of high interest rates and increased riskiness of labor- and physical capital-intensive projects. This translated to a reduced supply of traditional working-class jobs leading to a steady decline in their real wages, showing a direct link to the shift in the investing environment and income inequality—that is, operation of the wealth pump.
The cultural elements described earlier evolved under the selection pressure provided by both the altered incentive structure and the investment environment. This evolution was largely complete by the time the investment environment became favorable in the 2000’s (see Figure 2). Business was now accustomed to cheap labor and outsourced to China, if necessary, to acquire it. The wealth pump was now embedded in American political economic institutions as normal, with those who challenged it dismissed as naive radicals.
Hence, income inequality has continued to rise, and the political stress indicator (PSI) along with it in accordance with Turchin’s systemic analysis.
Since GDP is the net sales of all the firms in the economy, a collective sales growth focus is the same as strong GDP growth and strong demand for workers.
No posts
Comments
Nothing yet. Say the first thing.
Sign in to join the conversation.