
Southern minority communities have a unique and long experience with redistricting.
During the Jim Crow era conservative White Southerners practiced outright disenfranchisement of African-Americans through discriminatory voter registration practices and literacy tests, but also used redistricting to deny representation, especially once the federal government began enforcing the 14th and 15th Amendments that guarantee voting for all citizens. Congress amended the federal Voting Rights Act to specifically forbid strategic district drawing to deny representation for African-Americans and other minority communities.
With this history in mind, how did Virginia’s African-Americans vote in the recent Virginia redistricting referendum?
Virginia is not among the states that ask registered voters to provide their race and Hispanic ethnicity, but there is a technique known as surname matching that can make predictions. The U.S. Census Bureau publishes the frequency of race and Hispanic ethnicity for every last name. The probability that a person is of a race or Hispanic ethnicity can be further refined by geolocating people into neighborhoods, such that we might give a person with the last name “Martinez” a higher probability of being Hispanic if they live in a predominately Hispanic neighborhood than a White neighborhood, also according to Census population counts.
I employ surname matching on a December 2025 Virginia voter registration file that I obtained as an expert witness for plaintiffs in a successful legal challenge to Virginia’s Documentary Proof of Citizenship voter registration requirements instituted by former Virginia Governor Glenn Youngkin. I calculate the average predicted probabilities of being a race or Hispanic ethnicity, average across registered voters within precincts, and match these data with the Department of Elections’ precinct election results (these results exclude a small number of provisional and late mail ballots yet to be adjudicated).
Perhaps not surprisingly there is strong positive correlation between the percentage of African-Americans within precincts and the percent “Yes” vote for the redistricting amendment, as depicted in the figure below.
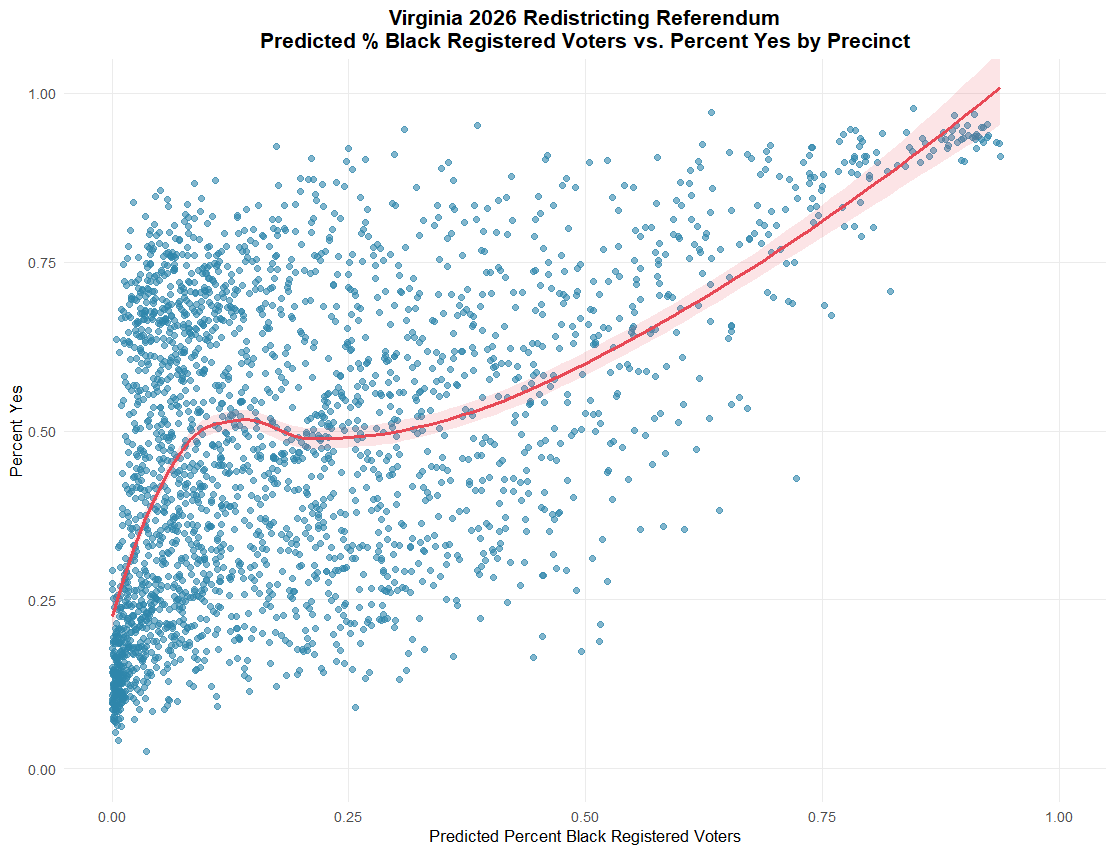
If not obvious from the plot, the percentage of Yes vote is highest among the most African-American precincts. In the twenty “homogeneous” African-American precincts the average Yes vote percentage is 93.5%.
A statistical technique known as “ecological inference” can reveal what is obvious from the plot, along with further patterns of support for the amendment and abstention among Non-Hispanic White, Non-Hispanic Black, Hispanic, Non-Hispanic Asian, and all Non-Hispanic “Other” registered voters. Ecological inference basically estimates support much like the line drawn through the plot, but does so in a multi-dimensional way.
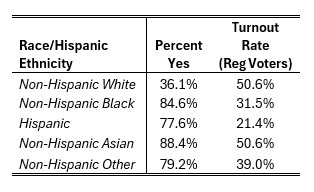
In the table above, I report the statewide estimated percent voting “Yes” and the turnout rates for Non-Hispanic White, Non-Hispanic Black, Hispanic, Non-Hispanic Asian, and all Non-Hispanic Others.
A clear pattern emerges. The Virginia Redistricting Amendment passed with the strong support of Virginia’s minority communities, all of which had an estimated more than three-quarters Yes vote. The largest Virginian minority community, African-Americans, had an estimated support level of 84.6%.
Hispanics voting at 77.6% estimated support for a redistricting amendment that affects partisan control of the U.S. Congress in favor of Democrats is a reversal of their higher 2024 Trump support, as we’ve seen in polling and election results across the country.
(I’ve included Non-Hispanic Asian-Americans for completeness, but with a relatively small 6.0% population among registered voters scattered across precincts statewide, their Yes vote and turnout estimates have relatively large error.)
Some Republicans complained about how Northern Virginia voters decided for the rest of the state, but what they perhaps really mean is that minority communities strongly voted Yes. Fairfax County (51.8% non-Hispanic White), for example, has about a ten percentage point greater share of minority registered voters than statewide (62.0%).
Of further interest is the turnout rate among registered voters. Non-Hispanic White voters had a voter registration turnout rate of 50.6%, generally higher than the turnout rates among minority groups. The greater levels of abstention among minority communities are perhaps typical, as communities of color tend to vote at lower turnout rates in non-presidential elections.
Without strong support from African-American and other communities of color, Virginia’s redistricting amendment would have failed. Their high levels of support overcame their lower turnout.
This is the challenge for the Democrats in the upcoming November election: can they mobilize key parts of their coalition that tend to vote at lower rates in midterm elections?
No posts
Comments
Nothing yet. Say the first thing.
Sign in to join the conversation.