
Welcome to The Merciless Trade, where I break down significant updates in the financial markets and find connections between them. Preparing you for the week ahead as I flip through charts, analyze the data, and cut through the noise to get an edge.
Now let’s do this…
Geopolitical risk dominated markets last week as the conflict between the United States and Iran entered a more dangerous phase. CENTCOM confirmed a seventh consecutive night of strikes targeting Iranian military, surveillance and maritime infrastructure, while reports of another U.S. strike near Kharg Island raised concern that Iran’s core energy-export system could become more directly involved. Iran responded with further attacks across the region and reportedly launched a cruise missile toward a U.S. vessel in the northern Indian Ocean, while Washington deployed additional aerial-refueling aircraft to support Israel and intensified operations aimed at breaking Iran’s attempted blockade of commercial shipping.
The escalation overwhelmed what would ordinarily have been a constructive U.S. economic backdrop. Preliminary July consumer sentiment rose to a five-month high of 54.4, comfortably exceeding expectations, while one-year inflation expectations declined to 4.2% and longer-term expectations held at 3.3%. However, much of the survey was completed before the latest breakdown in the U.S.-Iran ceasefire, leaving the improvement vulnerable to renewed increases in gasoline prices. That tension was already visible across markets, as the S&P 500 fell 1.55% and the technology-heavy QQQ dropped 4.16%, reflecting a sharp loss of growth leadership and a narrower shift toward energy and defensive areas of the market.
Corporate developments reinforced the longer-term themes of semiconductor reshoring, AI infrastructure and regulatory oversight. TSMC announced another $100 billion expansion in Arizona, bringing its planned U.S. investment to $265 billion and further accelerating the domestic buildout of advanced chip capacity. Elsewhere, Apple was reportedly engaged in preliminary settlement discussions with the Justice Department, while the administration was said to be considering a FINRA-style regulator to evaluate advanced AI models before release. Together, the developments highlighted the growing convergence of technology investment, national security and government policy.
Trade tensions added another layer of uncertainty after President Trump threatened to incorporate the economic cost of Canadian wildfire smoke into existing tariffs on Canadian goods. Although the mechanism remains unclear, the statement reinforced concerns that tariffs could increasingly be used in disputes extending beyond conventional trade policy. With longer-term Treasury yields elevated and several major technology companies preparing to report earnings, the market enters the coming week balancing resilient domestic data against weakening technology leadership and a geopolitical shock capable of quickly reshaping the inflation and interest-rate outlook.
The week’s broader economic data remained mixed but generally resilient. Headline and core CPI came in below forecasts, June PPI declined 0.3%, and both initial and continuing jobless claims were better than expected. Manufacturing surveys strengthened sharply, led by the Philadelphia Fed and Empire State indexes, although actual industrial and manufacturing production remained soft. Housing starts rebounded 19%, but weaker permits, builder confidence and pending home sales showed that the housing recovery remains uneven. Retail sales matched expectations following an upward revision to the prior month, crude inventories posted a modest draw and the U.S. oil-rig count increased by seven.

Baker Hughes Oil Rig Count +7 To 452 Vs 446 Est.; U.S. Baker Hughes NatGas Rig Count Unchanged At 126; U.S. Baker Hughes Total Rig Count 588 Vs 581 Prior
Industrial Production (YoY) For June 1.10% Vs 1.67% Prior
Industrial Production (MoM) For June 0.1% Vs 0.2% Est.
Manufacturing Production (MoM) For June 0.0% Vs 0.1% Est.
Export Price Index (YoY) For June 10.2% Vs 11.2% Prior
Import Price Index (YoY) For June 7.1% Vs 6.7% Prior
Housing Starts MoM For June Prior Revised From -15.4% To -15.2%
Import Price Index (MoM) For June Revises Prior From 1.9% To 1.7%
Housing Starts For June Prior Revised From 1.177M To 1.199M
Housing Starts For June 1.427M Vs. 1.310M Est.; 1.199M Prior
Housing Starts MoM For June 19.0% Vs. -15.2% Prior
Export Price Index (MoM) For June Revises Prior From 1.3% To 1.2%
Import Price Index (MoM) For June 0.3% Vs -0.7% Est.
Building Permits (MoM) For June -3.0% Vs -0.9% Prior
Building Permits For June 1.367M Vs 1.400M Est.; 1.410M Prior
Export Price Index (MoM) For June -0.6% Vs -0.4% Est.
Business Inventories (MoM) Revises Prior From 0.5% To 0.6%
NAHB Housing Market Index For July 34 Vs 35 Est.
Business Inventories (MoM) For May 0.3% Vs 0.3% Est.
Pending Home Sales Index For June 72.5 Vs 76.6 Prior
Retail Inventories Ex Auto For May 0.3% Vs 0.4% Est.
Pending Home Sales (MoM) For June -5.4% Vs -0.5% Est.
Core Retail Sales (MoM) For June Revises Prior From 0.8% To 1.0%
Retail Sales (MoM) For June Revises Prior From 0.9% To 1.0%
Initial Jobless Claims Revises Previous Prior From 215K To 216K
Initial Jobless Claims 208K Vs 216K Est.
Retail Sales (MoM) For June 0.2% Vs 0.2% Est.
Philly Fed Employment For July 10.0 Vs 7.9 Prior
Philadelphia Fed Manufacturing Index For July 41.4 Vs 12.7 Est.
Continuing Jobless Claims 1,805K Vs 1,820K Est.
Crude Oil Inventories 1.692M Barrel Draw Vs 1.800M Barrel Draw Est.
Core PPI (MoM) For June Revises Prior From 0.4% To 0.1%
PPI (MoM) For June Revises Prior From 1.1% To 0.6%
Core PPI (YoY) For June Prior Revised From 4.9% To 4.6%
PPI (YoY) Prior Revised From 6.5% To 6.0%
Core PPI (MoM) For June 0.2% Vs 0.3% Est.
PPI (MoM) For June -0.3% Vs 0.0% Est.
PPI (YoY) For June 5.5% Vs 6.2% Est.
NY Empire State Manufacturing Index For July 15.60 Vs 9.30 Est.
API Crude Oil Stock 0.564M Barrel Draw Vs 2.700M Barrel Draw Est.
Redbook Retail Sales Index For July 2026 Vs July 2025: 8.2% YoY
Redbook Retail Sales Index Up 8.2% YoY For Week Ended 7/11/26
Core CPI (MoM) For June 0.0% Vs 0.2% Est.
CPI (MoM) For June -0.4% Vs -0.1% Est.
Core CPI (YoY) For June 2.6% Vs 2.8% Est.
CPI (YoY) For June 3.5% Vs 3.8% Est.
ADP Employment Change Weekly 19.80K Vs 21.00K Prior
Federal Budget Balance For June -120.0B Vs -132.8B Est
Treasury yields moderated over the past week, partially reversing the broad increase seen the week before, with the short end of the curve experiencing the largest decline. The 2-year yield fell 4 basis points to 4.18%, the 5-year declined 2 basis points and the 10-year slipped 1 basis point, while the 20-year was unchanged and the 30-year rose 1 basis point. The move followed heavier selling across longer maturities the previous week as inflation, geopolitical, fiscal and term-premium concerns pressured duration. The relative stabilization suggests that the repricing lost some momentum, although the long end remained elevated, causing the curve to steepen modestly.
The 2-Year closed at 4.18%
The 5-Year closed at 4.29%
The 10-Year closed at 4.55%
The 20-Year closed at 5.07%
The 30-Year closed at 5.07%
For the July 29 Fed meeting, markets price an 85.6% probability that rates remain unchanged and a 14.4% probability of a 25-basis-point increase.
For the September 16 Fed meeting, markets are currently pricing a 39.7% chance that rates remain unchanged, with a 52.6% chance of a 25-basis-point hike, a 7.7% chance of a 50-basis-point hike.
For the October 28 meeting, markets price a 30.7% probability that rates remain unchanged and a combined 69.3% probability of at least one increase, including a 49.8% probability of a 25-basis-point increase, 17.7% for 50 basis points and 1.7% for 75 basis points.
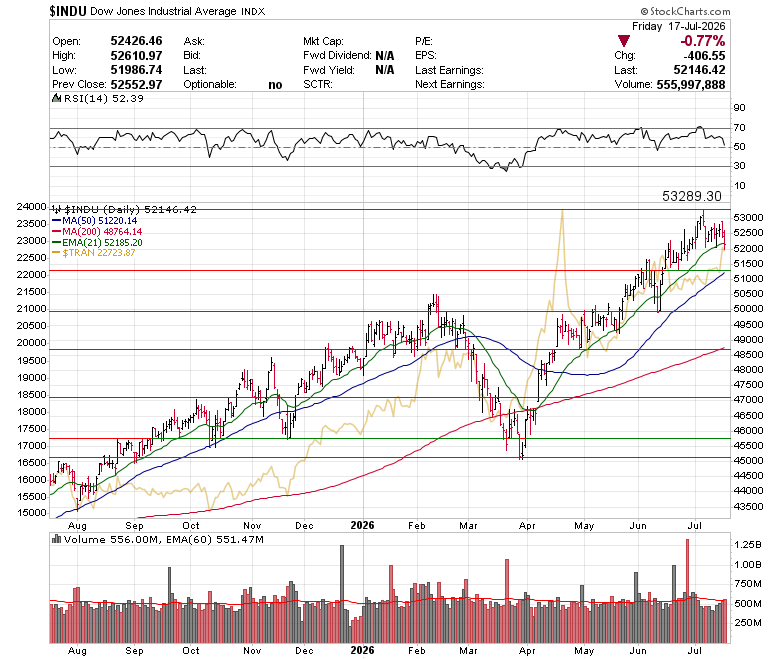
The Dow Jones Industrial Average fell 0.93% last week to close at 52,146.42, finishing just below its 21-day EMA at 52,185.20 after failing to extend its early-July move toward the recent high near 53,289. The index remains in a broader uptrend and comfortably above its rising 50-day moving average near 51,220, but the loss of the 21-day EMA leaves the 52,000 area as an important near-term support level. Momentum has cooled rather than broken down, with the RSI holding near a neutral 52. In contrast, the Dow Jones Transportation Average bucked the broader weakness, rising 2.46% and reaching multi-month highs on Thursday before recording its strongest weekly close since the sharp April selloff. The relative strength in transports offers a constructive signal for the broader industrial trend, although the Dow will need to reclaim the 21-day EMA and eventually clear the 53,289 high to restart its advance.
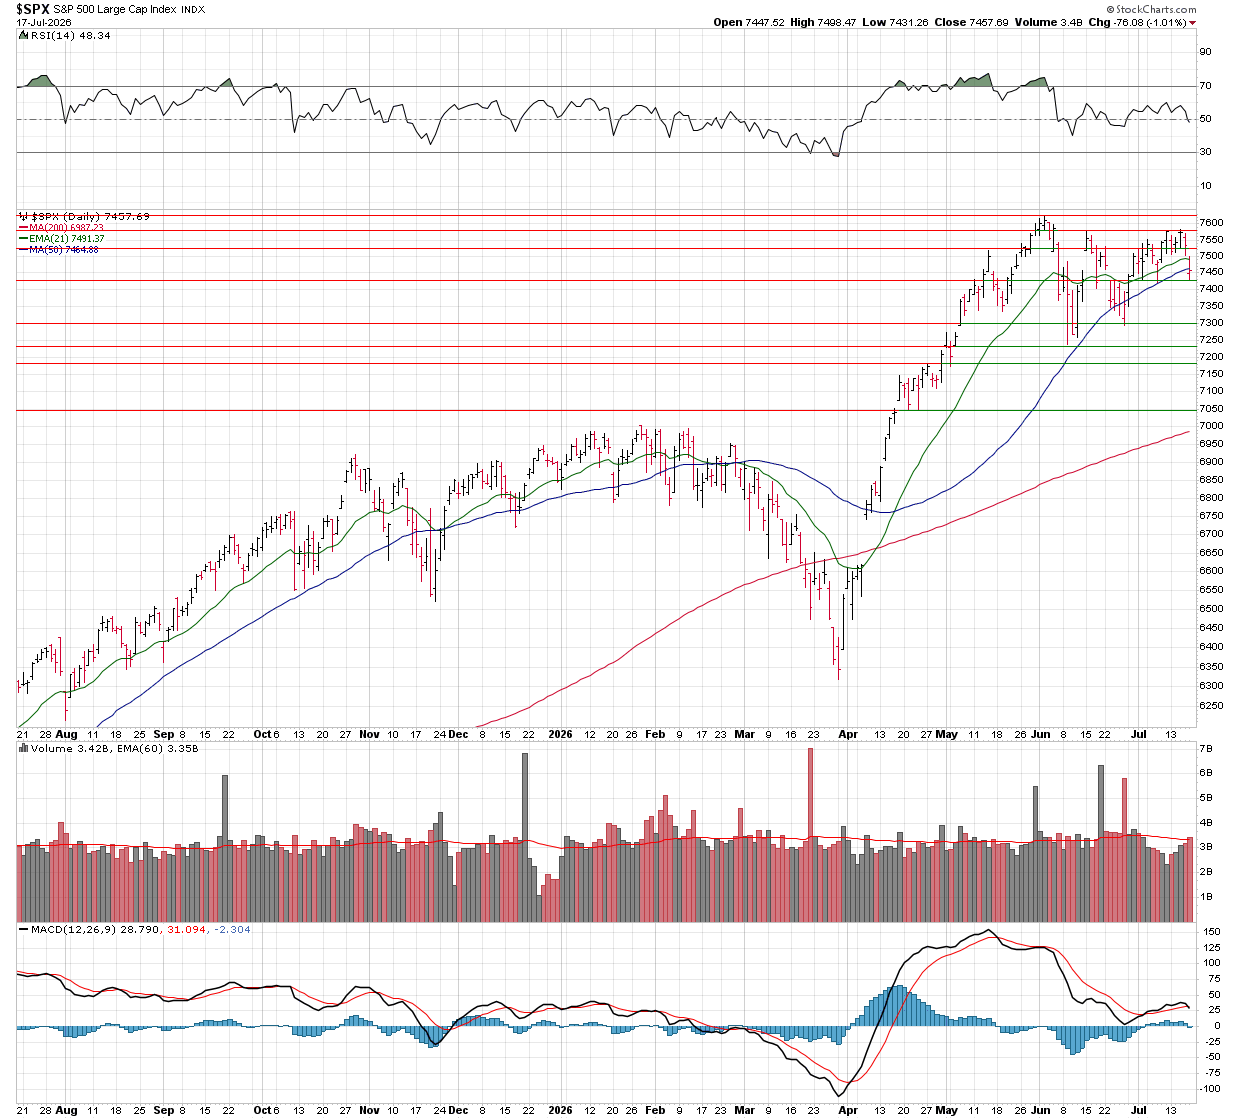
The S&P 500 fell 1.55% last week to close at 7,457.69 after failing to break above the July high near 7,575 on Wednesday and selling off into Friday’s close. The index slipped below both the 21-day EMA near 7,492 and the 50-day moving average near 7,465, while testing initial support around 7,425. Momentum has weakened, with the RSI falling back below 50 and the MACD beginning to roll over, but the broader uptrend remains intact as the index continues to trade well above its rising 200-day moving average near 6,987. A sustained break below 7,425 would increase the risk of a deeper pullback toward the 7,300–7,250 area, while a quick recovery back above the short-term moving averages would keep the recent consolidation constructive and bring the 7,550–7,600 resistance zone back into focus.
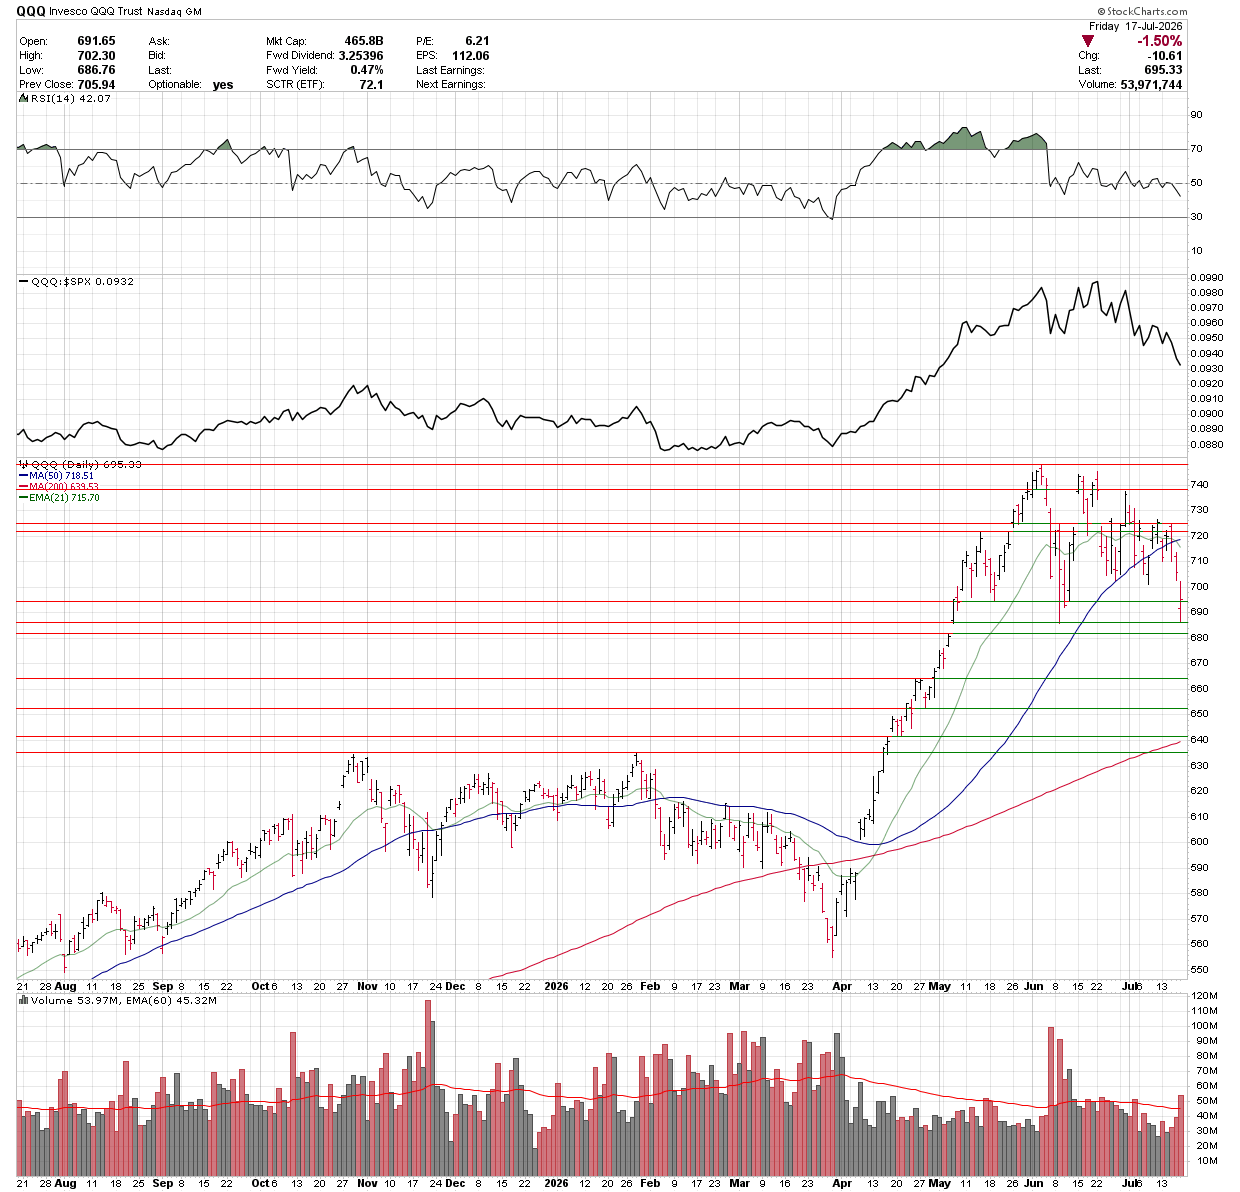
The QQQ Trust led the market lower last week, falling 4.16% to close at 695.33 as technology and other growth stocks came under heavy pressure. The ETF broke below both its 21-day EMA near 715.70 and 50-day moving average near 718.51, then tested the June lows around 685–$690 on Friday before closing off the session low. Momentum has weakened sharply, with the RSI falling to roughly 42, while QQQ’s relative-strength line versus the S&P 500 has also rolled over, confirming a clear loss of leadership. The 685–690 area is now the key near-term support zone; a decisive break below it would expose the mid-660s, while an initial recovery would need to reclaim 700 and then the clustered moving averages around 715–720. With several major technology companies reporting in the coming week, the setup is technically fragile but also increasingly positioned for a sharp reaction in either direction.
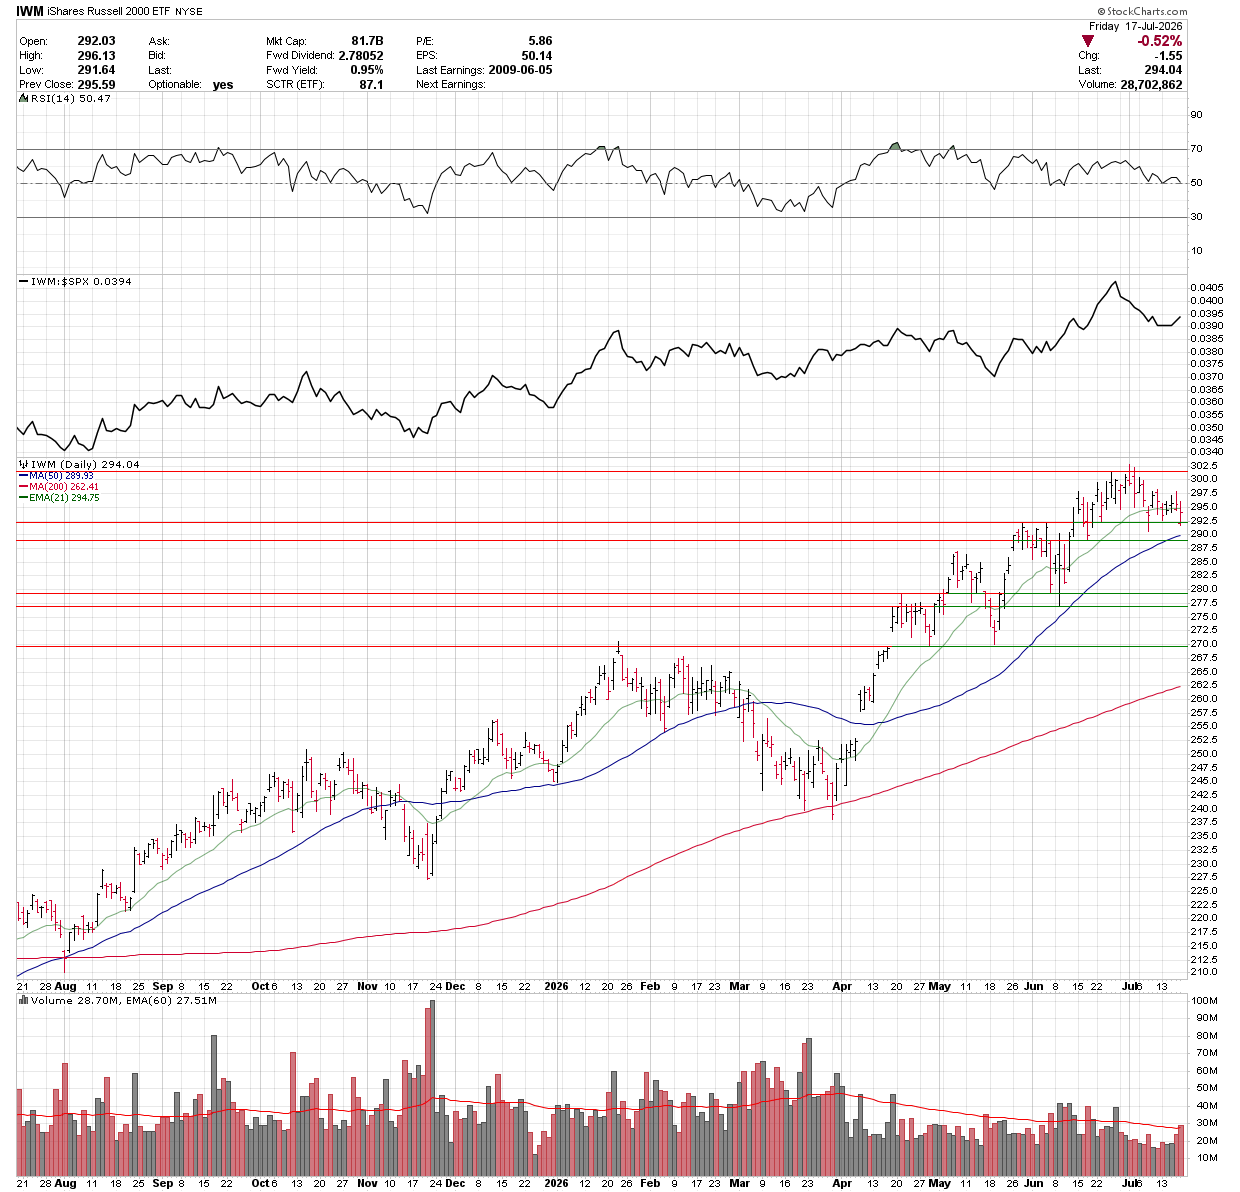
The iShares Russell 2000 ETF fell 0.66% last week, spending most of the period consolidating above support in the 290–292 area before closing at 294.04, slightly below its 21-day EMA at 294.75. The near-term setup remains neutral, with RSI holding near 50 and momentum cooling rather than breaking down. Importantly, IWM continued to show relative strength versus the S&P 500, indicating that small caps were holding up better than large-cap technology even as broader market participation remained uneven. Holding 290–292 would preserve the broader uptrend and keep the 297.50–300 resistance zone within reach, while a decisive break below 290 would weaken the structure and raise the risk of a pullback toward the rising 50-day moving average near 289.93, followed by support around 278–280.
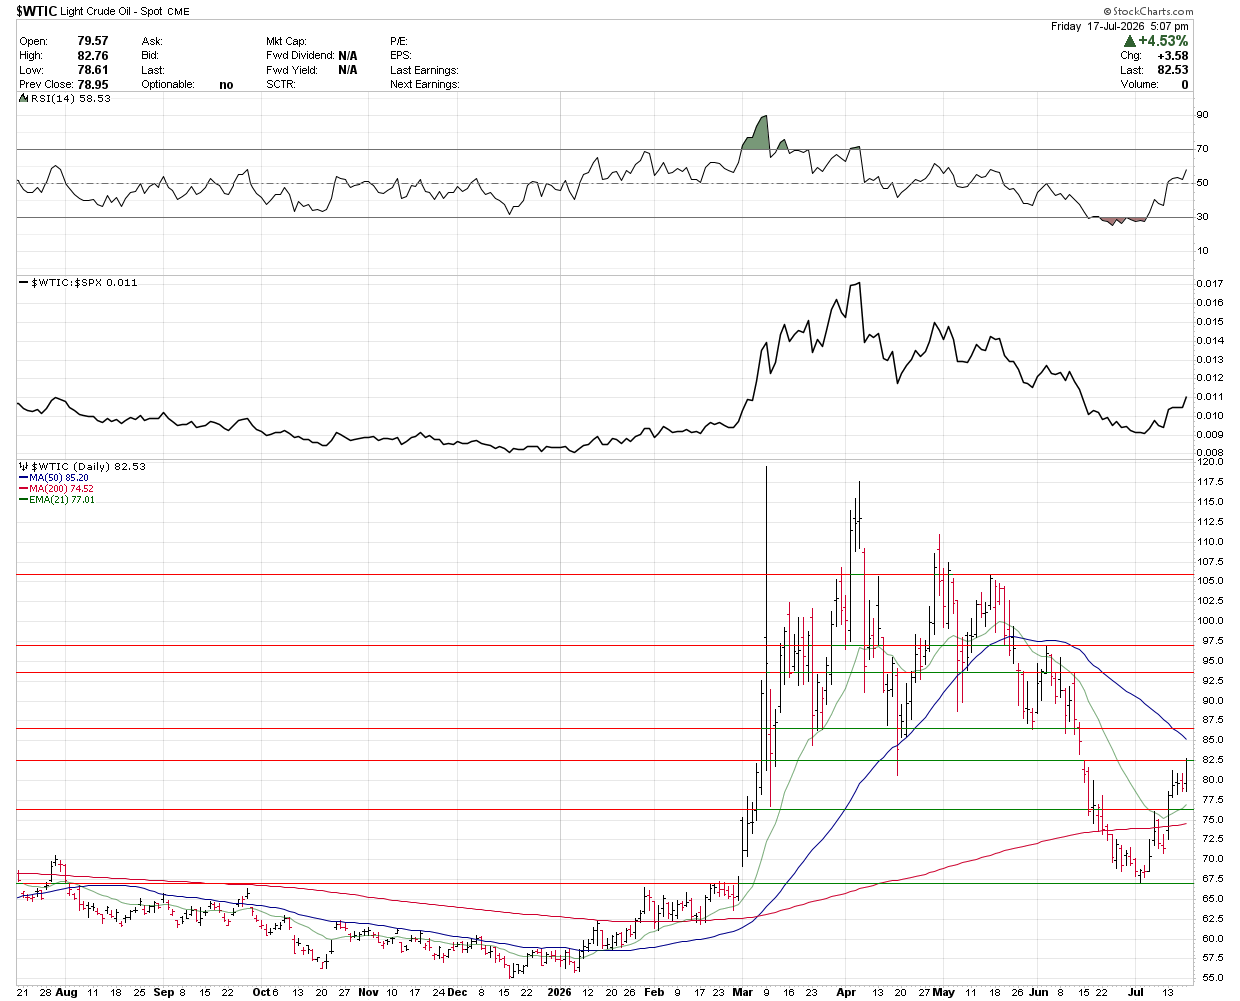
WTI surged 15.57% for the week to close at $82.53, extending its rebound to nearly 20% from the early-July low. The rally was driven by renewed escalation between the United States and Iran, including fresh strikes on Iranian infrastructure, retaliatory attacks across the Gulf and concern that shipping disruptions could expand beyond the Strait of Hormuz into other regional trade routes. Friday’s 4.5% advance pushed crude above the $80 level and toward resistance near $85–$86, while the rising oil-to-S&P 500 ratio showed energy prices materially outperforming the broader equity market.
The U.S. Dollar Index slipped 0.21% for the week to close at 100.76 after briefly breaking below key support near 100.50. Buyers stepped in quickly at that level, keeping the index above its rising 50-day moving average near 100.08. A sustained move below 100.50 would weaken the near-term setup and could open the door to a test of 100.00, while a rebound through 101.25–101.50 would put the recent highs back in play.
Gold fell 2.53% last week to close at $4,016.89, keeping pressure on the psychologically important $4,000 area after another unsuccessful attempt to regain its short-term trend. Price remains just below the 21-day EMA near $4,109 and well beneath the declining 50-day moving average, while support around $3,950–$4,000 is now being tested. Momentum has started to stabilize, with the RSI recovering toward 41 and the MACD histogram turning modestly positive, suggesting downside pressure may be easing. This looks like a credible area for a countertrend rally to develop, particularly if buyers continue defending $4,000, but the signals remain early and gold would need to reclaim roughly $4,100–$4,200 to confirm that a more durable rebound is underway.
Silver fell 6.59% last week to close at $55.91, extending its breakdown below the 21-day EMA, 50-day moving average and 200-day moving average. The metal is now approaching an important support zone near $50, with the next major level closer to $45 if that area fails to hold. Momentum remains decisively weak, with the RSI near 35 and silver continuing to underperform the S&P 500, although the increasingly oversold setup and a slight improvement in the MACD histogram suggest selling pressure may be starting to ease. Given the magnitude of the decline, a considerable rebound could develop if buyers successfully defend the $45–$50 region, but the broader technical picture will remain damaged until silver can reclaim the $60 area and begin moving back above its short-term averages.
Copper fell 0.21% last week to close at $6.22, slipping back below both the 21-day EMA and 50-day moving average. Price action stalled just below $6.40 before retreating into the end of the week, leaving copper in a near-term consolidation phase. Despite the loss of short-term momentum, the broader trend remains constructive, with prices still trading comfortably above the rising 200-day moving average near $5.72.
Bitcoin traded largely sideways over the past week, briefly pushing above $65,000 before dipping toward $62,500 and recovering to settle around $64000–$65,000. Price is now holding just above both the 21-day EMA and 50-day moving average, while momentum continues to improve, with RSI back above 50 and MACD turning higher. A sustained move through $65,000 could open the door to the $67,500–$70,000 area, while a break below $62,500 would put the recent lows near $59,000–$60,000 back in play. The larger trend remains under pressure as Bitcoin continues to trade well below its declining 200-day moving average near $73,200.
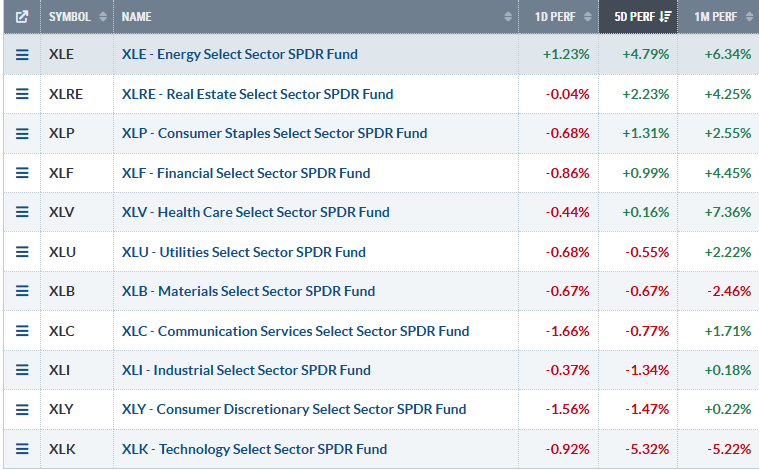
Sector performance remained defensive and uneven, with leadership concentrated rather than broadly distributed. Energy was the clear standout, gaining 1.23% on the day and 6.34% over the past month, while real estate, financials, healthcare and consumer staples also maintained positive monthly trends. Technology remained the weakest major group, falling 0.92% on the day and more than 5% over both the past week and month, with communication services and consumer discretionary also under pressure. Small caps and transports showed relative resilience, but the overall pattern was better characterized as a narrow defensive and cyclical rotation than a meaningful broadening of market leadership.
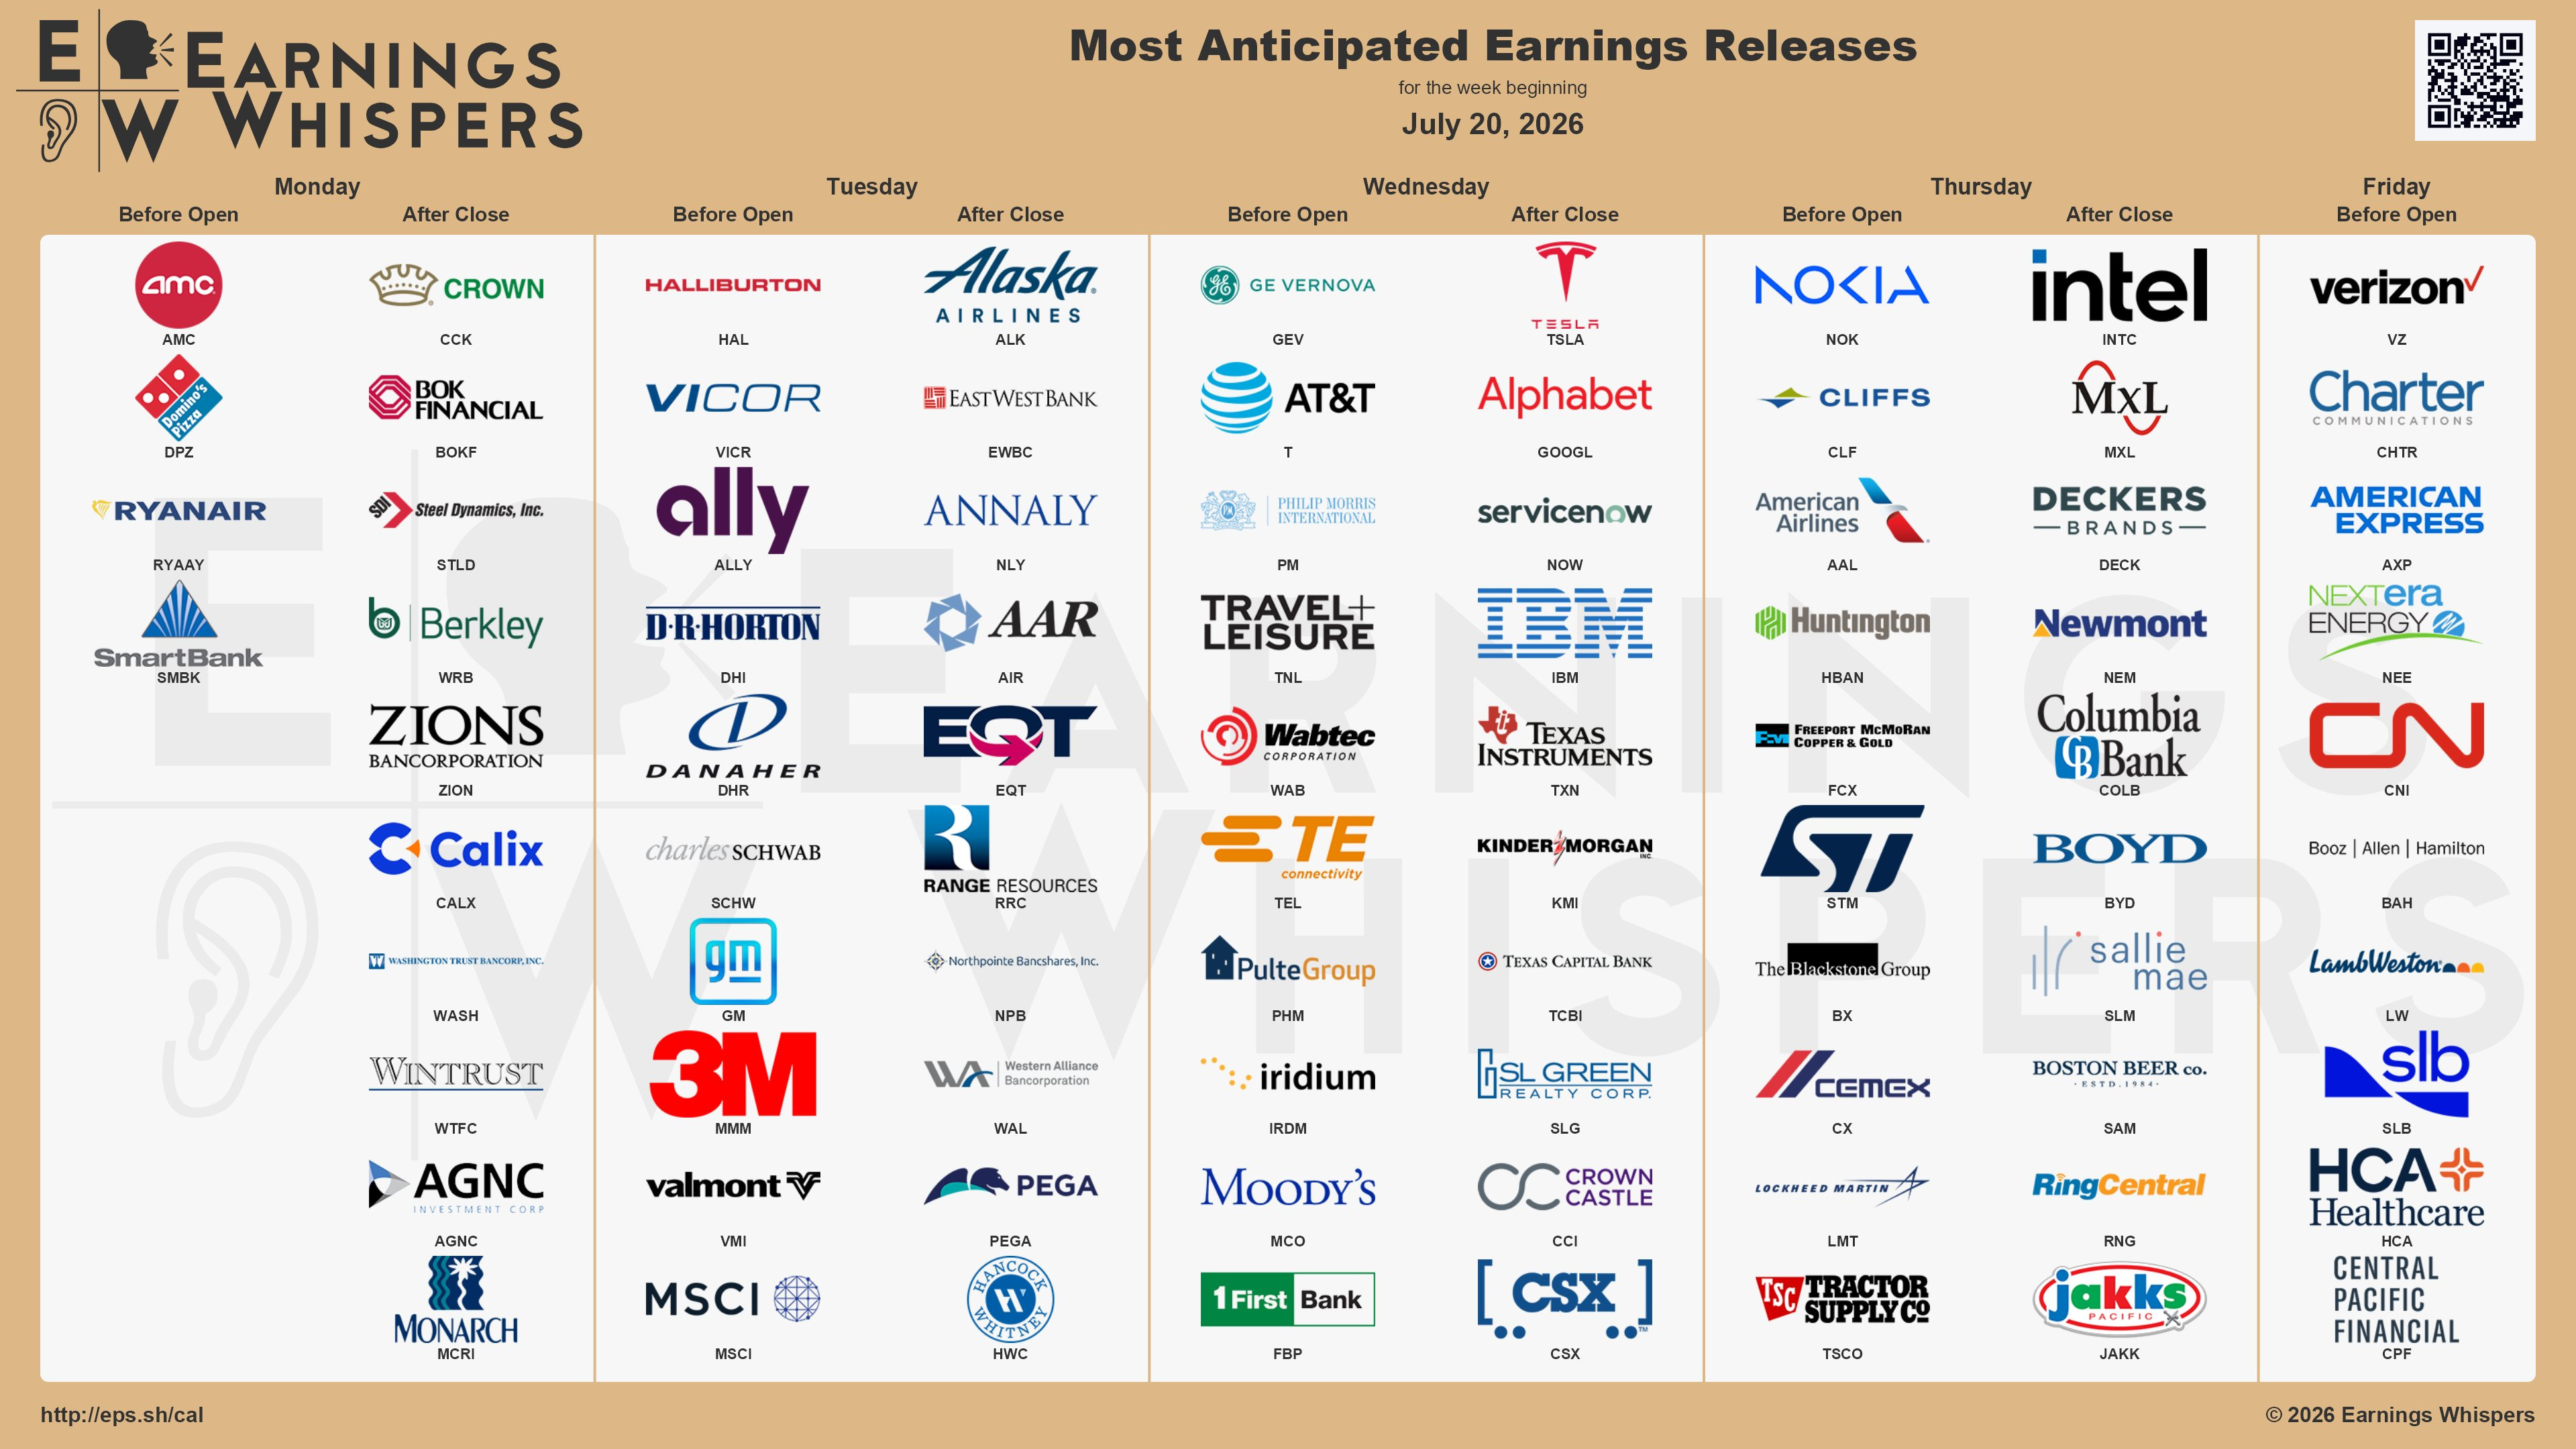
The earnings calendar accelerates next week with several market-moving reports concentrated from Wednesday through Friday. Tesla, Alphabet, IBM and ServiceNow headline Wednesday after the close, followed Thursday by Nokia before the open and Intel after the bell. Investors will also hear from AT&T, GE Vernova, Texas Instruments, Freeport-McMoRan, Newmont, American Airlines and Deckers Brands, providing fresh signals across technology, AI infrastructure, industrials, commodities, consumer demand and travel. Friday’s lineup includes Verizon, Charter Communications, American Express, NextEra Energy, SLB and HCA Healthcare, making the week an important test of whether earnings growth can justify current valuations and broaden market leadership.
🕓 10:00 AM — Leading Index MoM (Jun): Est. -0.1% | Prior 0.1%
🕓 11:30 AM — 3-Month Bill Auction: Prior 3.760%
🕓 11:30 AM — 6-Month Bill Auction: Prior 3.860%
☀️ 8:15 AM — Weekly ADP Employment Change: Prior 19.8K
☀️ 8:55 AM — Redbook YoY: Prior 8.2%
🌙 4:30 PM — API Weekly Crude Oil Stocks: Prior -0.056M
☀️ 7:00 AM — MBA 30-Year Mortgage Rate: Prior 6.65%
☀️ 7:00 AM — MBA Mortgage Applications WoW: Prior -2.7%
☀️ 7:00 AM — MBA Purchase Index: Prior 157.2
☀️ 7:00 AM — Mortgage Market Index: Prior 259.1
☀️ 7:00 AM — Mortgage Refinance Index: Prior 821.9
🕓 10:30 AM — Crude Oil Inventories: Prior -1.692M
🕓 10:30 AM — Cushing Crude Oil Inventories: Prior +0.430M
🕓 10:30 AM — Refinery Crude Runs WoW: Prior +0.099M
🕓 10:30 AM — Refinery Utilization WoW: Prior +0.4%
🕓 10:30 AM — Gasoline Production: Prior -0.096M
🕓 10:30 AM — Heating Oil Stockpiles: Prior +0.030M
🕓 10:30 AM — Distillate Inventories: Prior +4.556M
🕓 10:30 AM — Crude Oil Imports: Prior -0.399M
🕓 10:30 AM — Gasoline Inventories: Prior -1.533M
🕓 10:30 AM — Distillate Fuel Production: Prior +0.072M
🕓 1:00 PM — 20-Year Treasury Auction: Prior 4.927%
☀️ 8:30 AM — Initial Jobless Claims: Est. 211K | Prior 208K
☀️ 8:30 AM — Continuing Jobless Claims: Prior 1.805M
☀️ 8:30 AM — Chicago Fed National Activity Index (Jun): Prior -0.10
☀️ 8:30 AM — Jobless Claims Four-Week Average: Prior 214.25K
🕓 10:30 AM — Natural Gas Storage: Prior +41B
🕓 11:00 AM — Kansas City Fed Manufacturing Index (Jul): Prior 19
🕓 11:00 AM — Kansas City Fed Composite Index (Jul): Prior 11
🕓 11:30 AM — 4-Week Bill Auction: Prior 3.660%
🕓 11:30 AM — 8-Week Bill Auction: Prior 3.650%
🕓 1:00 PM — 10-Year TIPS Auction: Prior 2.169%
☀️ 8:00 AM — Building Permits (Jun): Est. 1.367M | Prior 1.410M
☀️ 8:00 AM — Building Permits MoM (Jun): Est. -3.0% | Prior -0.9%
☀️ 9:45 AM — S&P Global Manufacturing PMI (Jul): Est. 54.5 | Prior 53.9
☀️ 9:45 AM — S&P Global Services PMI (Jul): Est. 51.4 | Prior 51.2
☀️ 9:45 AM — S&P Global Composite PMI (Jul): Prior 51.9
🕓 10:00 AM — New Home Sales (Jun): Est. 604K | Prior 580K
🕓 10:00 AM — New Home Sales MoM (Jun): Prior -7.3%
🕓 1:00 PM — Baker Hughes Oil Rig Count: Prior 452
🕓 1:00 PM — Baker Hughes Total Rig Count: Prior 588
🌙 3:30 PM — CFTC S&P 500 Net Positions: Prior -38.9K
🌙 3:30 PM — CFTC Nasdaq 100 Net Positions: Prior +2.7K
🌙 3:30 PM — CFTC Gold Net Positions: Prior 186.7K
🌙 3:30 PM — CFTC Crude Oil Net Positions: Prior 62.7K
🌙 3:30 PM — CFTC Aluminium Net Positions: Prior -0.7K
🌙 3:30 PM — CFTC Copper Net Positions: Prior 64.4K
🌙 3:30 PM — CFTC Silver Net Positions: Prior 25.1K
🌙 3:30 PM — CFTC Natural Gas Net Positions: Prior -178.6K
🌙 3:30 PM — CFTC Wheat Net Positions: Prior -16.3K
🌙 3:30 PM — CFTC Corn Net Positions: Prior 131.5K
🌙 3:30 PM — CFTC Soybean Net Positions: Prior 125.4K
The market enters the coming week with its near-term direction increasingly dependent on whether geopolitical escalation continues to overpower improving domestic fundamentals. Softer inflation data, resilient labor conditions and pockets of strength in manufacturing offered support beneath the surface, but elevated long-term yields and the sharp deterioration in technology leadership materially changed the risk balance. The S&P 500 and QQQ are testing important technical areas, while small caps and transports have held up comparatively better, leaving the market in an uneven rotation rather than a uniform breakdown. With several major technology and industrial companies reporting earnings, investors will be looking for evidence that profit growth can stabilize the market and broaden participation. Further escalation in the Middle East remains the primary external risk, particularly if it intensifies inflation pressure and places additional strain on equities and bonds.
The economic calendar is relatively light early in the week before activity picks up on Thursday and Friday. Monday’s Leading Index and Treasury bill auctions should draw limited attention, while Tuesday brings weekly ADP employment data and the API crude inventory report. Wednesday is centered on mortgage activity, the EIA petroleum report and the 20-year Treasury auction. Thursday’s initial and continuing jobless claims will provide the clearest update on labor-market conditions, alongside the Chicago Fed index, regional manufacturing data and a 10-year TIPS auction. Friday carries the heaviest macro slate, with building permits, preliminary S&P Global PMIs and new-home sales offering a broader read on housing and business activity, followed later by rig counts and CFTC positioning data.
That’s all for this week. Take care.
Eric
No posts
Comments
Nothing yet. Say the first thing.
Sign in to join the conversation.