
Welcome to The Merciless Trade, where I break down significant updates in the financial markets and find connections between them. Preparing you for the week ahead as I flip through charts, analyze the data, and cut through the noise to get an edge.
Now let’s do this…
Iran and the broader Middle East remained the dominant macro force last week, driving volatility across oil, rates and risk assets. Renewed U.S.-Iran military strikes initially lifted crude prices, while diplomatic efforts involving Qatar, Pakistan and Oman attempted to contain the escalation and revive negotiations. Those efforts stabilized markets through Friday, but conditions deteriorated again over the weekend. Iran declared the Strait of Hormuz closed, while Washington maintained that it remained open to commercial traffic. In practice, tanker flows were heavily reduced, leaving the route’s legal status disputed but its operational risk clearly elevated. Additional U.S. strikes and Iranian retaliation across the Gulf raised the risk of renewed volatility in energy prices, inflation expectations and global risk appetite as the new week begins.
U.S. data continued to show moderate but uneven expansion. Services remained in growth territory and jobless claims stayed contained, while softer hiring measures and weaker housing activity pointed to cooling beneath the surface. That combination kept the Fed focused on persistent inflation risks and contributed to a bearish steepening of the Treasury curve, with the 10-year ending near 4.56% and the 30-year above 5%.
Federal Reserve officials continued to emphasize inflation risks rather than declaring victory. Chair Kevin Warsh said prices remain too high and indicated that the Fed will rely more heavily on real-time data while moving away from predictable forward guidance. Governor Waller said the balance of economic risks had “completely flipped,” but reaffirmed the credibility of the 2% inflation target, while Cleveland Fed President Hammack warned that elevated core inflation may eventually force policymakers to consider additional tightening. Treasury yields rose into the weekend, especially at the long end, as investors balanced softer growth signals against persistent inflation, energy and fiscal concerns.
Elsewhere, OPEC+ agreed to increase output quotas by 188,000 barrels per day, while the Trump administration reportedly backed legislation targeting countries that continue to purchase Russian energy and issued additional Iran-related sanctions. Earnings season also began on a constructive note, with Delta beating expectations and raising guidance, while major financial institutions prepared to report in the coming week. Equity markets remained resilient despite the geopolitical backdrop, with the Dow reaching 53,000 for the first time and the S&P 500 coming off its strongest quarter since 2020, though concerns over elevated AI-related valuations continued to hang over the third-quarter outlook.
Last week’s economic data pointed to a still-expanding economy, but with clear signs of cooling beneath the surface. Services activity remained in growth territory, with the ISM non-manufacturing index at 54.0 and employment improving to 51.2, while S&P Global’s services and composite PMIs stayed modestly above 50. Labor conditions also held up better than expected, as initial claims came in at 215,000 and continuing claims at 1.814 million, though ADP’s weekly hiring measure slowed and the Conference Board’s Employment Trends Index edged lower. Consumer spending remained firm, with Redbook sales up 11.5% year over year, but housing weakened as existing home sales fell 2.4% to 4.09 million, below estimates. Trade data showed a slightly narrower deficit, though both exports and imports reflected softer underlying momentum, while wholesale inventories rose less than expected. Energy data were mixed, with a smaller-than-expected crude draw and the total U.S. rig count rising by one to 581.

Baker Hughes Oil Rig Count +0 To 445 (Unchnaged); U.S. Baker Hughes NatGas Rig Count +1 To 127; U.S. Baker Hughes Total Rig Count 581 Vs 580 Prior
Existing Home Sales (MoM) For June -2.4% Vs 3.7% Prior
Existing Home Sales For June 4.09M Vs 4.19M Est.
Initial Jobless Claims Revises Prior From 215K To 217K
Initial Jobless Claims 215K Vs 218K Est.
Continuing Jobless Claims 1,814K Vs 1,820K Est.
Wholesale Inventories (MoM) For May 0.1% Vs 0.3% Est
Wholesale Trade Sales (MoM) For May 3.4% Vs 2.2% Prior
API Crude Oil Stock 0.399M Barrel Draw Vs 1.500M Barrel Draw
Est.Redbook Retail Sales Index Up 11.5% YoY For Week Ended 7/04/26
Redbook Retail Sales Index For June 2026 Vs June 2025: 10.1% YoY
Imports For May 395.3B Vs 383.00B Prior
Trade Balance For May -77.60B Vs -78.30B Est.
Exports For May 317.70B Vs 327.10B Prior
ADP Employment Change Weekly 21.00K Vs 30.75K Prior
CB Employment Trends Index For June 106.69 Vs 107.01 Prior
ISM Non-Manufacturing Employment For June 51.2 Vs 47.9 Prior
ISM Non-Manufacturing PMI For June 54.0 Vs 54.2 Est.
ISM Non-Manufacturing Prices For June 67.7 Vs 71.3 Prior
S&P Global Composite PMI For June 51.9 Vs 52.2 Est.
S&P Global Services PMI For June 51.2 Vs 51.3 Est
Treasury yields rose across the curve last week, but the heavier selling remained concentrated in longer maturities. The 2-year yield increased just 4 basis points, compared with a 7-basis-point rise in the benchmark 10-year, while the 20-year climbed 9 basis points and the 30-year added 8, pushing back above the closely watched 5% threshold during the week. Renewed U.S.-Iran tensions and the accompanying rise in crude prices revived inflation concerns, while resilient risk appetite and persistent fiscal and term-premium worries reduced demand for duration. Importantly, the week’s 3-, 10- and 30-year Treasury auctions were well received, suggesting the long-end selloff was not driven by a collapse in demand so much as a repricing of inflation, geopolitical and fiscal risk. The result was another bearish steepening of the curve: the front end remained relatively anchored by uncertainty over the Fed and the softer labor backdrop, while investors demanded greater compensation to hold longer-dated government debt
The 2-Year closed at 4.22%
The 5-Year closed at 4.31%
The 10-Year closed at 4.56%
The 20-Year closed at 5.07%
The 30-Year closed at 5.06%
For the July 29 Fed meeting, markets price a 65.8% probability that rates remain unchanged and a 34.2% probability of a 25-basis-point increase.
For the September 16 Fed meeting, markets are currently pricing a 30.4% chance that rates remain unchanged, with a 51.2% chance of a 25-basis-point hike, a 18.4% chance of a 50-basis-point hike.
For the October 28 meeting, markets price a 23.6% probability that rates remain unchanged and a combined 76.4% probability of at least one increase, including a 46.6% probability of a 25-basis-point increase, 25.7% for 50 basis points and 4.1% for 75 basis points.
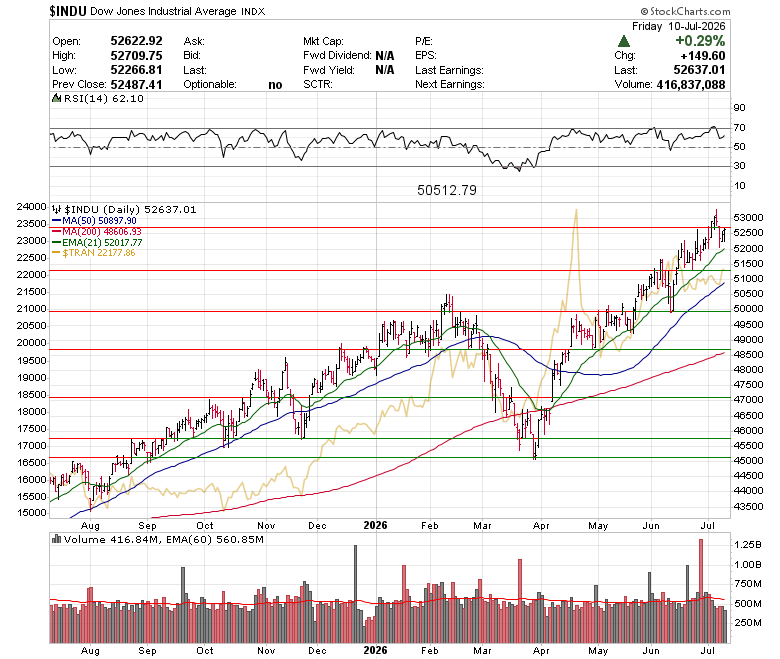
The Dow Jones slipped 0.50% last week to close at 52,637.01, but the broader uptrend remains intact. The index continues to hold above its rising 21-day EMA near 52,018 and well above the 50-day moving average near 50,897, preserving the bullish intermediate structure. Momentum remains constructive, with the RSI near 62, though the Dow is pressing into resistance around 53,000–53,200 after a strong multi-month advance. A breakout above that zone would extend the move to fresh highs, while a break below the 21-day EMA would raise the risk of a deeper pullback toward 51,500 and then the 50-day average. The Dow Transports provided a positive divergence, rising 0.74% to 22,177.86 and closing at a multi-month high, adding support to the broader industrial trend despite the modest decline in the headline index.
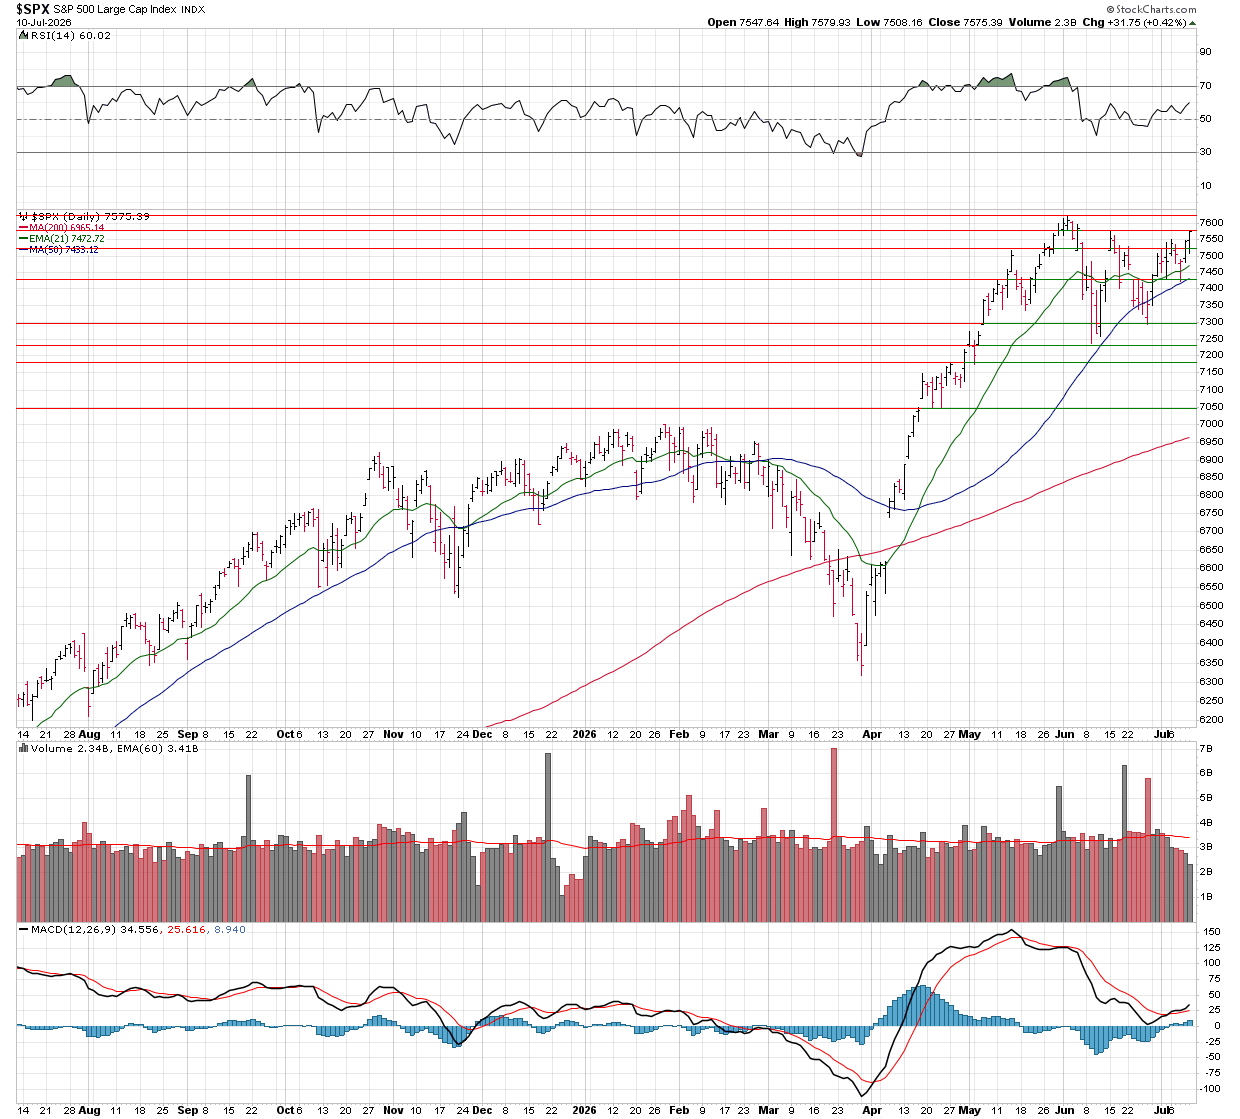
The S&P 500 rose 1.23% last week to close at 7,575, finishing directly beneath resistance near the 7,600 area as the market prepares for another breakout attempt. The index remains above its rising 21-day EMA near 7,473 and 50-day moving average near 7,433, keeping the intermediate trend firmly bullish. Momentum also improved, with the RSI climbing to roughly 60 and the MACD turning higher. A decisive close above 7,600 would confirm a fresh breakout and open the door to new highs, while failure at resistance would leave initial support near 7,500–7,475, followed by the 50-day moving average.
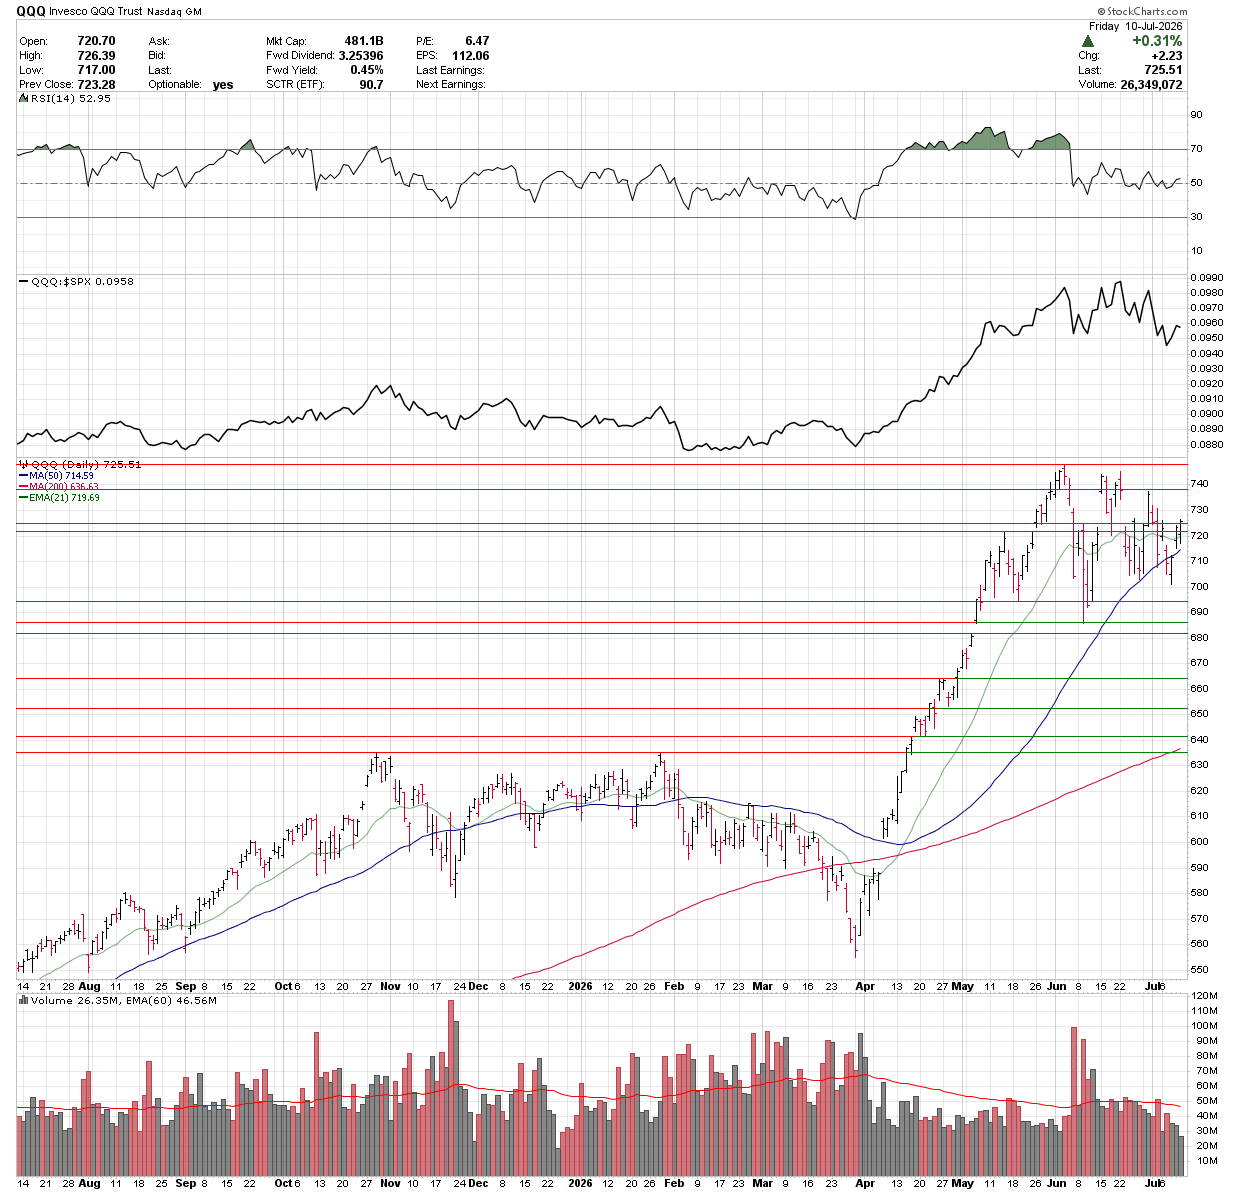
The QQQ Trust rose 1.18% last week to close at 725.51, finishing just above the key 725 area as technology leadership remained intact. The ETF also held above its rising 21-day EMA near 719.69 and 50-day moving average near 714.59, preserving the bullish intermediate trend. Momentum improved modestly, with the RSI moving back above 50, but QQQ still faces overhead resistance near 730–735, followed by the recent highs around 742–745. Holding above 725 would strengthen the breakout setup, while a failure back below that level would put the 21-day EMA and then the 714–715 area back in play.
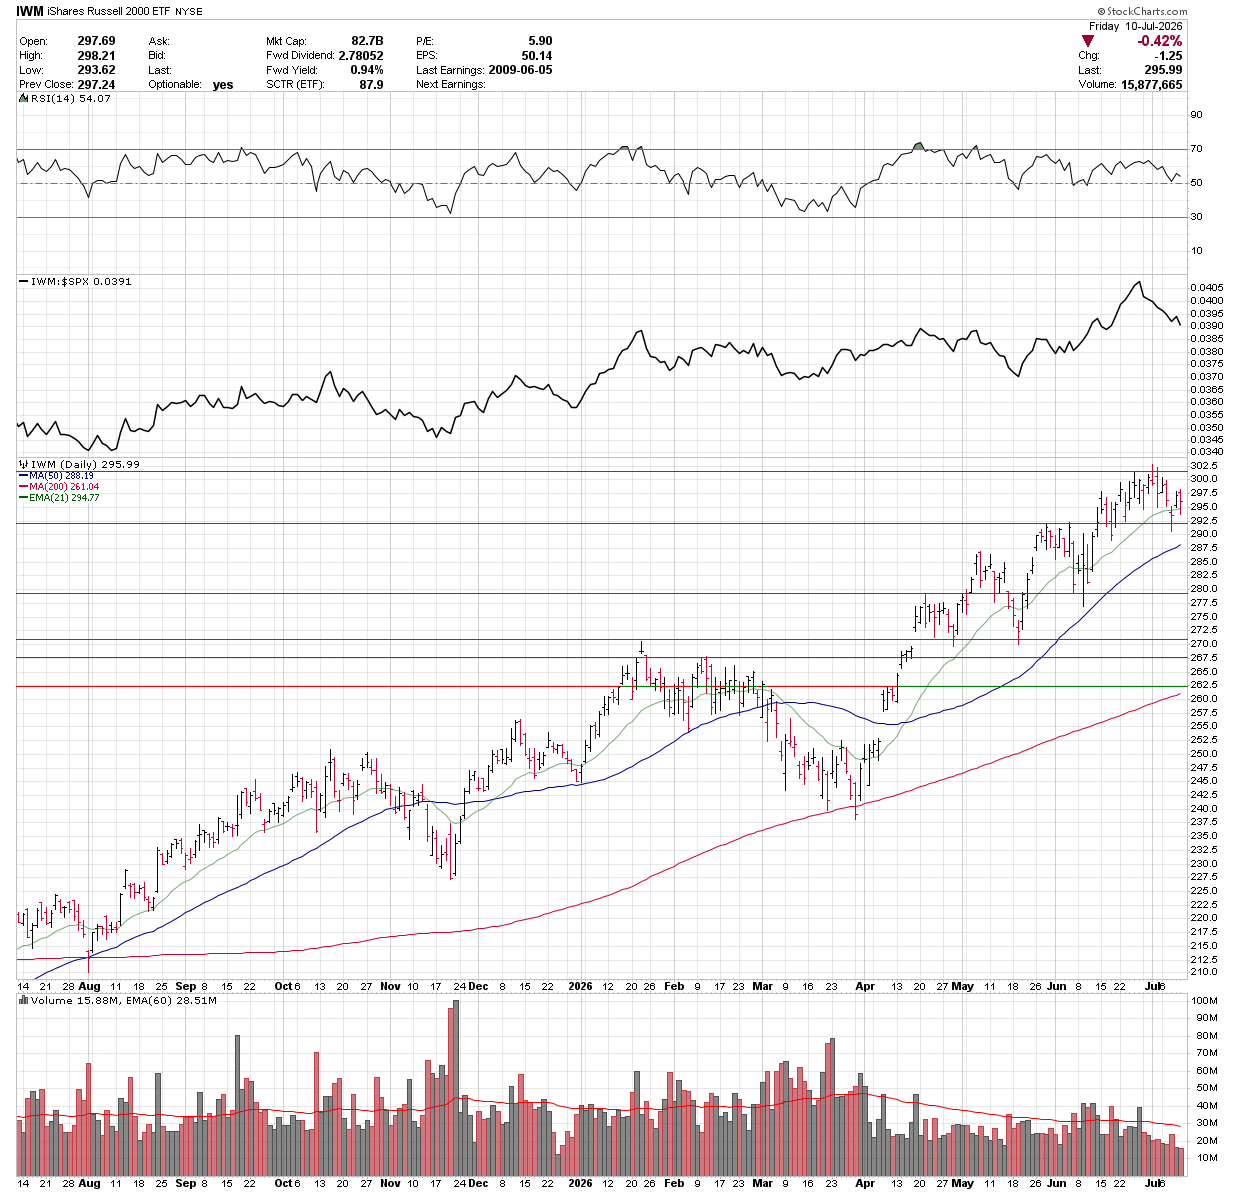
The IWM Russell 2000 ETF fell 0.53% last week to close at 295.99, not $259.99, as small caps struggled to hold their gains in a choppy tape. The ETF briefly slipped below its 21-day EMA midweek but recovered to finish just above the average near 294.77, keeping the short-term uptrend intact. The 50-day moving average remains well below near 288.19, while the RSI bounced from the 50 area and closed near 54, signaling that momentum has weakened but has not broken down. Holding the 294–295 area keeps the recent highs near 300–302 in play, while a decisive break below the 21-day EMA would raise the risk of a pullback toward the 50-day average.
WTI rebounded nearly 4% last week to settle at $71.41, reclaiming the $70 level after falling more than 20% during the previous month. Brent gained approximately 5.5% to close at $76.01. Although both benchmarks declined during Friday’s session as diplomatic efforts encouraged hopes of de-escalation, they still posted strong weekly gains as renewed U.S.-Iran hostilities restored a geopolitical risk premium. The outlook became more uncertain over the weekend after Iran declared the Strait of Hormuz closed while Washington insisted that the shipping route remained open. The market is therefore not yet pricing a confirmed, sustained disruption to Gulf exports, but any evidence that tanker traffic or regional production is being materially affected could quickly push crude and inflation expectations higher.
The U.S. Dollar Index rose 0.9% last week to close near 100.97, rebounding after successfully testing support around 100.50 twice in July. The repeated defense of that level has strengthened the near-term setup, with the index holding well above its rising 50-day moving average near 99.82 and 200-day moving average near 99.00. Momentum has also improved, with the RSI climbing to roughly 57. A sustained move above 101.25–101.50 would put the recent high near 101.75 back in play, while a break below 100.50 would weaken the rebound and expose the 100.00–99.80 support zone.
Gold fell 0.7% last week to close at $4,119.70, remaining pinned beneath the declining 21-day EMA near $4,162.51. The metal is attempting to stabilize after rebounding from the late-June low near $4,000, but the short-term trend remains weak while price stays below the 21-day average and the 50-day moving average near $4,371. Momentum has improved modestly, with the MACD turning higher from deeply negative levels, but the RSI remains below 50. A sustained close above $4,160–$4,200 would improve the near-term setup and open a move toward $4,300–$4,400, while renewed weakness below $4,075–$4,000 would expose the recent lows and reinforce the broader downtrend.
Silver fell 1.78% last week to close at $59.05, finishing just below the $60 level and remaining pinned beneath its declining 21-day EMA near $62.40. The metal is attempting to stabilize after the sharp June breakdown, but the short-term trend remains weak while price stays below both the 21-day EMA and the 50-day moving average near $70.17. Momentum has improved slightly, with the MACD curling higher and the histogram turning positive, but the RSI remains below 40. A sustained move back above $60–$62.40 would strengthen the rebound and target the $65–$67 resistance area, while failure to hold support near $57–$55 would expose another leg lower.
Bitcoin added another 1% last week, holding onto its early-July rebound and closing near $64,131. The cryptocurrency moved back above its 21-day EMA earlier in the month and is now testing the declining 50-day moving average near $64,892, making the $65,000 area the next key technical hurdle. Momentum has improved, with the RSI recovering above 50, but the broader trend remains under pressure while Bitcoin stays below both the 50-day and 200-day moving averages. A decisive break above $65,000–$67,500 would strengthen the recovery and open the door toward $70,000–$75,000, while rejection at the 50-day average would leave support near $62,500, followed by $60,000–$57,500.
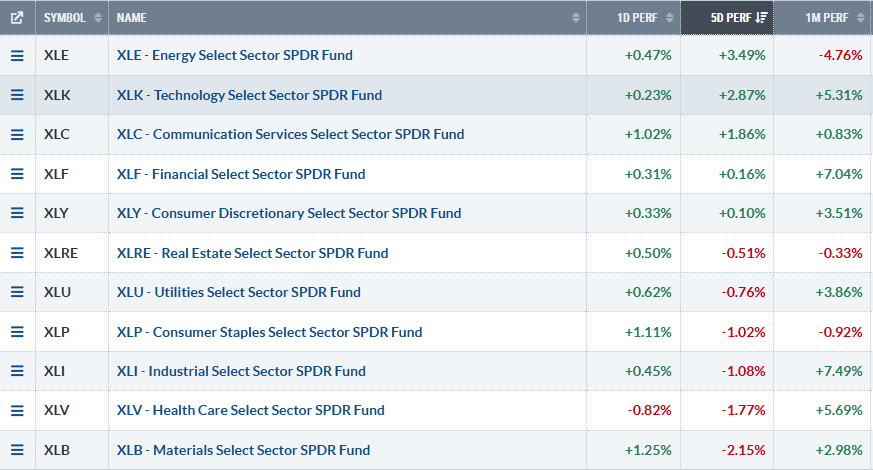
Sector performance was narrowly positive last week, with leadership concentrated in energy, technology and communication services. XLE led with a 3.49% gain as crude strength and renewed inflation concerns supported the group, while XLK advanced 2.87% and XLC added 1.86%, keeping large-cap growth firmly in the leadership mix. Financials and consumer discretionary were essentially flat, rising just 0.16% and 0.10%, respectively. The weaker side of the market was concentrated in materials, healthcare and industrials, which fell 2.15%, 1.77% and 1.08%, while staples, utilities and real estate also declined. The split showed a market still willing to own growth and inflation-sensitive energy exposure, but with little broad cyclical participation beneath the surface.
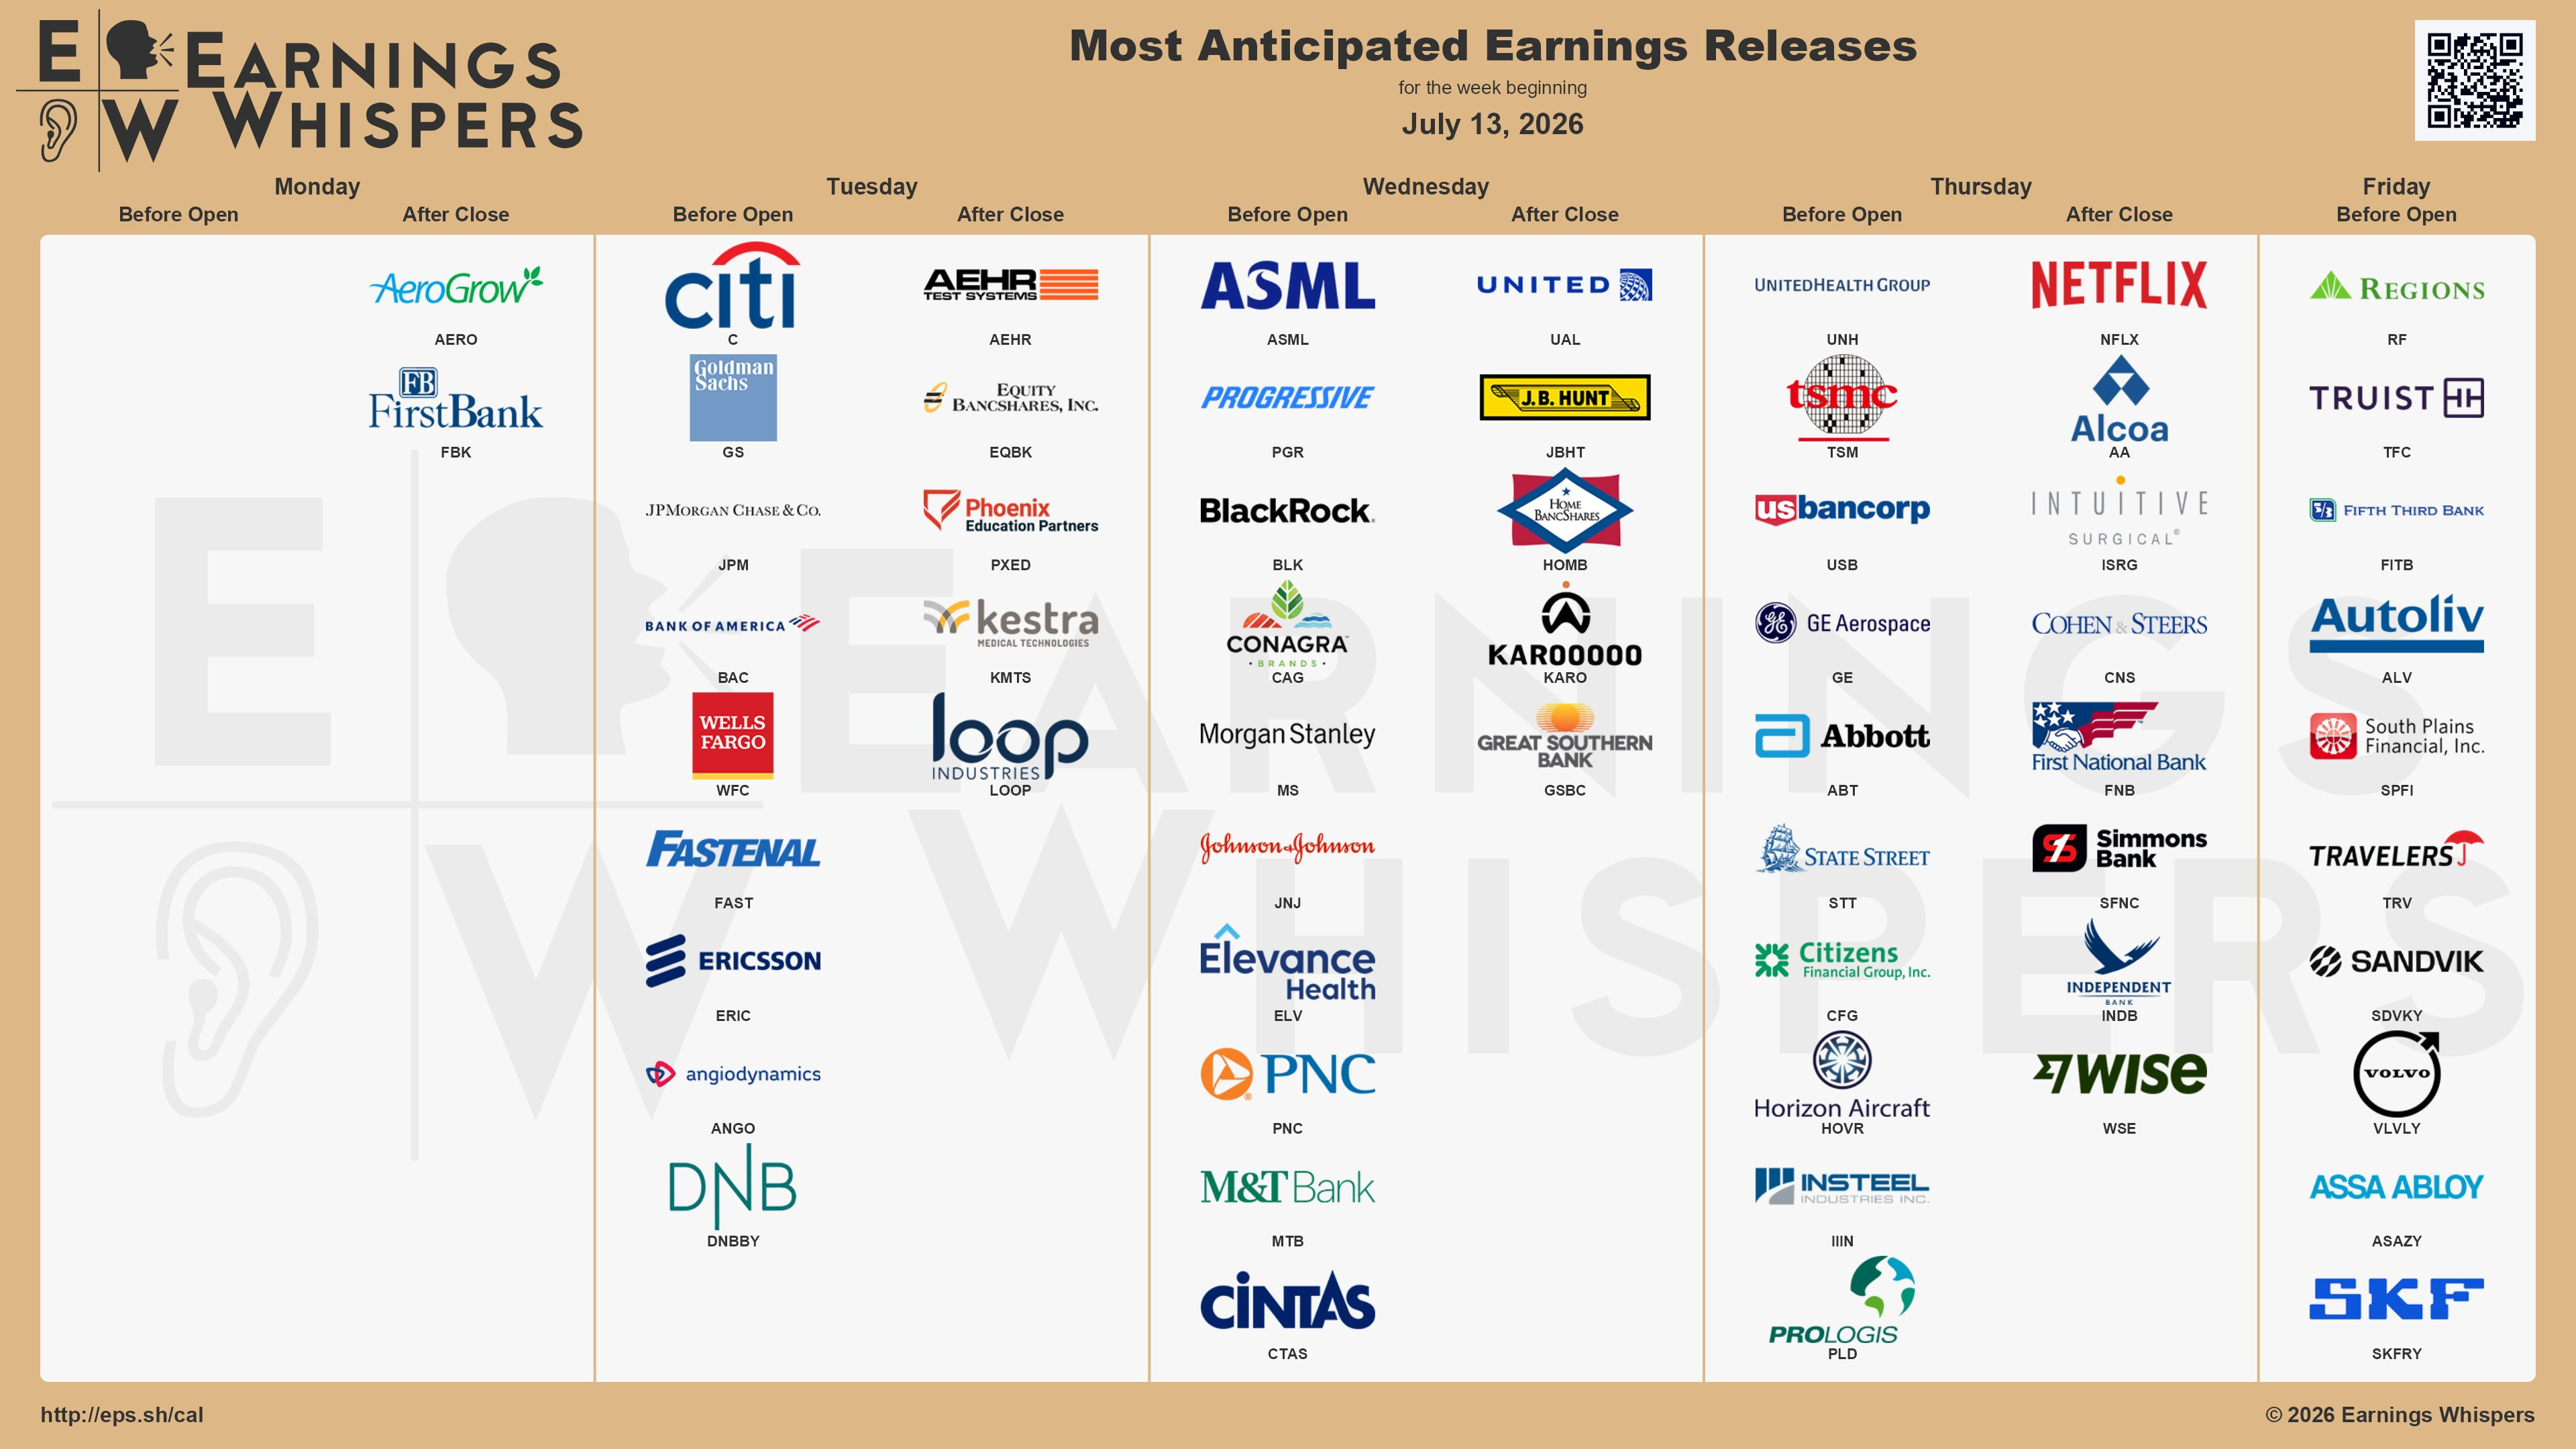
Earnings season ramps up next week with major banks leading Tuesday’s slate, including Citi, Goldman Sachs, JPMorgan, Bank of America and Wells Fargo. Wednesday brings ASML, BlackRock, Morgan Stanley, Johnson & Johnson, PNC and Cintas, followed by United Airlines and J.B. Hunt after the close. Thursday is the busiest day, with UnitedHealth, TSMC, GE Aerospace, Abbott and Prologis reporting before the bell, while Netflix and Alcoa headline after-hours results. Friday rounds out the week with Regions Financial, Truist, Fifth Third, Travelers, Autoliv and several European industrial names.
☀️ 5:25 AM — FOMC Member Bowman Speaks
☀️ 6:00 AM — OPEC Monthly Oil Market Report
🕓 11:30 AM — 3-Month Bill Auction: Prior 3.735%
🕓 11:30 AM — 6-Month Bill Auction: Prior 3.830%
🕓 12:30 PM — Fed Waller Speaks
🕓 2:00 PM — Federal Budget Balance (Jun): Est. -$132.8B | Prior -$293.0B
☀️ 6:00 AM — NFIB Small Business Optimism (Jun): Est. 95.6 | Prior 95.3
☀️ 8:15 AM — ADP Weekly Employment Change: Prior +21K
☀️ 8:30 AM — CPI MoM (Jun): Est. -0.1% | Prior +0.5%
☀️ 8:30 AM — Core CPI MoM (Jun): Est. +0.3% | Prior +0.2%
☀️ 8:30 AM — CPI YoY (Jun): Est. 4.2%
☀️ 8:30 AM — Core CPI YoY (Jun): Est. 2.9% | Prior 2.9%
☀️ 8:30 AM — CPI Index, NSA (Jun): Prior 335.12
☀️ 8:30 AM — CPI NSA MoM (Jun): Prior +0.63%
☀️ 8:30 AM — Core CPI Index (Jun): Prior 336.12
☀️ 8:30 AM — CPI Index, SA (Jun): Prior 333.98
☀️ 8:30 AM — Real Earnings MoM (Jun): Prior -0.2%
☀️ 8:55 AM — Redbook YoY: Prior +11.5%
🕓 11:00 AM — Cleveland CPI MoM (Jun): Prior +0.3%
🕓 12:40 PM — Fed Vice Chair for Supervision Barr Speaks
🕓 1:00 PM — Fed Goolsbee Speaks
🕓 1:30 PM — Fed Governor Cook Speaks
🕓 2:55 PM — FOMC Member Bowman Speaks
🌙 4:00 PM — TIC Net Long-Term Transactions (May): Est. $128.5B | Prior $103.1B
🌙 4:00 PM — TIC Net Long-Term Transactions Including Swaps (May): Prior $103.10B
🌙 4:00 PM — U.S. Foreign Buying of Treasury Bonds (May): Prior $50.50B
🌙 4:00 PM — Overall Net Capital Flow (May): Prior $26.10B
🌙 4:30 PM — API Weekly Crude Oil Stocks: Prior -0.399M
☀️ 7:00 AM — MBA 30-Year Mortgage Rate: Prior 6.58%
☀️ 7:00 AM — MBA Mortgage Applications WoW: Prior -2.2%
☀️ 7:00 AM — MBA Purchase Index: Prior 169.5
☀️ 7:00 AM — Mortgage Refinance Index: Prior 794.4
☀️ 7:00 AM — Mortgage Market Index: Prior 266.3
☀️ 8:30 AM — PPI MoM (Jun): Est. 0.0% | Prior +1.1%
☀️ 8:30 AM — Core PPI MoM (Jun): Est. +0.3% | Prior +0.4%
☀️ 8:30 AM — Empire State Manufacturing Index (Jul): Est. 8.7 | Prior 5.7
☀️ 8:30 AM — Core PPI YoY (Jun): Prior 4.9%
☀️ 8:30 AM — PPI YoY (Jun): Prior 6.5%
☀️ 8:30 AM — PPI Ex-Food, Energy and Transportation MoM (Jun): Prior +0.8%
☀️ 8:30 AM — PPI Ex-Food, Energy and Transportation YoY (Jun): Prior 5.1%
☀️ 8:45 AM — FOMC Member Williams Speaks
🕓 10:30 AM — Crude Oil Inventories: Prior +2.998M
🕓 10:30 AM — Cushing Crude Oil Inventories: Prior -0.052M
🕓 10:30 AM — EIA Refinery Crude Runs WoW: Prior -0.172M
🕓 10:30 AM — EIA Weekly Refinery Utilization WoW: Prior -0.8%
🕓 10:30 AM — Distillate Fuel Production: Prior -0.001M
🕓 10:30 AM — Gasoline Inventories: Prior -1.904M
🕓 10:30 AM — Gasoline Production: Prior -0.233M
🕓 10:30 AM — Heating Oil Stockpiles: Prior -0.427M
🕓 10:30 AM — EIA Weekly Distillate Stocks: Prior -4.980M
🕓 10:30 AM — Crude Oil Imports: Prior +1.096M
🕓 1:00 PM — Fed Governor Cook Speaks
🕓 2:00 PM — Fed Beige Book
☀️ 8:30 AM — Retail Sales MoM (Jun): Est. +0.3% | Prior +0.9%
☀️ 8:30 AM — Core Retail Sales MoM (Jun): Est. -0.1% | Prior +0.8%
☀️ 8:30 AM — Philadelphia Fed Manufacturing Index (Jul): Est. 12.1 | Prior 10.3
☀️ 8:30 AM — Initial Jobless Claims: Est. 215K | Prior 215K
☀️ 8:30 AM — Philadelphia Fed Employment (Jul): Prior 7.9
☀️ 8:30 AM — Retail Control MoM (Jun): Prior +0.7%
☀️ 8:30 AM — Continuing Jobless Claims: Prior 1.814M
☀️ 8:30 AM — Philadelphia Fed Business Conditions (Jul): Prior 50.2
☀️ 8:30 AM — Retail Sales Ex-Gas and Autos MoM (Jun): Prior +0.5%
☀️ 8:30 AM — Philadelphia Fed New Orders (Jul): Prior 27.3
☀️ 8:30 AM — Philadelphia Fed Prices Paid (Jul): Prior 53.2
☀️ 8:30 AM — Philadelphia Fed CAPEX Index (Jul): Prior 41.2
☀️ 8:30 AM — Retail Sales YoY (Jun): Prior +6.88%
☀️ 8:30 AM — Jobless Claims Four-Week Average: Prior 218.75K
🕓 10:00 AM — Pending Home Sales MoM (Jun): Est. -0.3% | Prior +3.8%
🕓 10:00 AM — Retail Inventories Ex-Auto MoM (May): Est. +0.4% | Prior +0.4%
🕓 10:00 AM — Business Inventories MoM (May): Est. +0.3% | Prior +0.5%
🕓 10:00 AM — Pending Home Sales Index (Jun): Prior 76.8
🕓 10:00 AM — NAHB Housing Market Index (Jul): Est. 35 | Prior 35
🕓 10:30 AM — Natural Gas Storage: Prior +61B
🕓 11:30 AM — Atlanta Fed GDPNow Q2: Est. 1.3% | Prior 1.3%
🕓 11:30 AM — 4-Week Bill Auction: Prior 3.630%
🕓 11:30 AM — 8-Week Bill Auction: Prior 3.635%
🕓 12:30 PM — Fed Logan Speaks
🕓 1:25 PM — Fed Schmid Speaks
🌙 7:00 PM — Fed Governor Jefferson Speaks
☀️ 8:30 AM — Export Price Index MoM (Jun): Prior +1.3%
☀️ 8:30 AM — Import Price Index MoM (Jun): Est. -0.4% | Prior +1.9%
☀️ 8:30 AM — Housing Starts (Jun): Est. 1.320M | Prior 1.177M
☀️ 8:30 AM — Building Permits (Jun): Est. 1.400M | Prior 1.410M
☀️ 8:30 AM — Housing Starts MoM (Jun): Prior -15.4%
☀️ 8:30 AM — Building Permits MoM (Jun): Prior -0.9%
☀️ 8:30 AM — Export Price Index YoY (Jun): Prior +11.2%
☀️ 8:30 AM — Import Price Index YoY (Jun): Prior +6.7%
☀️ 9:15 AM — Industrial Production YoY (Jun): Prior +1.67%
☀️ 9:15 AM — Industrial Production MoM (Jun): Est. +0.2% | Prior +0.1%
☀️ 9:15 AM — Manufacturing Production MoM (Jun): Prior 0.0%
☀️ 9:15 AM — Capacity Utilization Rate (Jun): Est. 76.2% | Prior 76.2%
🕓 10:00 AM — Michigan Consumer Sentiment (Jul): Est. 51.4 | Prior 49.5
🕓 10:00 AM — Michigan One-Year Inflation Expectations (Jul): Prior 4.6%
🕓 10:00 AM — Michigan Five-Year Inflation Expectations (Jul): Prior 3.3%
🕓 10:00 AM — Michigan Consumer Expectations (Jul): Prior 50.7
🕓 10:00 AM — Michigan Current Conditions (Jul): Prior 47.7
🕓 10:45 AM — Atlanta Fed GDPNow Q2
🕓 1:00 PM — Baker Hughes U.S. Oil Rig Count
🕓 1:00 PM — Baker Hughes U.S. Total Rig Count
🕓 3:30 PM — CFTC S&P 500 Speculative Net Positions: Prior -42.9K
🕓 3:30 PM — CFTC Nasdaq 100 Speculative Net Positions: Prior +2.1K
🕓 3:30 PM — CFTC Gold Speculative Net Positions: Prior +194.2K
🕓 3:30 PM — CFTC Crude Oil Speculative Net Positions: Prior +75.7K
🕓 3:30 PM — CFTC Aluminum Speculative Net Positions: Prior +1.3K
🕓 3:30 PM — CFTC Copper Speculative Net Positions: Prior +64.3K
🕓 3:30 PM — CFTC Silver Speculative Net Positions: Prior +28.0K
🕓 3:30 PM — CFTC Natural Gas Speculative Net Positions: Prior -165.3K
🕓 3:30 PM — CFTC Wheat Speculative Net Positions: Prior -49.7K
🕓 3:30 PM — CFTC Corn Speculative Net Positions: Prior +101.0K
🕓 3:30 PM — CFTC Soybean Speculative Net Positions: Prior +112.8K
Markets enter the week with the major equity trends still intact, but the setup has become more complicated following the weekend escalation in the Middle East. The S&P 500 closed at 7,575.39, up 1.23% for the week and just below resistance near 7,600, while QQQ reclaimed the $725 area and the Dow remained above its rising 21-day EMA. Small caps were less convincing, and market leadership remained concentrated in energy, technology and communication services rather than broadening meaningfully across the rest of the market. Treasury yields rose across the curve, led by longer maturities, while the Dollar Index rebounded toward 101 and WTI gained nearly 4% to settle at $71.41. Iran’s declaration that the Strait of Hormuz is closed—and Washington’s insistence that it remains open—raises the risk of renewed volatility in crude, inflation expectations and long-term yields. The equity trend remains constructive, but the tone is more cautious as leadership remains narrow, sector rotation continues beneath the surface and several major indexes approach important resistance levels.
The week’s domestic focus is dominated by inflation, consumer demand and the durability of the labor market. Tuesday’s June CPI report is the first major test, with headline inflation expected to decline 0.1% month over month, core CPI forecast to rise 0.3%, and the annual core rate expected to remain at 2.9%. Wednesday follows with PPI, the Empire State manufacturing survey and the Fed’s Beige Book. Thursday delivers the broadest growth read through retail sales, jobless claims, the Philadelphia Fed survey and housing indicators, with headline retail sales expected to slow to 0.3% from 0.9% and core sales projected to decline 0.1%. Friday closes with housing starts, industrial production and the University of Michigan sentiment survey, including closely watched one- and five-year inflation expectations. Last week’s data showed services activity still expanding and claims remaining contained, but housing weakened, hiring indicators moderated and the Treasury curve bear-steepened. The immediate question is whether this week’s inflation and consumer data reinforce the higher-for-longer repricing or provide enough relief to the long end for the equity advance to broaden.
That’s all for this week’s report.
Eric
No posts
Comments
Nothing yet. Say the first thing.
Sign in to join the conversation.