
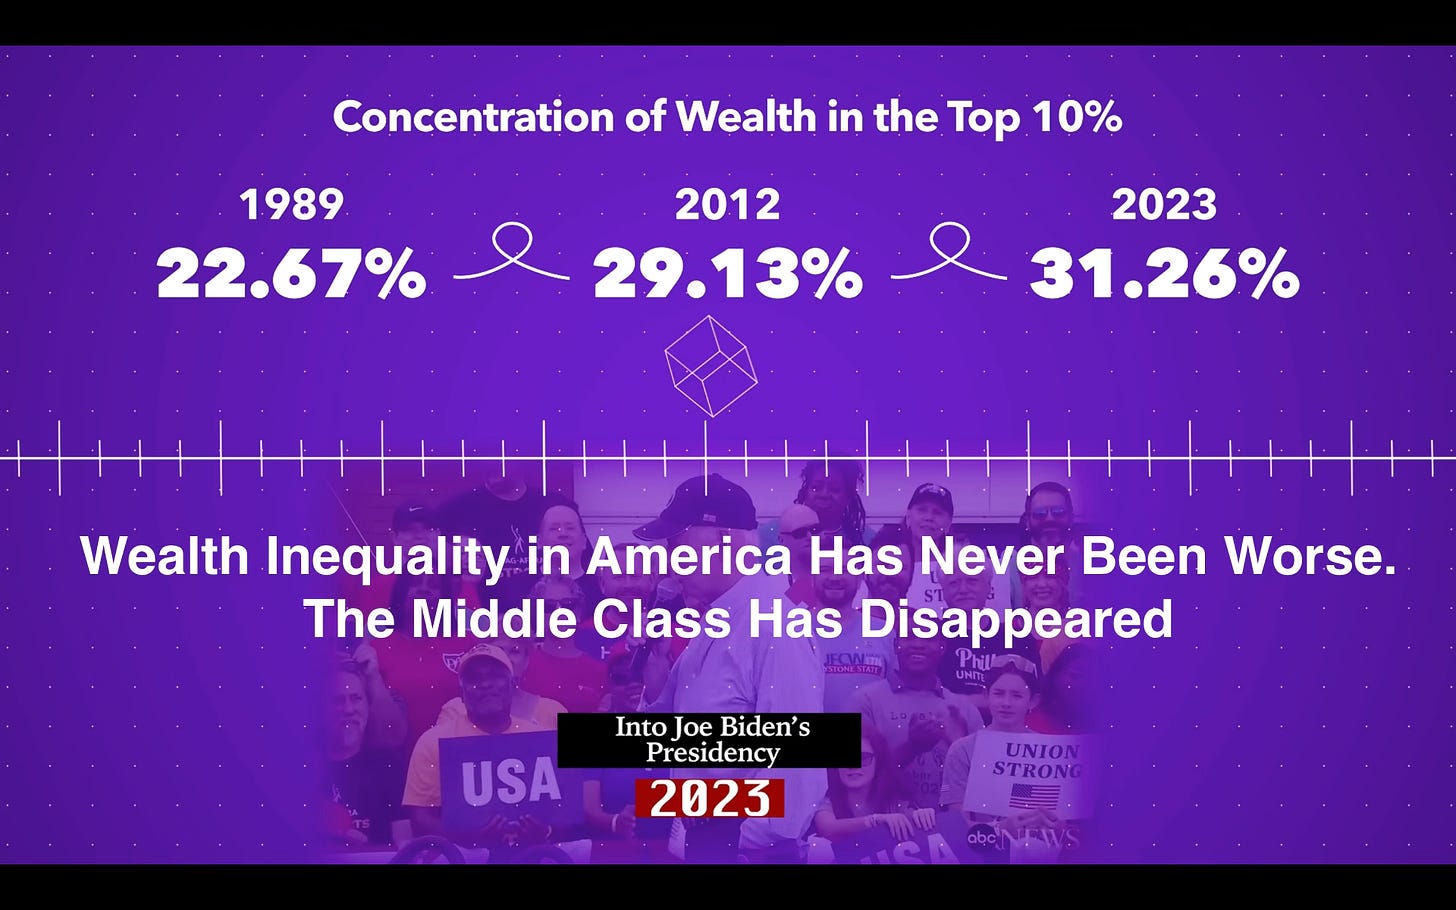
It is extremely difficult to visualize the scale of wealth inequality in the US. Here is a 2023 video by Humphrey Yang, Wealth Inequality in America Has Never Been Worse. The Middle Class Has Disappeared that takes a swing at it. At 13 minutes it is a bit long, but, the last six minutes provides some very interesting attempts to illustrate the scale of wealth inequality, measuring it in chocolate bars, Oreo cookies, and giant boxes of US currency.
One additional note is that the video says that there were 735 billionaires in the US in 2023 according to Forbes annual list. Wealth accumulation at the very top has continued to accelerate. Here is an update to those numbers:
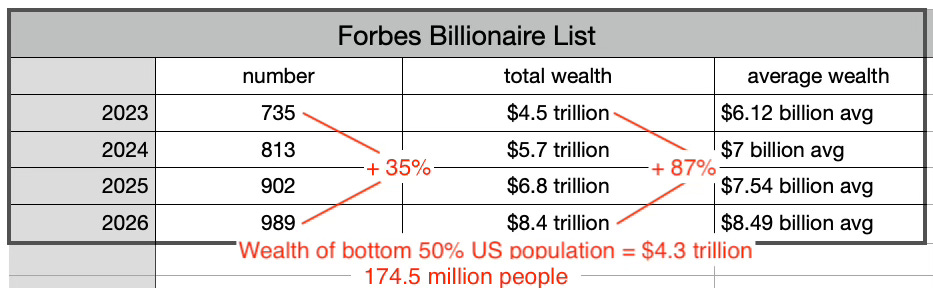
Our national production of billionaires has been accelerating and their share of total national wealth has accelerated even faster!
What’s missing from this picture is the HOW. How did we come to have an economy more successful at producing billionaires than producing housing, healthcare, food and all of the other daily necessities for Americans not in the top 1%?
This is not a natural feature of a self-adjusting free market capitalism. No, the rich and corporations know that that is a fantasy of politicians in the Republican and Democratic parties, the Libertarians, Wall St., and university economists. This is demonstrated by the vast sums of money the rich and corporations pour into our political system to rig the economy in their favor.
Just one example.
There are 435 members of Congress and 100 Senators. In 2021, there were 12,136 registered lobbyists in Washington, supported by over $3.73 billion spent to influence legislation and regulations. This amounts to $6,972,000 per legislator and involves 23 lobbyists for each member. The numbers today, five years later are no different.
You can get the full story behind this political war and the structural changes it has produced: monopolization, globalization, decline of unions, growth of the banking sector and financialization of the real economy. This last element is summed up by the fact that in the 1950s and ‘60s, the ratio of CEO pay to average worker pay was 21 to 1. Today it is over 350 to 1.
Comments
Nothing yet. Say the first thing.
Sign in to join the conversation.