
Part 2 of an ongoing series where I work through the MITRE ATT&CK Evaluations APT29 dataset in Splunk and document everything I find, including the dead ends.
#Note:
Before I get into the findings, a quick context on why I am doing this.
I am learning advanced threat hunting by working through real adversary simulation data rather than reading about it. The dataset is the MITRE ATT&CK Evaluations APT29 simulation from the Open Threat Research Foundation. I document everything including the dead ends, not just the clean findings.
If I missed something or got something wrong, tell me in the comments. I would rather be corrected than have a wrong interpretation sitting in a published post.
One thing I will say. There is a tendency among experienced practitioners to assume certain investigative paths are not worth taking. Maybe that is sometimes true. But I think there is value in a learner going through data without assumptions and documenting exactly what they find. That is what this series is.
If you didn’t read part 1, go check it out:
Let me tell you something about threat hunting that nobody told me when I started.
You will spend most of your time looking at things that seem completely normal. And just when you are about to move on, something in the corner of a result set will make you pause. Not because it is obviously malicious. Because something about it feels slightly off.
That feeling is worth following.
This entire post came from one .tmp file that looked worthless.
The log I almost ignored
I was going through EventID 2, file creation time changed. 209 events. Most of it was background system activity and I was ready to close the search and move on.
One entry had PowerShell as the Image and a randomised uppercase filename in the Windows Jump List folder as the TargetFilename. The creation timestamp had been modified by about 15 minutes.
On its own it meant nothing. We already knew the system was compromised. One timestomped temp file was not going to tell me anything new.
But I searched the ProcessGuid anyway.
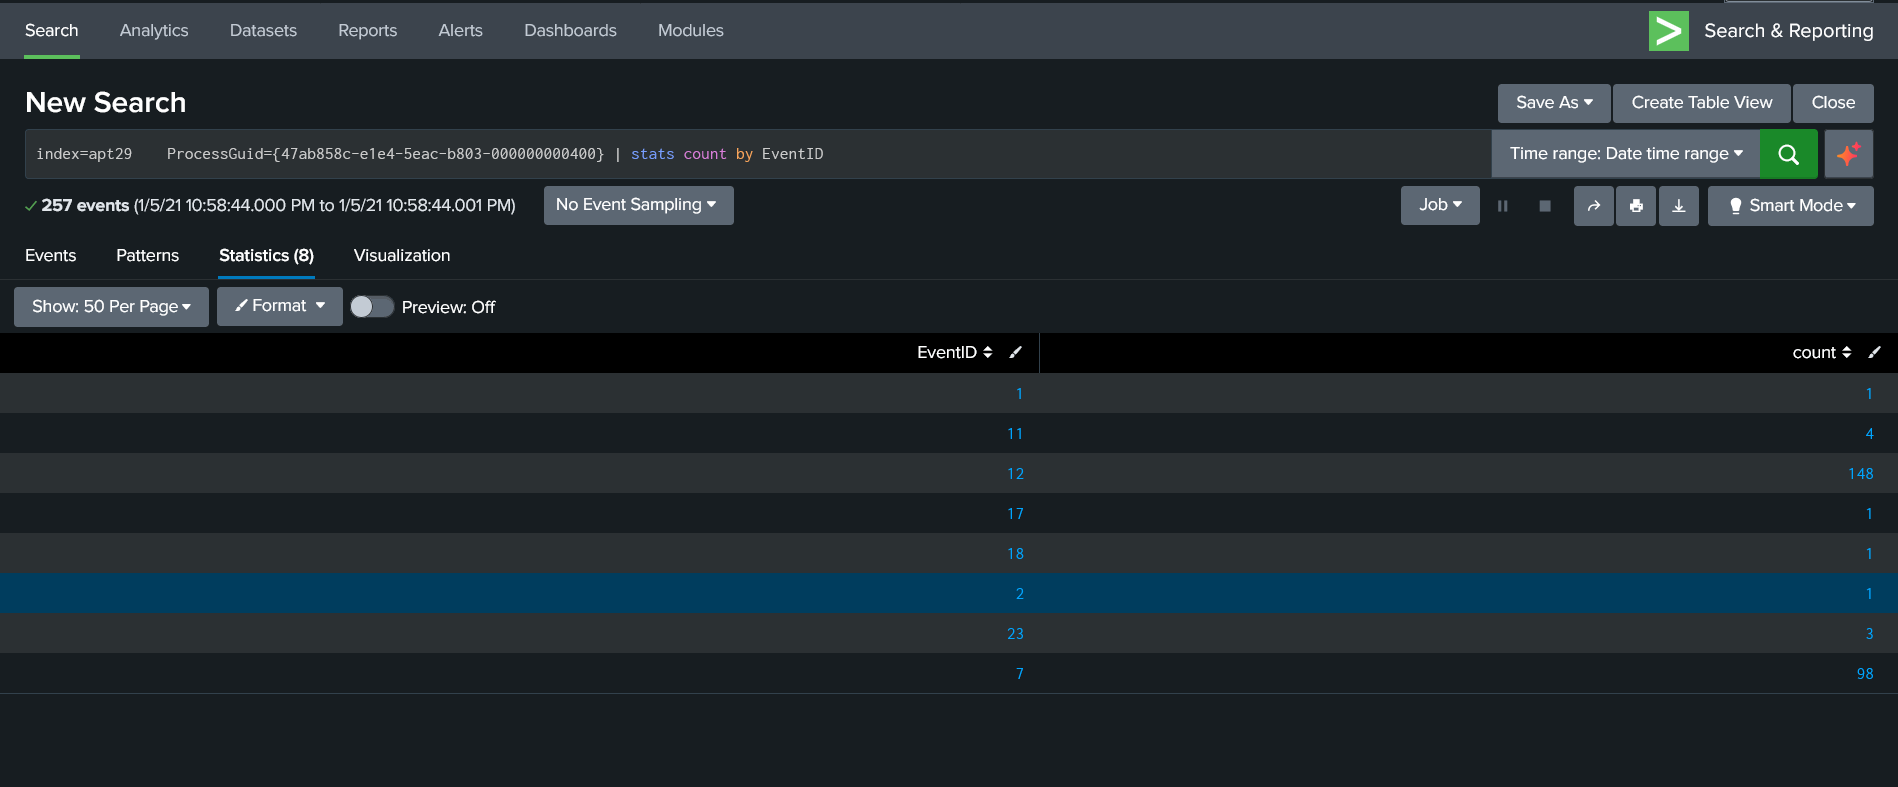
257 events. 8 EventIDs. All within one millisecond.
98 DLL loads. 148 registry operations. Named pipes created and immediately connected. Files created and deleted in the same burst. The implant was running its entire setup routine in a single automated burst and the only trace in EventID 2 was one temp file with a modified timestamp.
That is why you check the ProcessGuid before you decide something is noise.
EventID 7 and the unsigned Python extension
I filtered EventID 7 for unsigned images:
index=apt29 EventID=7 Signed=false
| table _time, FileVersion, Image, ImageLoaded
After going through the results I found a .pyd file loading from C:\Users\pbeesly\AppData\Local\Temp\. Unsigned. No file version information. A .pyd file is a compiled Python extension, essentially a DLL for Python. Legitimate ones are signed and do not live in Temp folders.

I tracked the ProcessID, which was 2172.
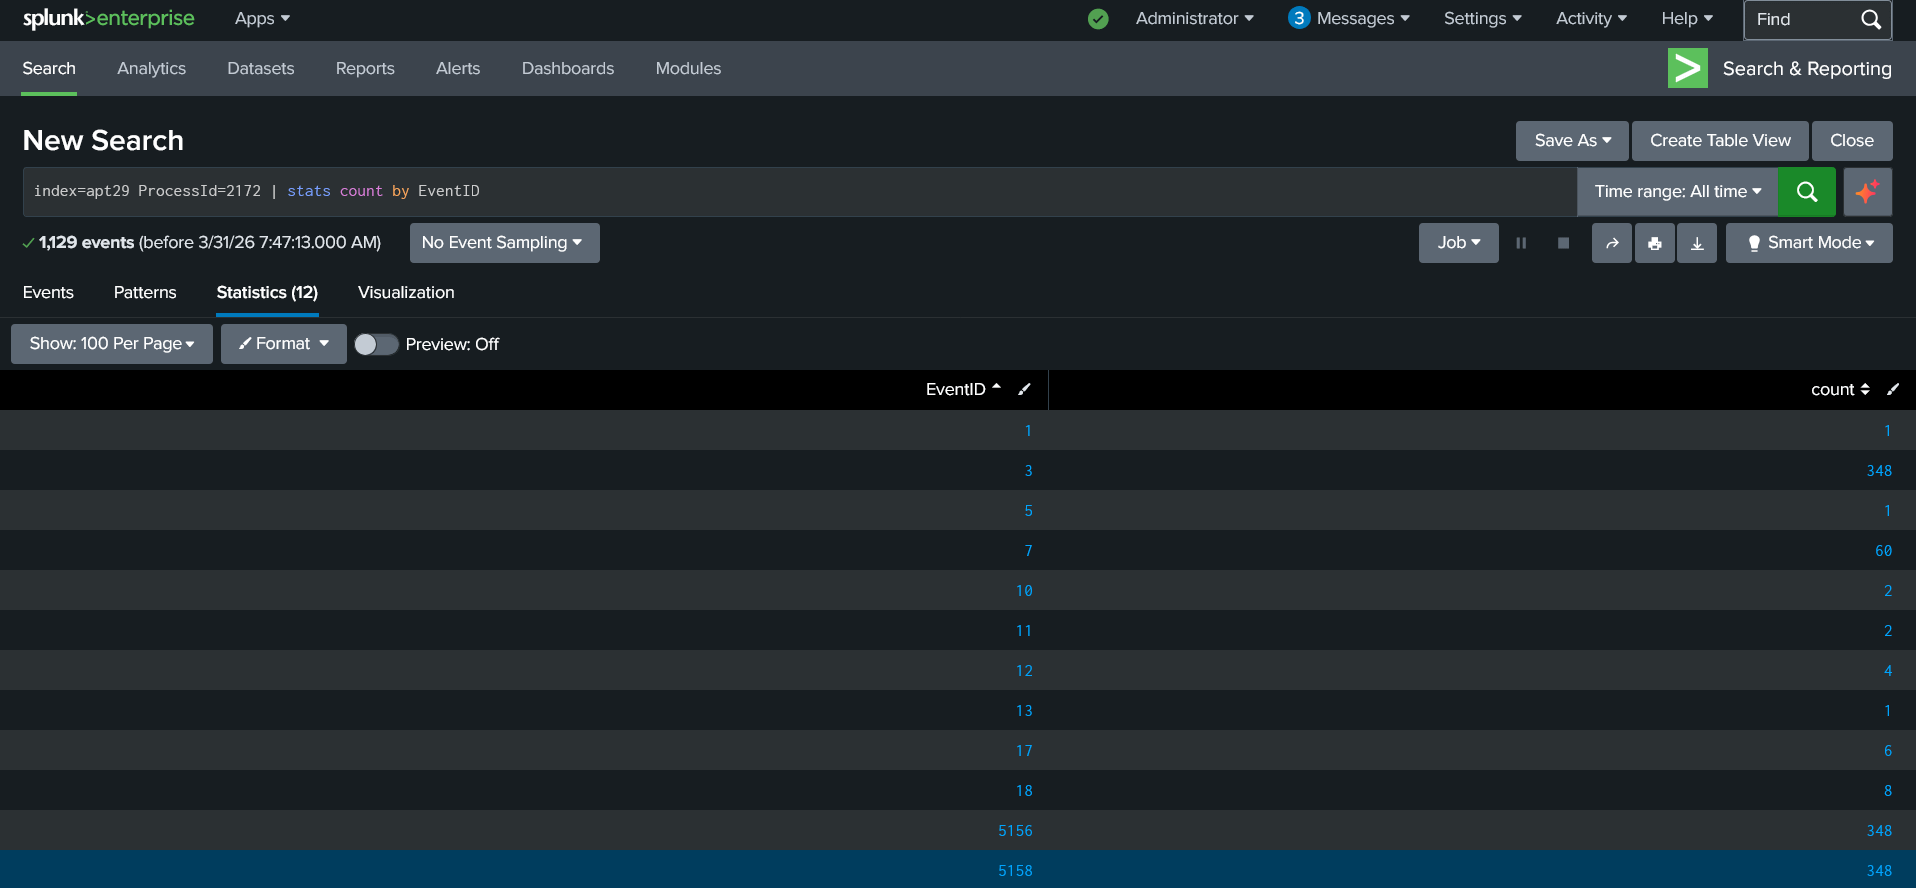
1,129 events. 12 EventIDs.
In just 2 seconds this process loaded 60 images.
It accessed cmd.exe and powershell.exe.
It created two files: rar.exe and sdelete.exe.
It created 6 named pipes with names designed to look like Windows services.
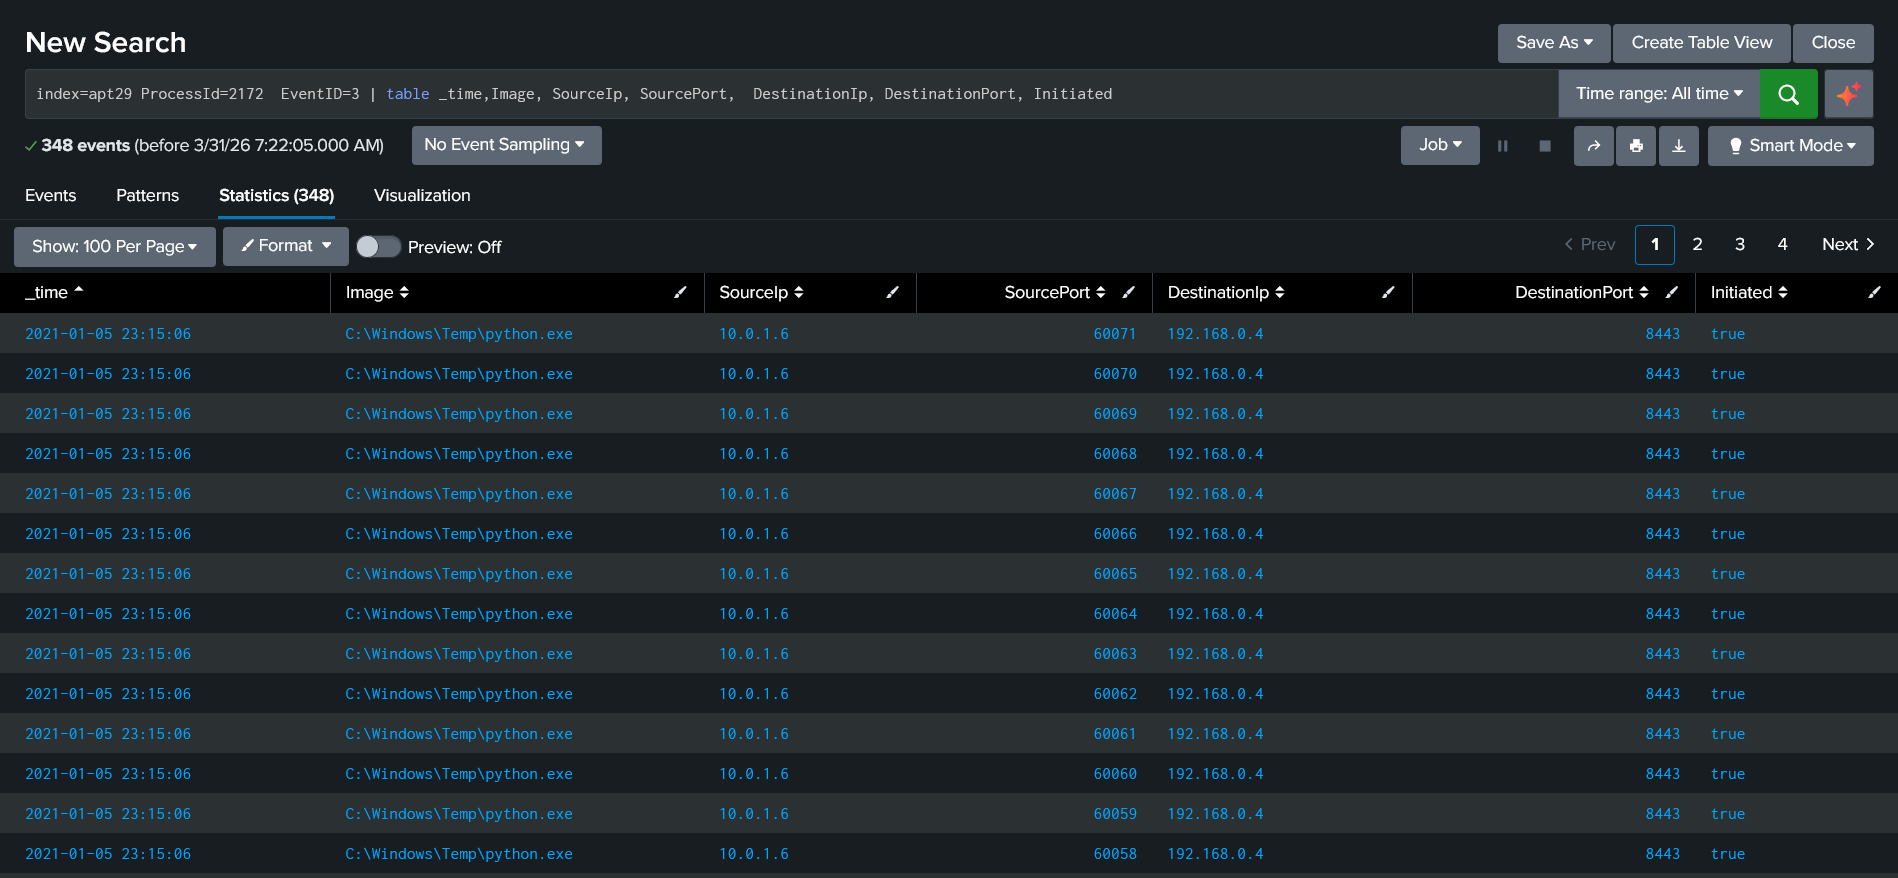
And it made 348 outbound network connections in 3 seconds, all to the same destination except for the source port.
RAR to compress collected files. SDelete to destroy evidence after exfiltration. Those two tools appearing together tell you exactly what stage of the attack you are looking at.
EventID 10 and what GrantedAccess actually tells you
Most tutorials tell you to look at EventID 10 for credential dumping. What they do not tell you is that filtering correctly is what makes the difference between 326 events and 2.
Start here:
index=apt29 EventID=10 GrantedAccess!=0x1000 AND GrantedAccess!=0x1400
| table _time, SourceImage, TargetImage, GrantedAccess
0x1000 and 0x1400 are routine low-privilege Windows activity. Filtering it out removes the noise immediately. What remains are the access attempts with elevated permissions that have no legitimate explanation.
At 23:05:16 PowerShell requested 0x1fffff on lsass.exe.
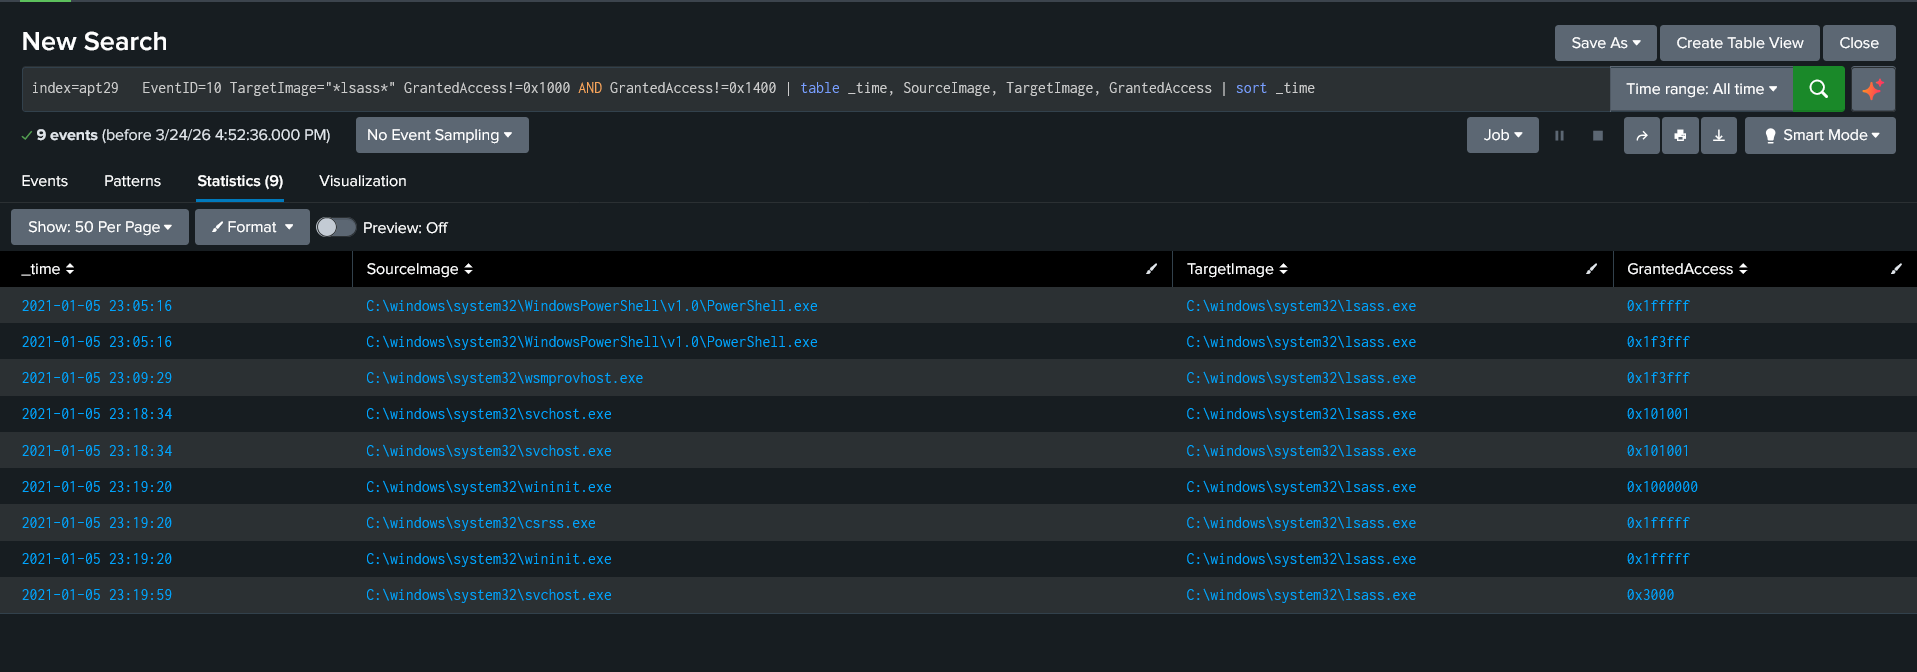
0x1fffff is full process access. Every permission combined into one value. PowerShell reading LSASS memory at that permission level means one thing. Credentials were being harvested directly from memory without dropping a single tool that endpoint security would flag.
The CallTrace looked normal. Legitimate Windows DLLs all the way through. That is intentional. APT29 routes through legitimate system libraries so the call stack does not stand out in automated analysis.
The credential access happened at 23:05:16. PsExec appeared in the network logs at 23:18:00 connecting to a second internal machine. Twelve minutes between stealing credentials and using them.
EventID 3 and the moment I had to stop assuming
When I first opened the EventID 3 results I was looking for the obvious thing. Which IP is the attacker and which IP is the victim. I was going to call the external ones malicious and the internal ones clean.
That thinking was wrong and I caught it before it cost me the finding.
In a real compromised environment you cannot just look at an IP and decide it is malicious based on whether it is internal or external. You need destination port, source port, and context together. An internal IP on an unusual port with a suspicious process is more interesting than an external IP on port 443 from a browser.
What told me something was wrong was not the IP. The same victim account appearing with two different source IPs, 10.0.1.4 and 10.0.1.6. Same user. Different machines. That is lateral movement visible in the network logs without needing to look at a single process creation event.
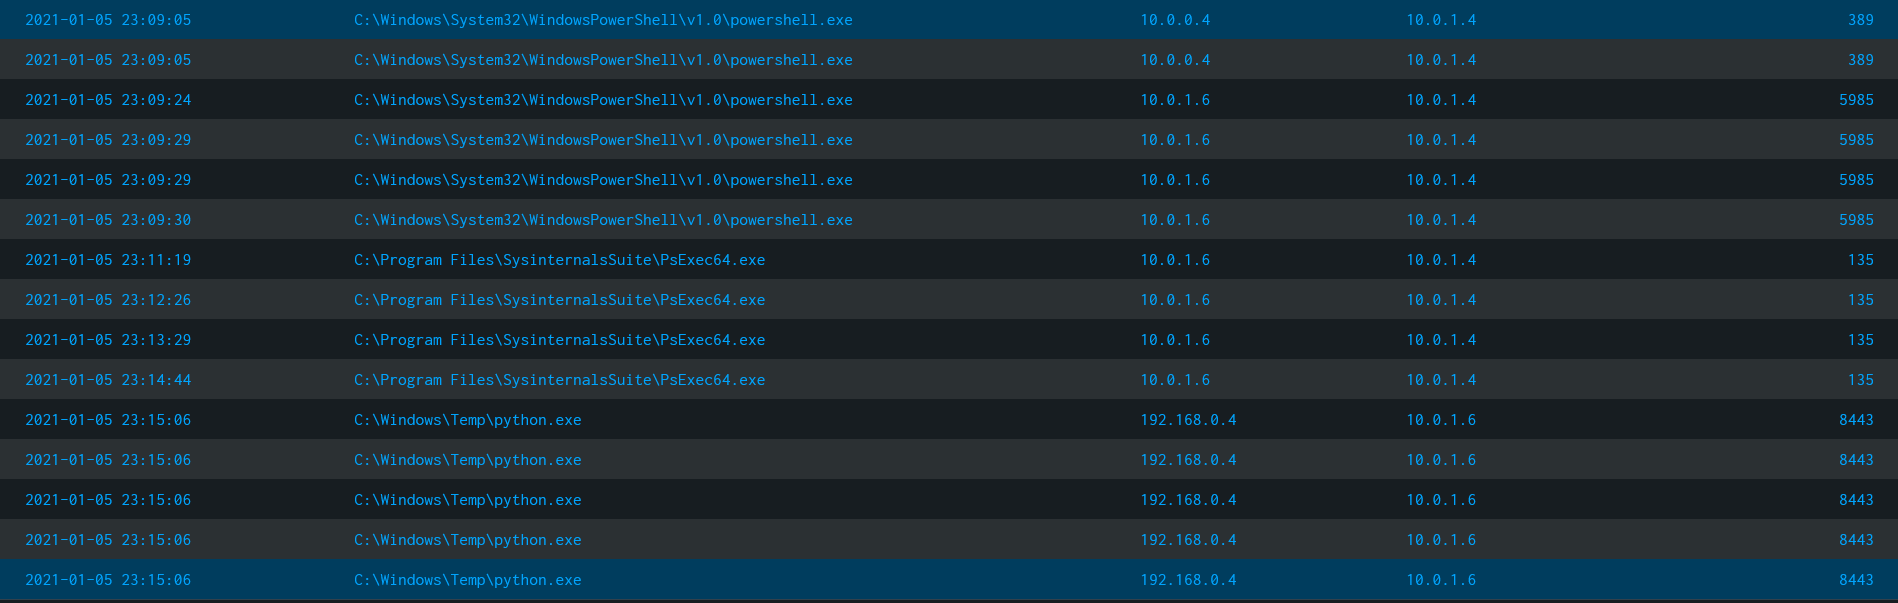
348 connections from C:\Windows\Temp\python.exe to an internal machine on port 8443. Every single field identical except the source port. That pattern is an automated tool cycling through connections, not a person doing anything. Port 8443 is an alternate HTTPS port chosen specifically because internal HTTPS traffic is rarely inspected.
The C2 traffic looked like Windows Update. The lateral movement used credentials that looked legitimate. The Python implant ran as a process that looked like a developer tool. Every choice was made to blend in.
What this investigation is actually teaching me
I expected most of the logs to be noise with one or two real findings buried inside. That is what the guides say threat hunting looks like.
That is not what I found. Close to half the logs across multiple EventIDs were showing genuine malicious activity. The attack was not hiding in the noise. It was generating the noise.
And the most important thing I found was not in any single event. It was in the chain between events. One .tmp file with a modified timestamp led to 257 correlated events. One unsigned .pyd file led to 1,129 events across 12 EventIDs including credential access, collection tools, and 348 C2 connections.
The log you are about to skip is sometimes the one that connects everything.
What is still open
The lateral movement to 10.0.1.6 is confirmed in the network logs. What happened on that second machine is not investigated yet. What did APT29 access once PsExec got them there. What did they collect. Where did it go.
Part 3 covers the second machine and whatever the logs on that side show.
Part 4 will be the Sigma detection rules for every confirmed technique across the full series, published on Substack first.
Open To Opportunities
I am currently open to SOC analyst and detection engineering roles, remote or India based. If you are building a detection team or looking for someone who enjoys working through real adversary data rather than just running playbooks, my resume and published work are linked on my profile. Feel free to reach out directly on LinkedIn.
LinkedIn: www.linkedin.com/in/manishrawat-soc
All findings are from the publicly available MITRE ATT&CK Evaluations APT29 dataset at github.com/OTRF/Security-Datasets. Tools used: Splunk Free tier.
If you are working through the same dataset or building detections for APT29 techniques drop a comment. Happy to compare notes.
No posts
Comments
Nothing yet. Say the first thing.
Sign in to join the conversation.