


Dear Investors,
It’s early and I’ve had these 10 charts open on my desk for the last 48 hours, scrolling back to the top again and again, landing every time on the same small, nagging thought.
The kind you can’t quite say out loud yet - because saying it makes it real.
On the surface, this is a victory lap. Money is pouring into America. The Fed has found its spine again. The dollar is beating every rival currency on earth into the pavement. And global equities just printed the single largest number in the recorded history of markets.
If you stopped reading right here - if you only ever saw the first half of what I’m about to send you - you’d close the tab certain that US exceptionalism isn’t just alive, it’s accelerating. And you’d size your book to match. Plenty of very smart people are doing exactly that this morning.
But I can’t stop staring at the seam.
Because the first 5 charts and the last 5 charts are not telling the same story. They’re barely on speaking terms. The first 5 are loud, confident, everywhere: what your brother-in-law repeated at dinner, what the anchors are cheering, what the flows are chasing. The last 5 are quiet. They don’t trend on anyone’s timeline. And they’re the ones keeping me up.
I’ve seen this exact alignment maybe a handful of times in 20 years, and every single time the surface stayed euphoric right up until the instant it stopped.
So I’m going to write this one deliberately. The first 5 charts, below, are the public story. I’ll walk you through each, and against every one I’ll leave a thread dangling on purpose - a question I promise to answer.
Then, the moment we cross the fifth chart, the letter turns. That’s where the PRO section opens, and that’s where I pull every thread tight - where the numbers stop being a scoreboard and start being a map.
If you remember one line from today, remember this one: the value was never in the noise up top. It’s in what the noise is working so hard to hide.
Let’s start with the flood.
The chart the bulls are waving around this week shows cumulative global fund flows into US equities running near +2.5% of assets under management so far this year.
It sounds mild until you notice where it’s sitting - right up against the 90th-percentile band of everything we’ve measured since 2002, while the average path for this point on the calendar barely lifts off zero.
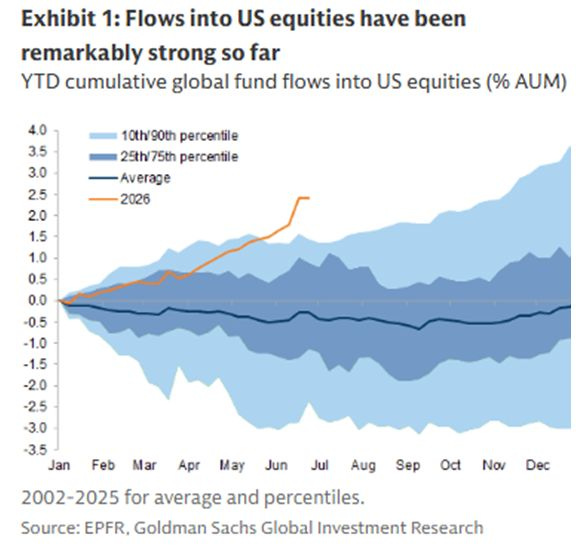
Foreign capital isn’t wading into America. It’s sprinting. Elbows out, shoes untied.
And the caption practically writes itself - the end of US exceptionalism? really? - and on this chart alone, I genuinely can’t argue back. The money is voting with both feet and half its heart.
But I’ve been burned enough times to treat flows this stretched as a fuel gauge, never a compass. They tell me how full the tank is. They never once told me which way the road bends.
I still remember January 2018 in my body: the largest equity inflows on record, everyone giddy - and then, 9 trading days later, a 10% crater in the S&P as the VIX went from a sleepy 12 to a screaming 37 in a single afternoon.
That whole euphoric year closed down 4.4%, the first loser since the crisis. Late 2021 rhymed note for note - same crowded joy, weeks before 2022 quietly removed 18% from the top.
At these extremes, inflows and forward returns run inversely. When everyone who was going to buy has already bought, the last dollar through the door is the one left holding it.
So tuck a question in your pocket as we walk: if the tank is this full, what exactly is it fuel for?
I’ll answer it - but not until after the fifth chart, because the answer lives downstream, where the water gets deep.
The Fed’s own tone - read speech by speech, line by line, through a language model - has swung decisively hawkish, and it did so at the precise moment 1-year inflation swaps rolled over.
Watch the two lines cross on the page: the committee is leaning harder into the inflation fight just as the market’s own inflation expectations fall out of the sky.
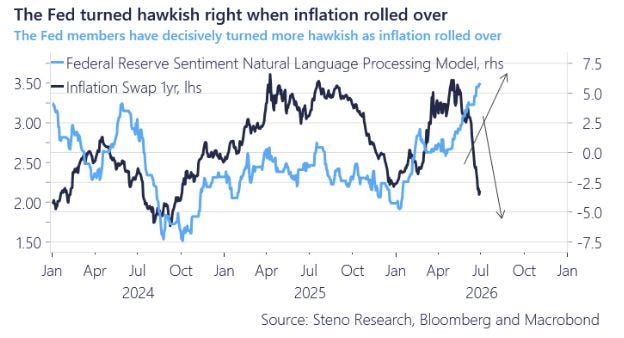
Read it fast and it’s simply the engine behind the strong dollar. Read it slowly and it’s stranger than that. Almost unsettling.
Central banks are supposed to tighten into rising inflation. This one is tightening its rhetoric into falling inflation - fighting the last war at full volume while the enemy is already retreating over the hill.
And that matters more than it looks, because the front of the yield curve and the multiple the market can carry move in opposite directions, almost like gears.
I watched those gears grind in the fourth quarter of 2018, when the 2-year yield climbed from roughly 1.9% to 2.9% on hawkish repricing and the S&P bled 19.8% into Christmas Eve while everyone pretended it was fine.
I watched the director’s-cut version in 2022, when the 2-year tore from about 0.7% to 4.4%, the 10-year from 1.5% to 3.9% - some 525 basis points of tightening - and the reward was a 19.4% hole in the S&P and a 33% collapse in the Nasdaq.
So the second thread I leave hanging is a quiet one: a Fed that turns hawkish as the economy cools isn’t flexing strength - it’s winding up a reversal.
And when that reversal snaps back, one asset benefits more than anything else on the board. I’ll say its name in the PRO section, not before.
For now, just hold the word reversal somewhere you won’t lose it.
The jobs report is where the victory lap develops a limp it’s trying not to show.
June payrolls came in at just 57,000, against expectations of 115,000, and down sharply from May’s revised 129,000 - the weakest signal the labor market has sent in months.
On paper, unemployment even improved, to 4.2%. But the headline is wearing stage makeup under hot lights.
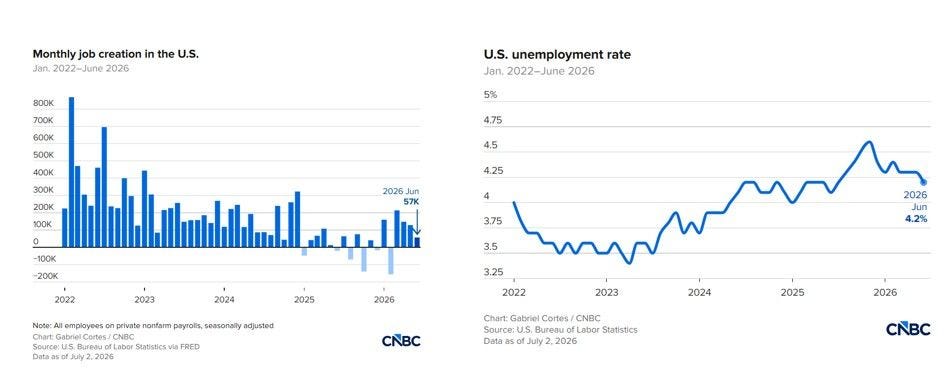
Participation slipped to 61.5%, the lowest since March 2021. And the household survey lost 507,000 jobs in a single month. The rate looked prettier mostly because half a million people quietly stopped being counted at all.
Underneath, it’s a split screen you have to squint at. Professional and business services added 36,000, social assistance 25,000, healthcare 22,000, government 8,000 - the defensive, boring, non-cyclical corners holding the wall.
But leisure and hospitality lost 61,000 jobs. And that one genuinely stings, because the whole street had penciled in a World Cup hiring bump that simply never walked through the door.
Wages, meanwhile, stayed stubborn as ever: up 0.3% on the month, 3.5% on the year.
Which leaves the Fed boxed into the one corner it hates most - an economy cooling in its hands while wages refuse to sit down.
I’ve seen this silhouette before, and it never ages well. Through 2007, payroll momentum rolled over quietly for months before the 2008 break took 37% out of the market and a decade of confidence with it.
Hiring momentum leads the unemployment rate, and it shadows credit spreads more faithfully than almost anything I track - and spreads, not payrolls, are what equities actually trade on when the music slows.
Third thread, then, laid gently across the first two: if the labor market is cracking while the Fed is still talking tough, something has to give.
What gives - and what it does to your book - is a PRO-section conversation. I’m not being coy with you. I’m being sequential, because the order is the argument.
This is the chart that finishes the exceptionalism case with a flourish, and I understand its gravity.
This month the dollar didn’t merely lead the G10 - it outpaced every single currency in it. Top to bottom. No survivors.
The yen held up best and still fell 1.47%. From there it just cascades: the British pound 1.87%, the euro 2.38%, the Danish krone 2.42%, the Canadian dollar 2.80%, the Swiss franc 3.41%, the Australian dollar 4.01%, the Swedish krona 4.94%, the New Zealand dollar 5.68%, and the Norwegian krone taking the full swing on the chin at 6.37% - all inside one month.
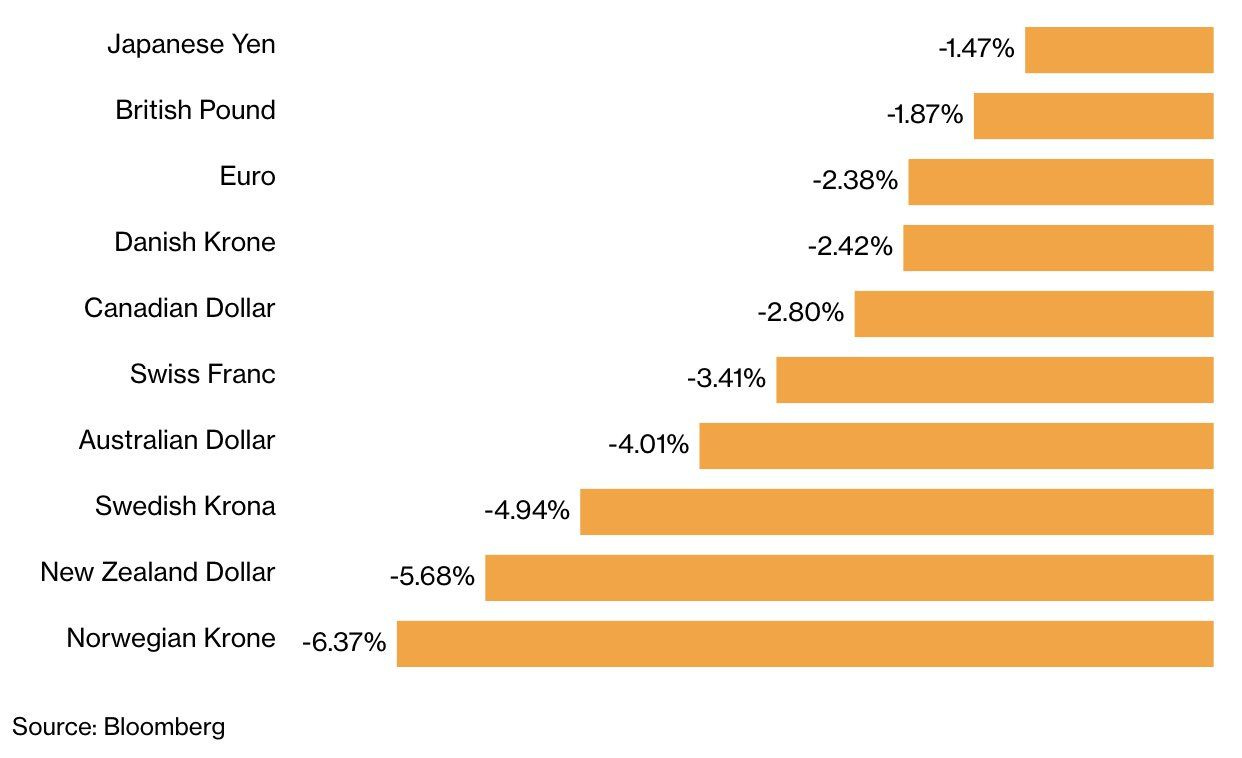
A near-clean sweep like this is almost never gentle, because the dollar trades inversely against nearly everything priced in it.
I keep the 2022 tape within arm’s reach for precisely this reason: the dollar index rose about 8% on the year and peaked 19% higher by September, dollar-yen tore up to roughly 152, euro-dollar cracked parity for the first time in two decades - and that same wave flattened S&P earnings and dragged emerging-market equities down around 20%.
This isn’t folklore I’m reciting. The dollar index and forward S&P earnings run inversely, a rolling correlation somewhere near minus 0.5 to 0.7.
My rule of thumb, scribbled in a dozen notebooks by now: every sustained 10% climb in the dollar quietly carves an estimated 2% to 4% off S&P earnings - and it takes it straight out of the very multinationals everyone keeps calling “exceptional.”
So here’s the fourth thread, and this is the one that starts to itch under the collar. The strong dollar is being sold to you as the proof of American dominance.
But what if it’s the cost of it? What if the same breakout that gleams like a trophy is the exact thing that eventually cracks something load-bearing?
I’ll show you what it cracks - and what it means for the one asset I’ve been quietly accumulating in the dark - once we’re through the paywall.
And now we reach the fifth chart, which is where the whole picture quietly turns over in your hands - and, not by accident, where the free part of this letter ends.
The Federal Reserve now owns just 14.17% of all outstanding US Treasuries. That’s one of the smallest shares in over a decade, down from nearly 25% at the 2021 peak.
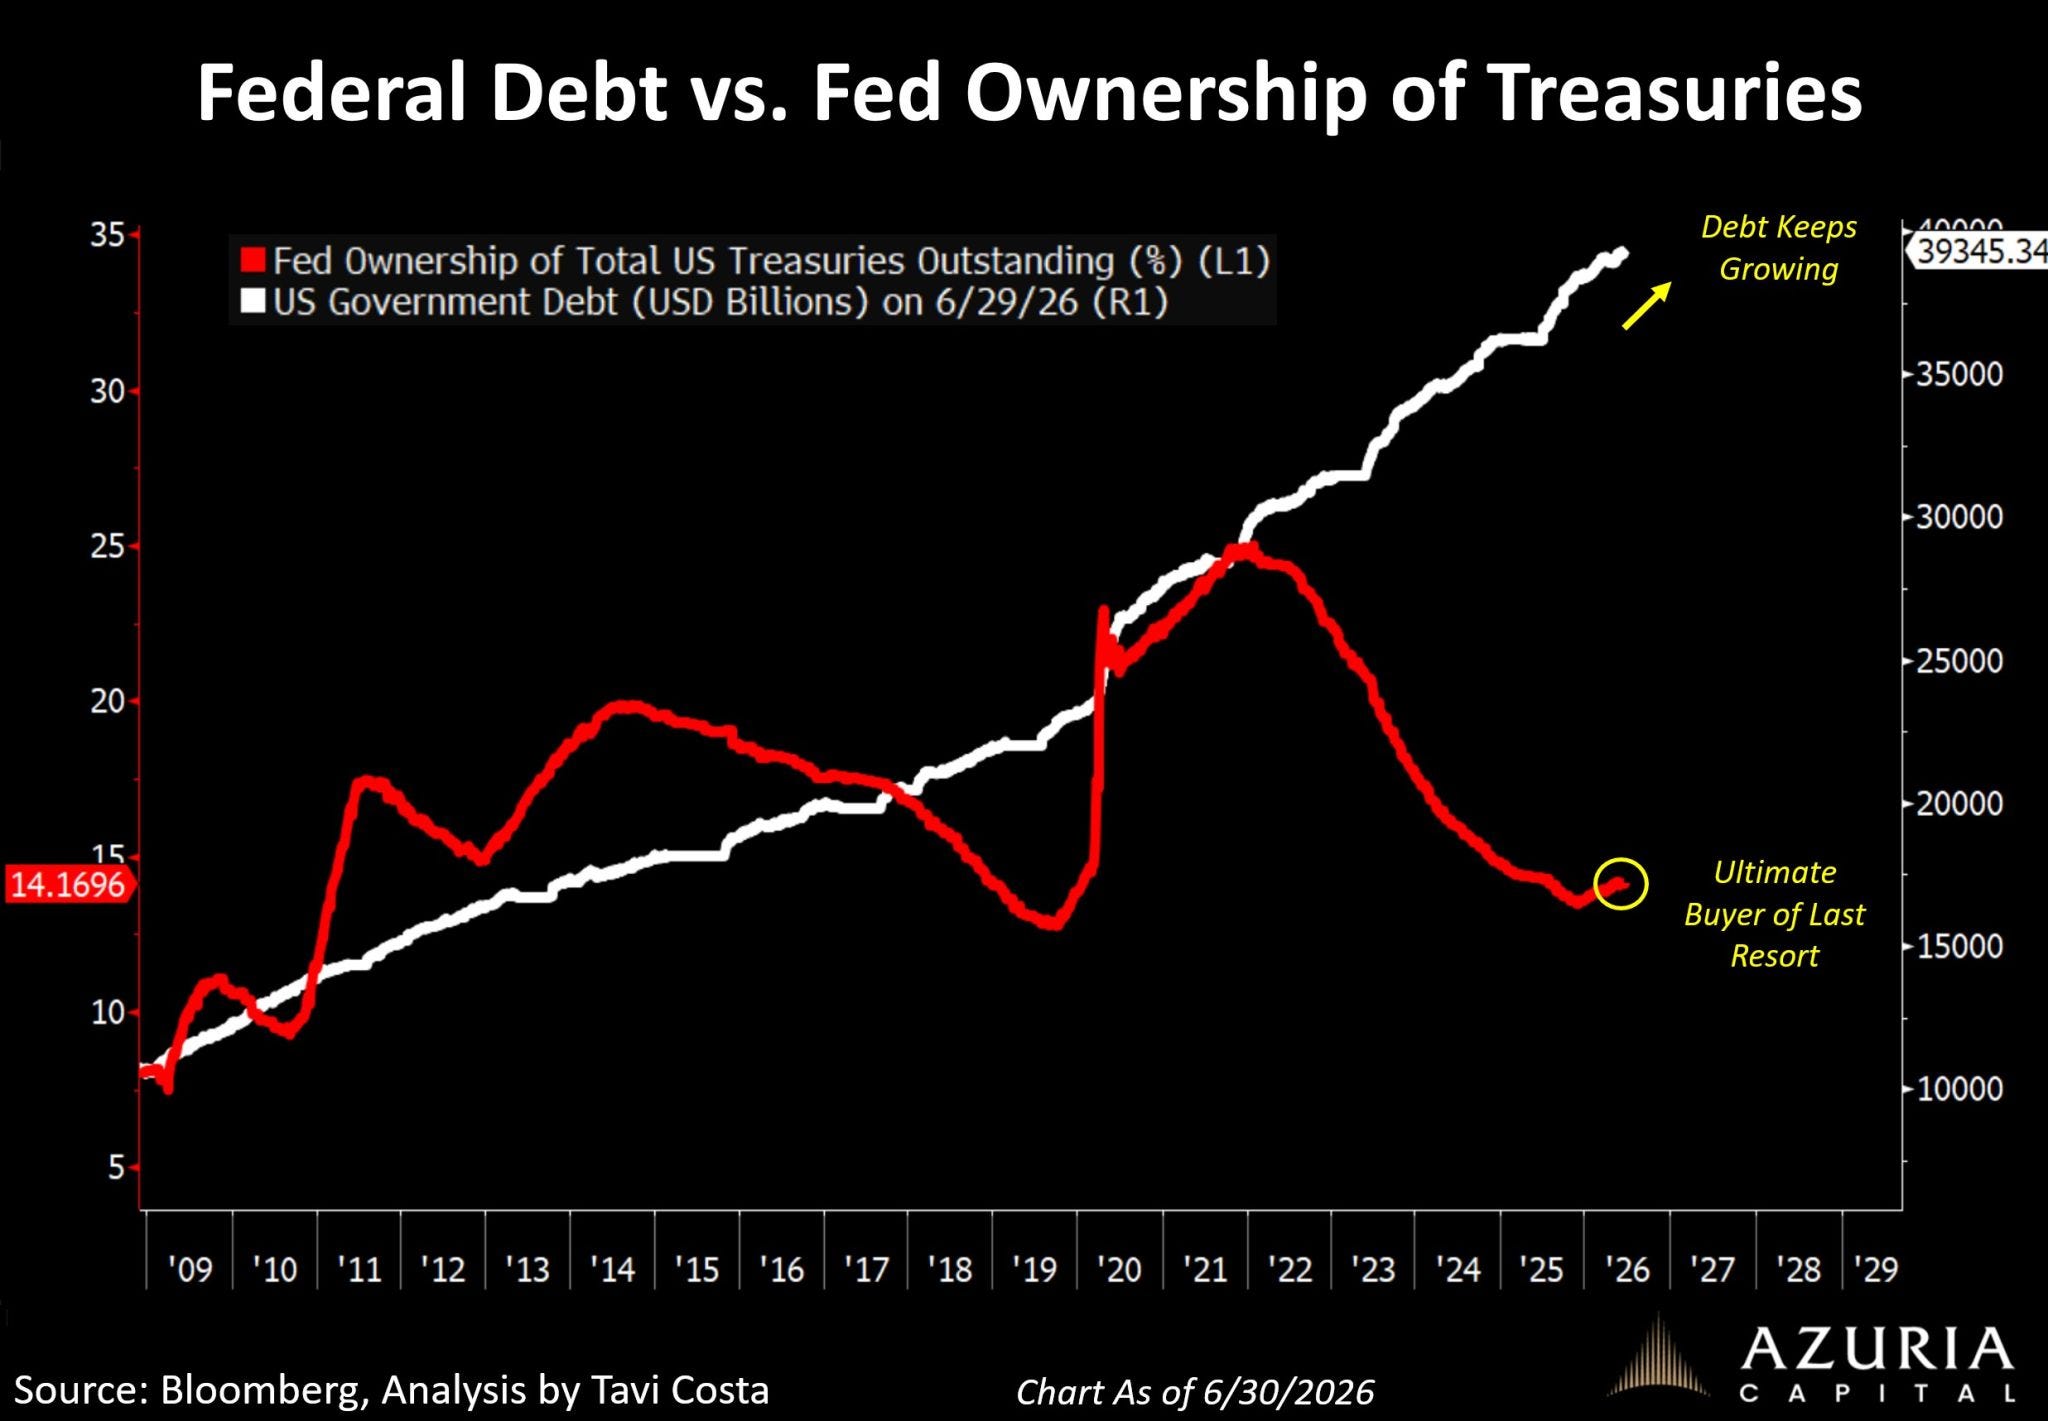
Quantitative tightening has walked the single largest, most price-insensitive buyer in the entire bond market almost all the way out of the room. Coat already on.
Now lay the other line on top: US government debt just crossed $39.3 trillion, and it’s still compounding - straight up and to the right, with no inflection anywhere on the horizon I can find.
Sit with that shape a moment, because it is the hinge the whole letter swings on.
The one buyer who never asks the price is shrinking - precisely as the supply he used to swallow goes vertical. A gap like that cannot simply hang open in the air.
Somebody has to finance $39 trillion and counting, and private buyers will - but only at a price: higher yields, a weaker long bond, or both at once.
Unless, of course, the buyer of last resort comes back. And he always comes back.
He came back in September 2019, when overnight repo spiked toward 10% and the Fed restarted its balance sheet under a quieter name, and the S&P promptly rallied about 15% into February 2020. He came back in 2020 at a scale that made everything before it look like a rehearsal.
The label changes - QE, yield-curve control, “balance-sheet management.” The plumbing behind the wall never does.
So here is the relationship that just quietly broke, the one that ties the first four charts into a single knot: for years, a hawkish Fed and a shrinking balance sheet traveled arm in arm with a strong dollar and weak hard assets. That’s charts two, three, and four, holding hands.
But you cannot run a hawkish balance sheet and finance a compounding $39 trillion deficit at the same time. One of them has to give. And it is never, not once in my career, the debt.
Which means the strong-dollar, hawkish-Fed regime you just spent four charts admiring has an expiration date stamped faintly on the underside. The market simply hasn’t turned it over to read the label yet.
I have.
And what I intend to do about it - the breakout that’s racing a clock it can’t see, the asset trading 13% below its own fair value, the buyers already front-running the entire thing in silence, and the record sitting on top of it all like a light on the dashboard nobody wants to name - is the whole reason the next section exists.
Everything above is the noise. Everything below is what the noise has been hiding. If the first 5 charts told you the “what,” these 5 tell you the “so what” - and, finally, the “now what.”
Two simple paths below - Yearly to begin, Lifetime to never look back.
[🎁 #7 BONUS if you become a PRO today]


Comments
Nothing yet. Say the first thing.
Sign in to join the conversation.