
In this week’s warm-up our conversation quietly turned into a small masterclass on visual thinking for self-reflection. We didn’t plan it that way, but a bunch of simple frameworks emerged that are surprisingly powerful when you put pen to paper.
This newsletter is a quick tour of those visual tools so you can try them in your own notebook or sketchbook.
Last week we finished AtomicSketches for February month. Here’s compilation of what community did.
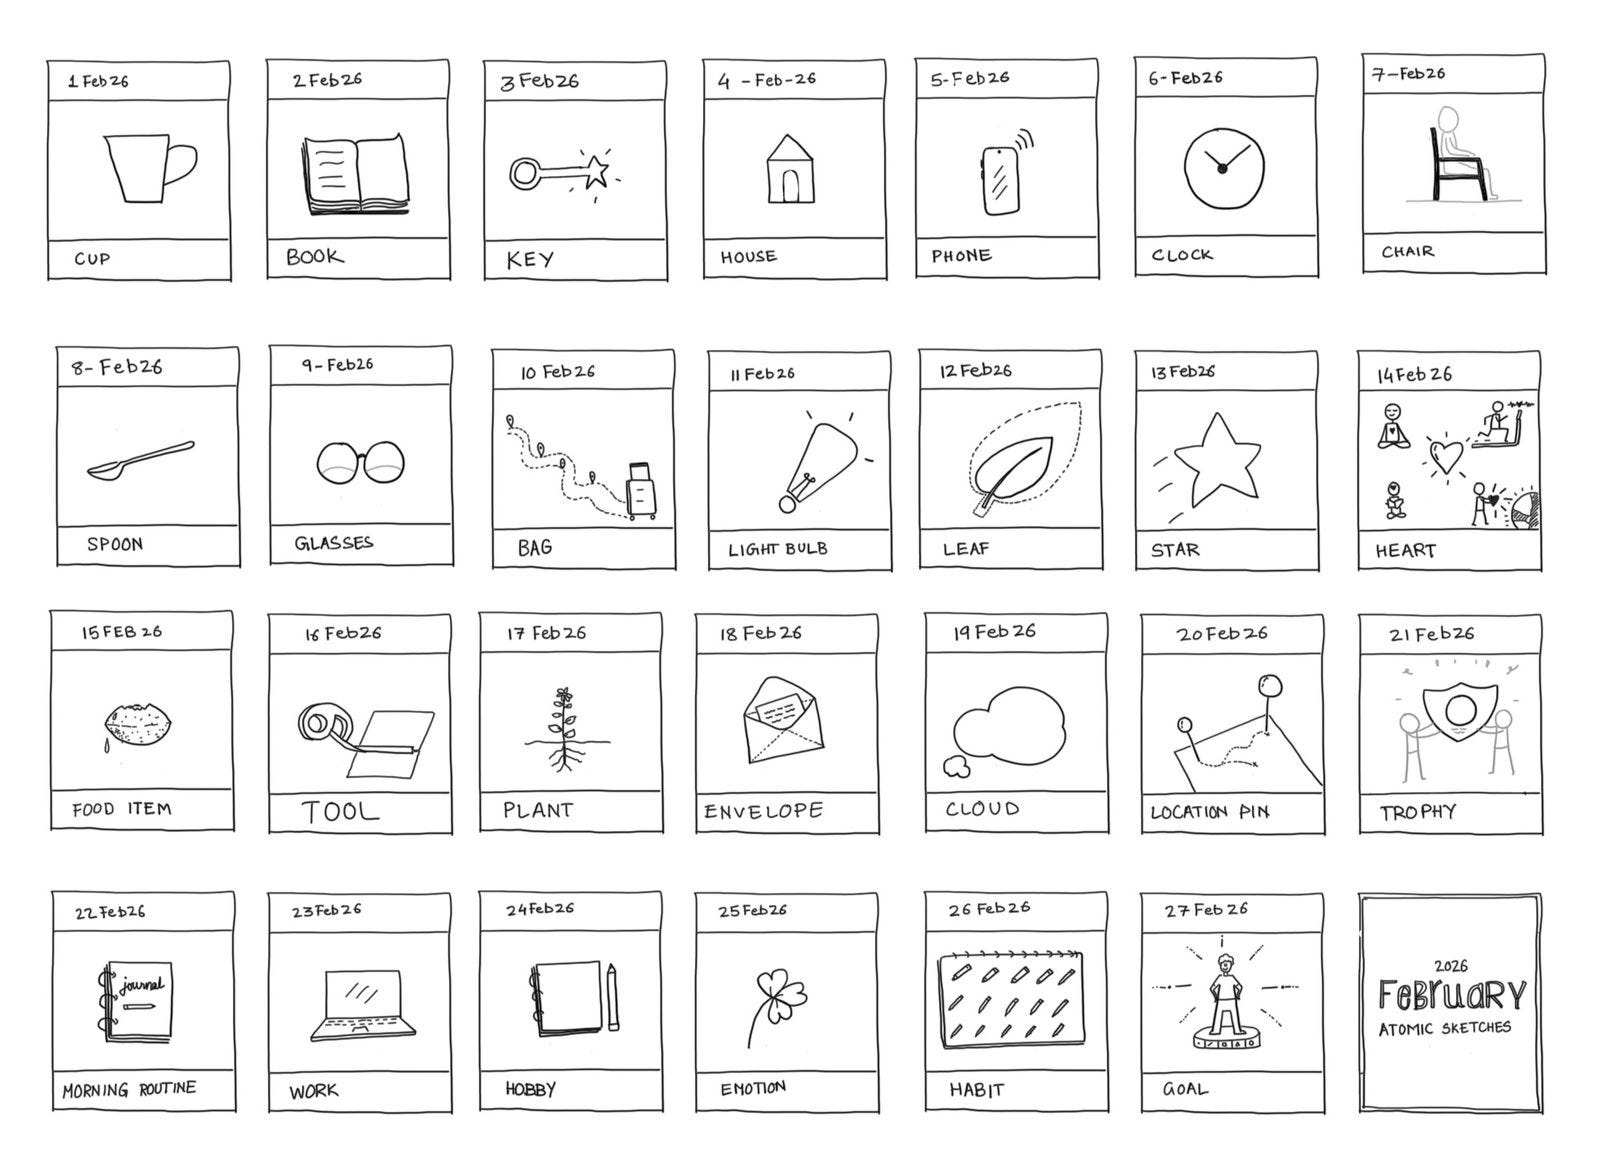
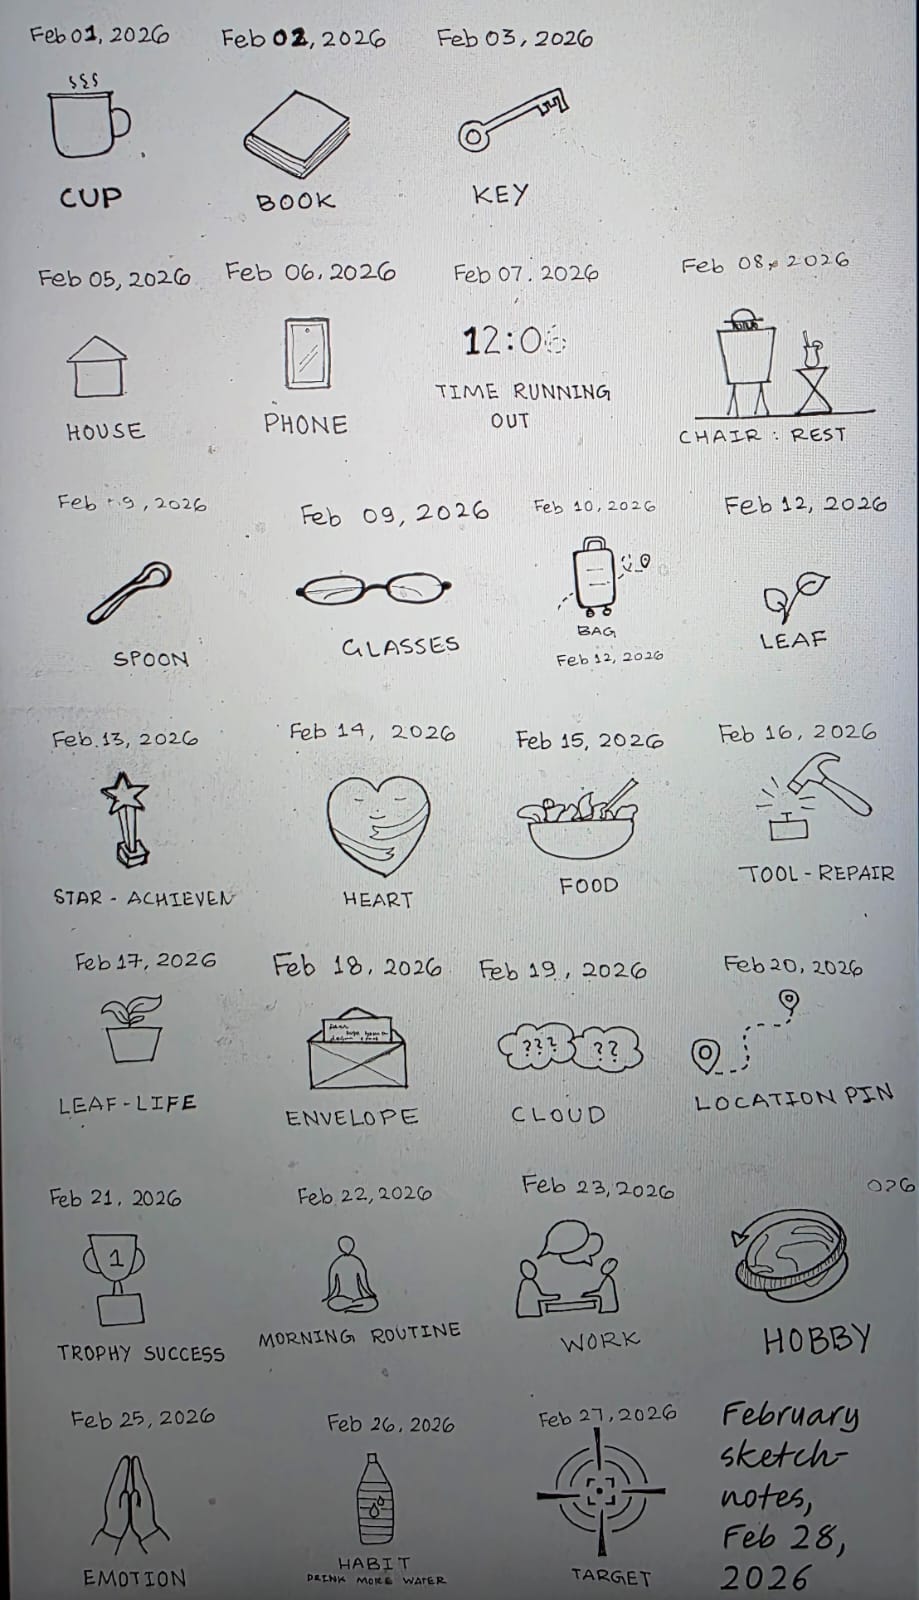
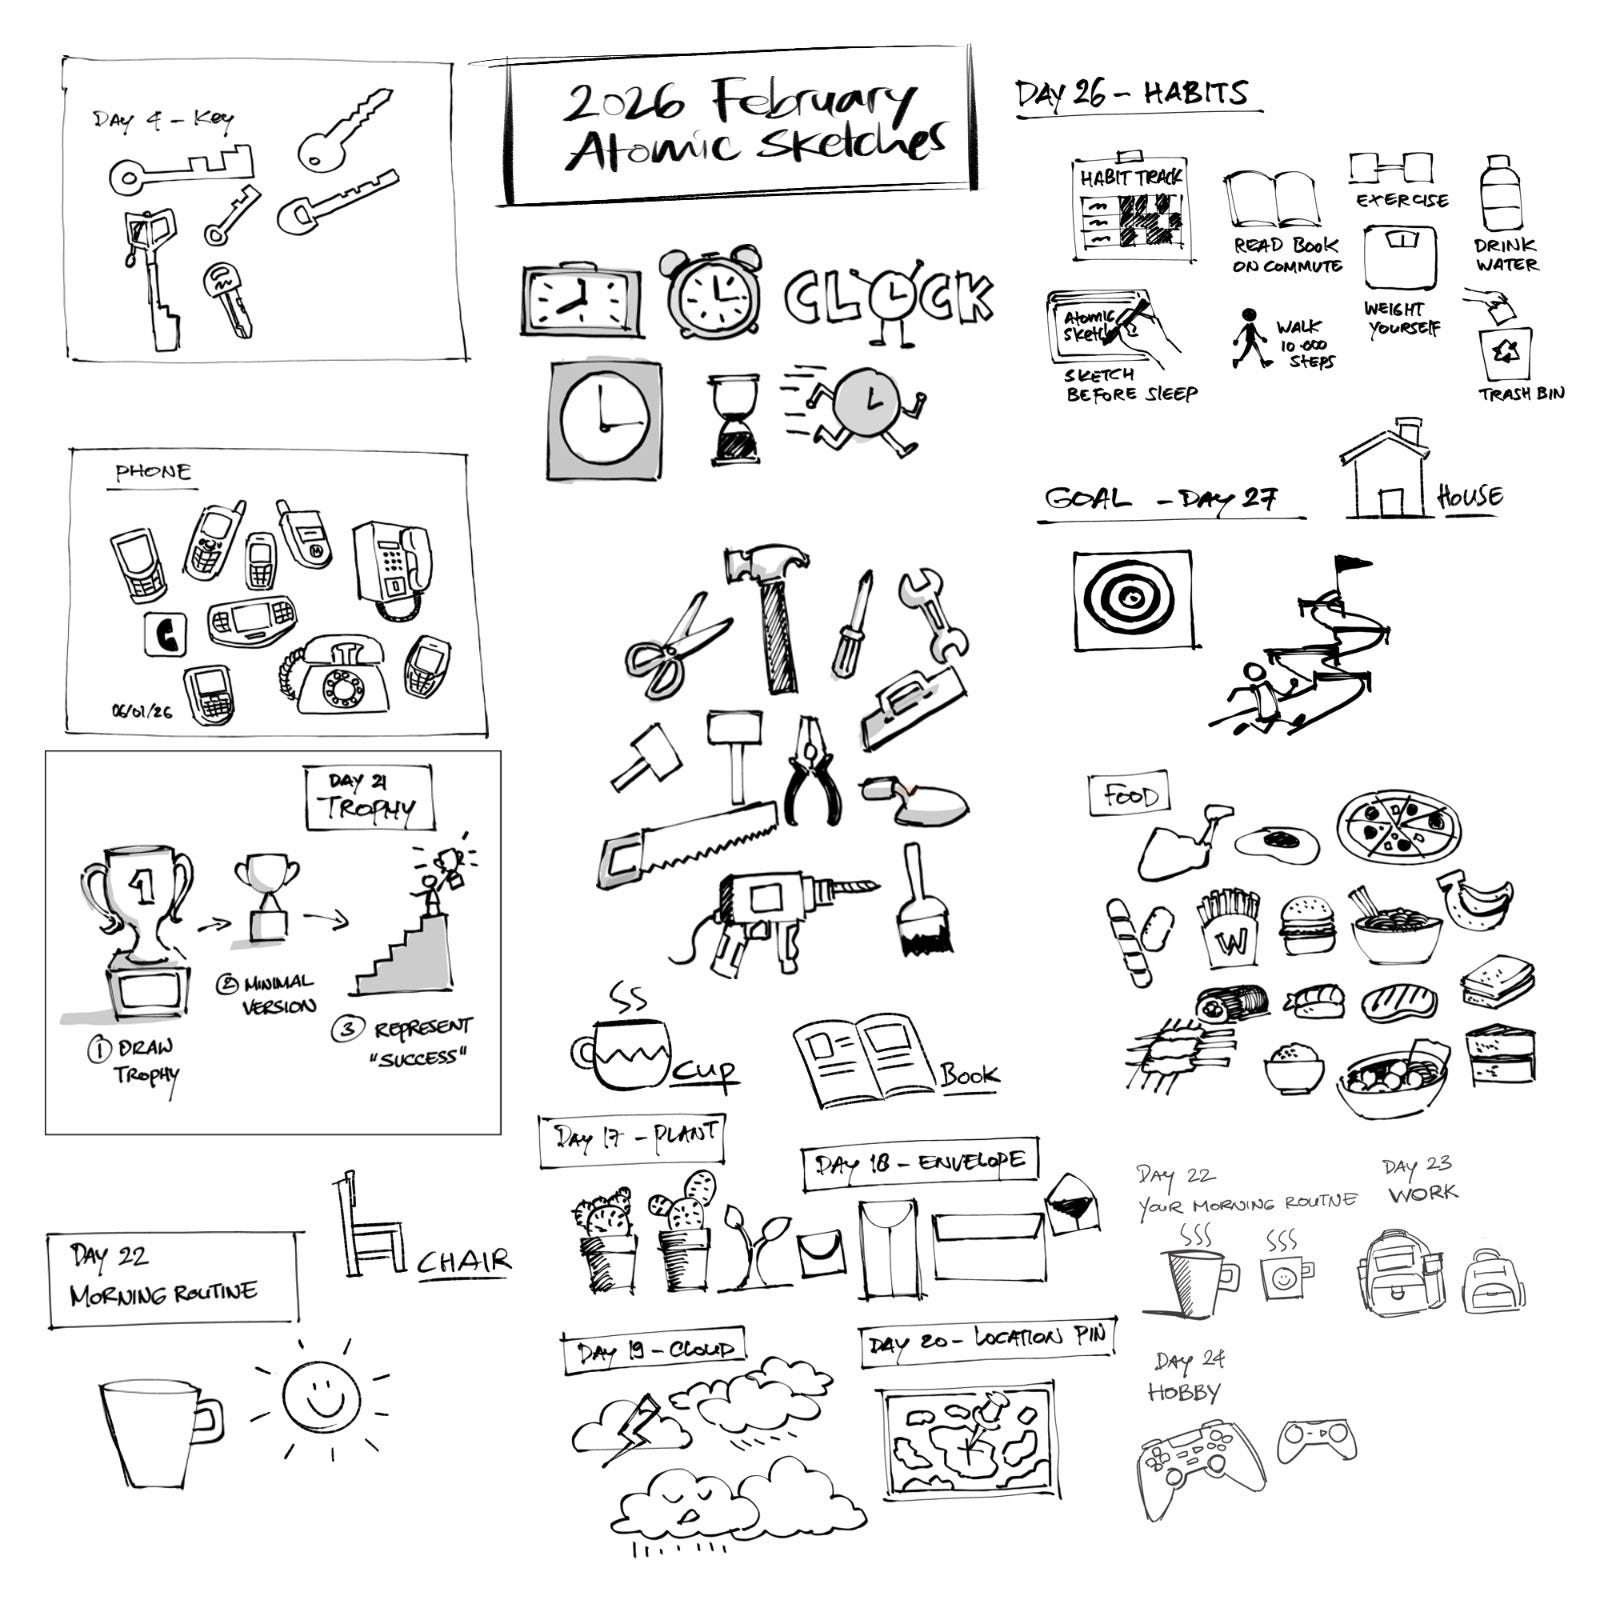
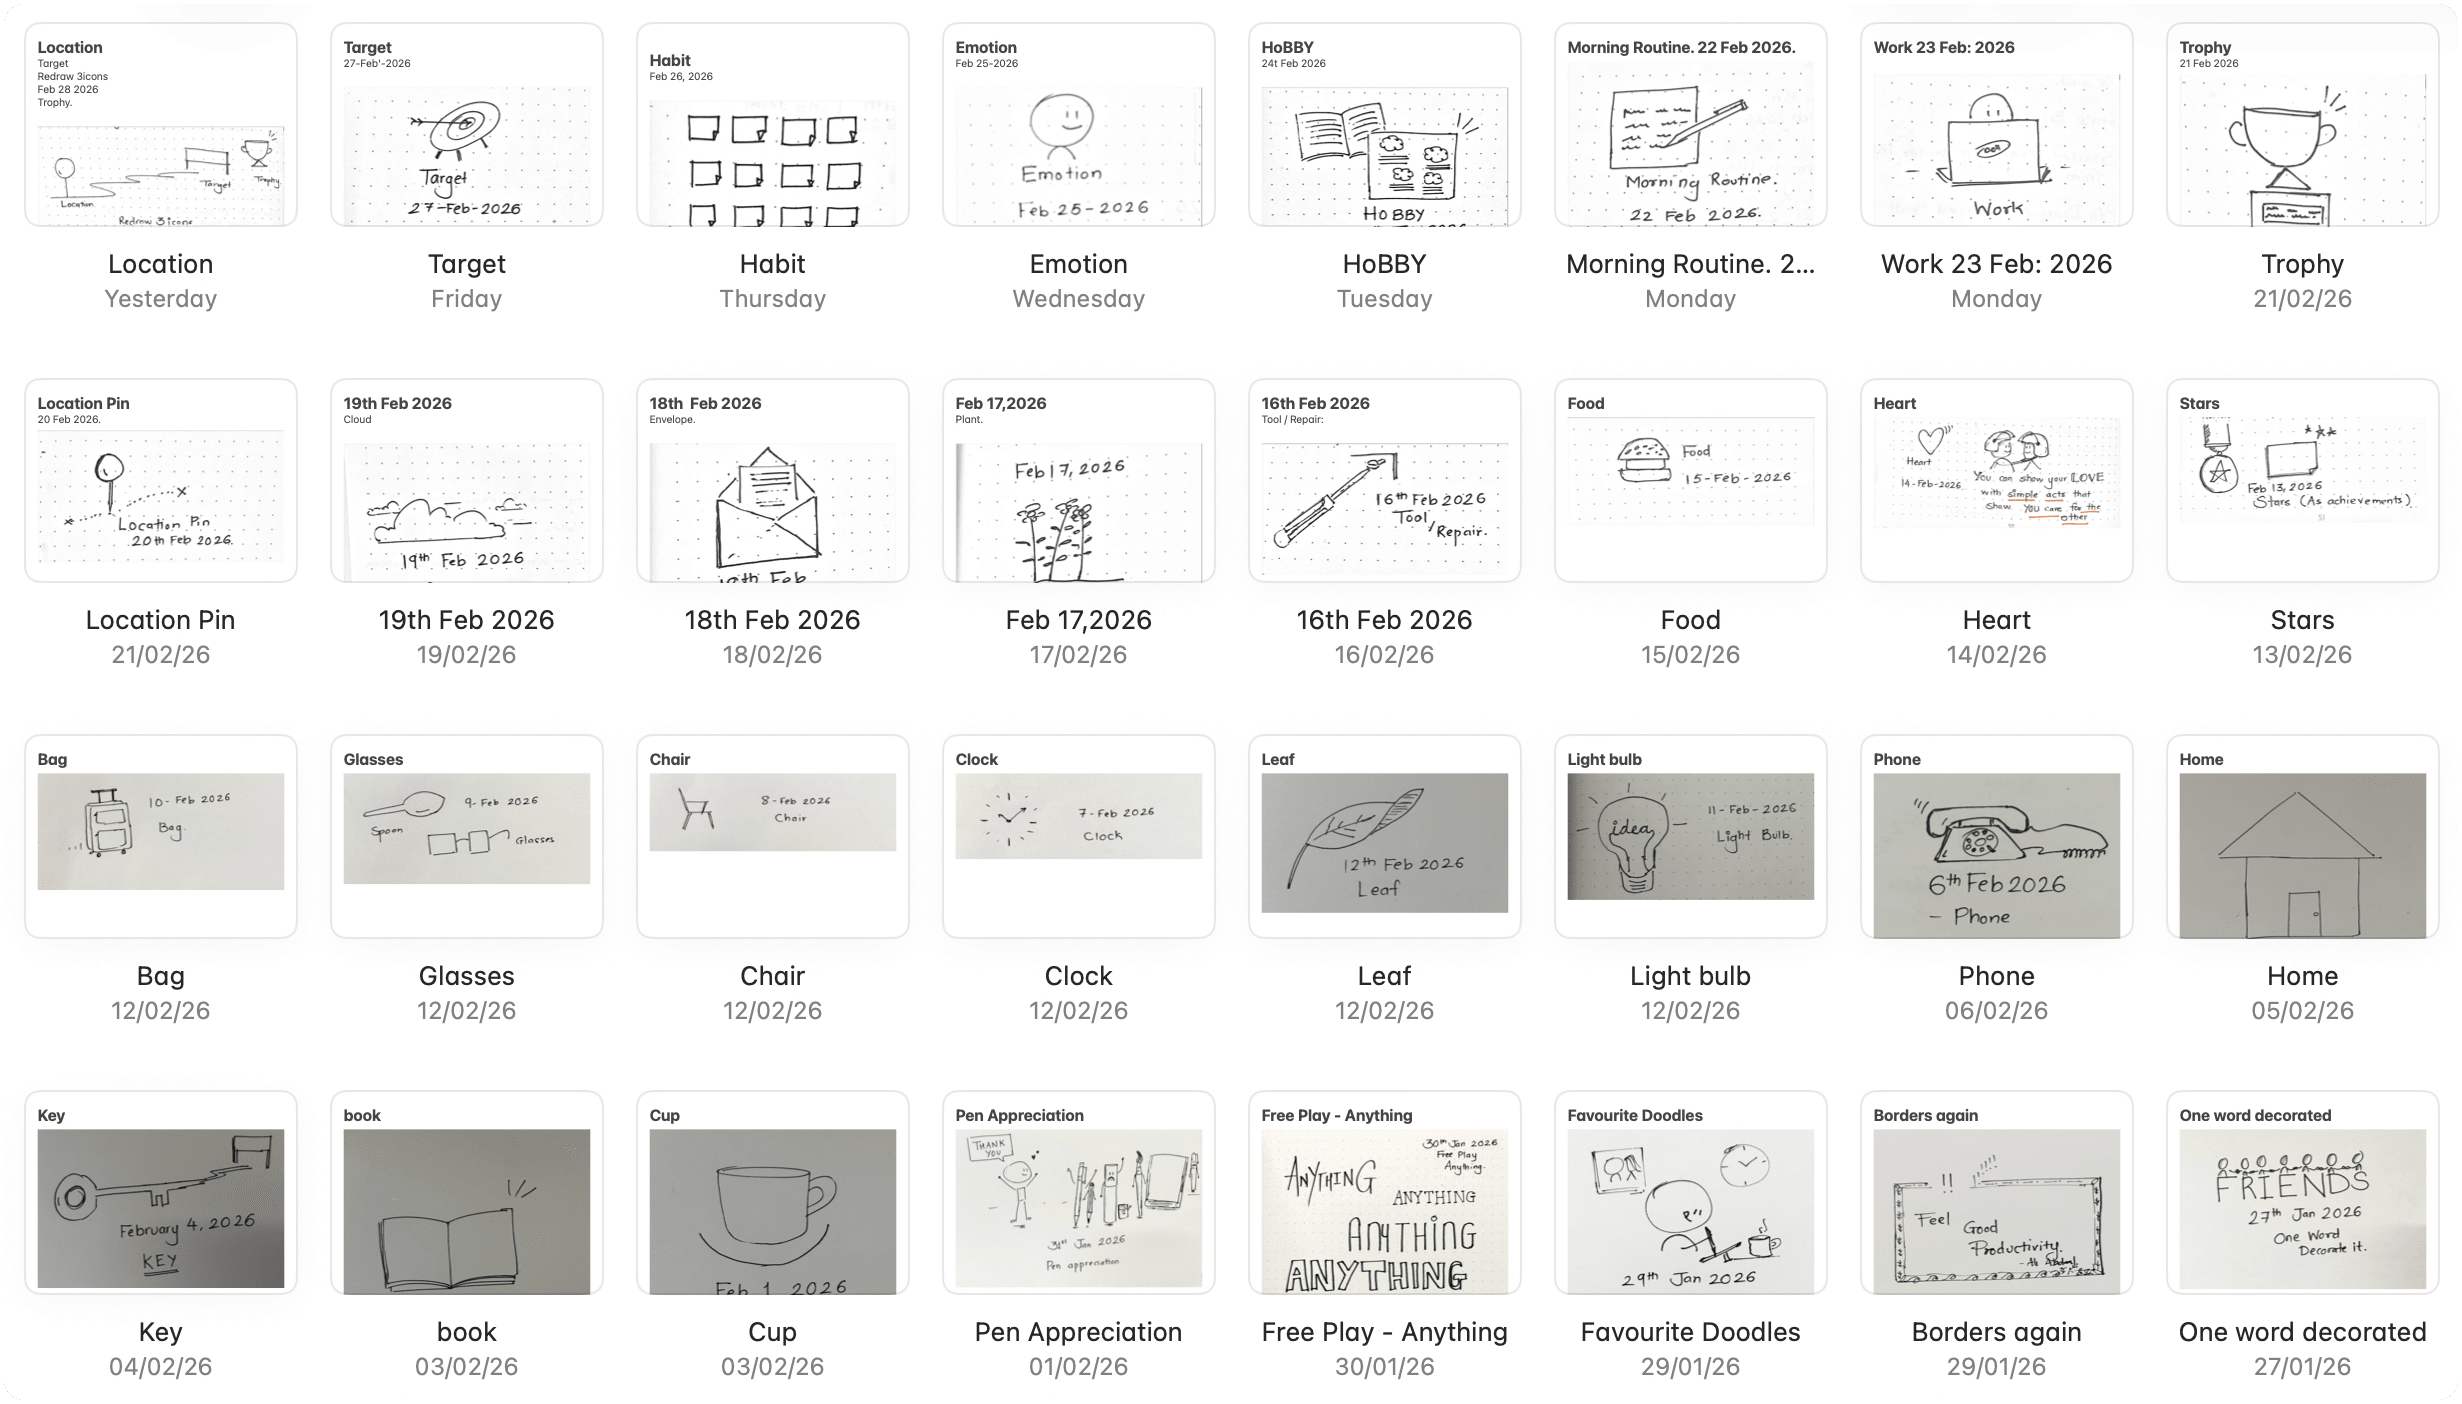
That’s about second month. In March we are learning to sketch faces everyday in Atomic way.
I send out weekly newsletter packing content on Sketchnotes and using them in day to day life. Also my experiments, experiences, learning, and mistakes.
Hit this button if you want to keep in touch.
Kanupriya shared a beautifully simple practice: continuums.
Draw a horizontal line and label its two ends, e.g.:
Easy → Difficult
Comfortable → Uncomfortable
Low Effort → High Effort
Low Pleasure → High Pleasure
Write your tasks on sticky notes (or small boxes) and place them along the line.
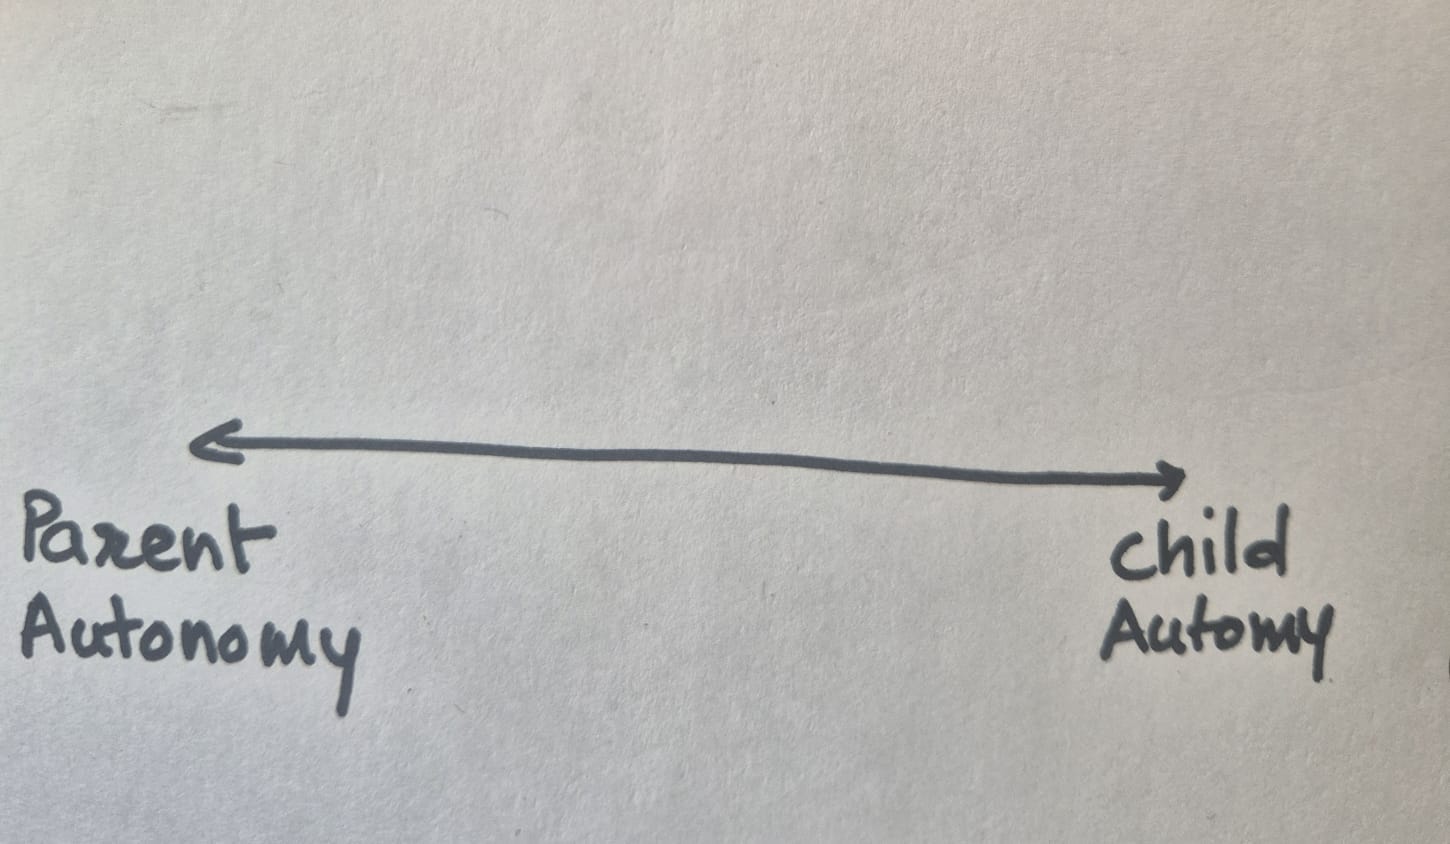
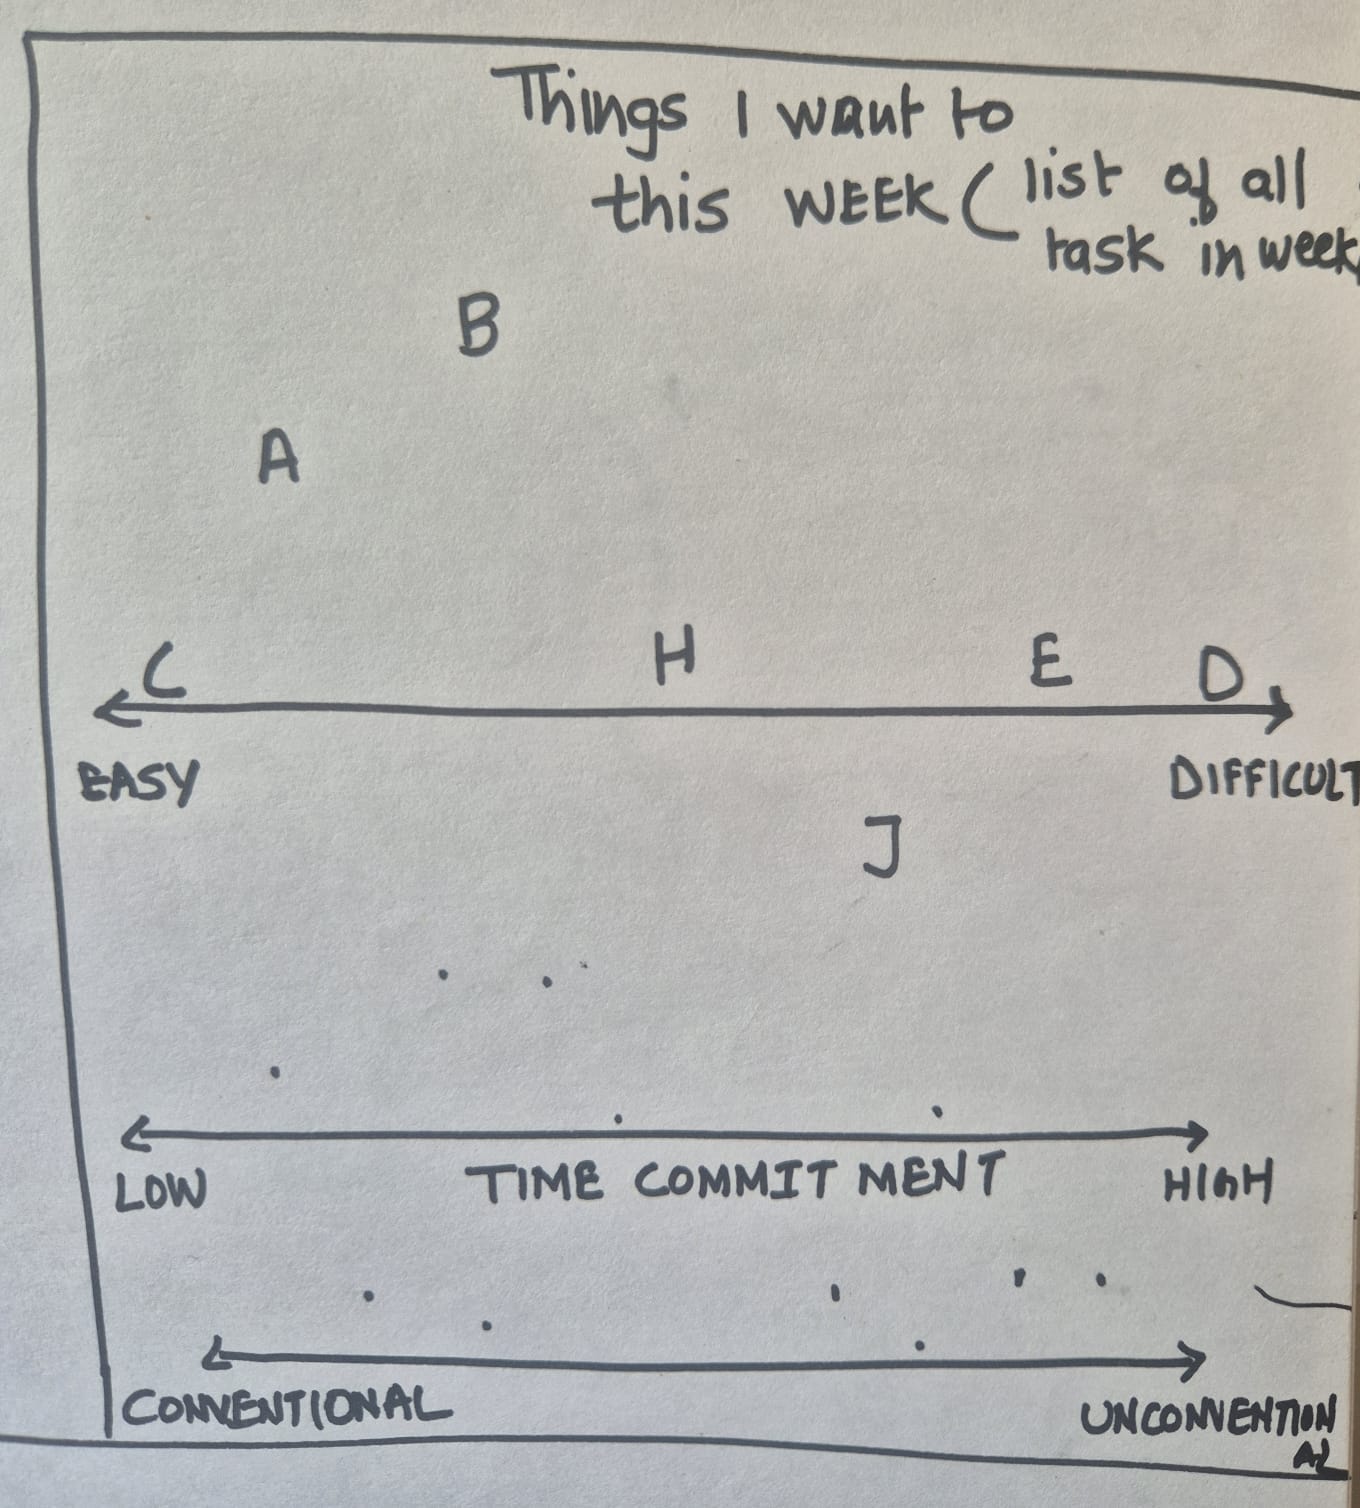
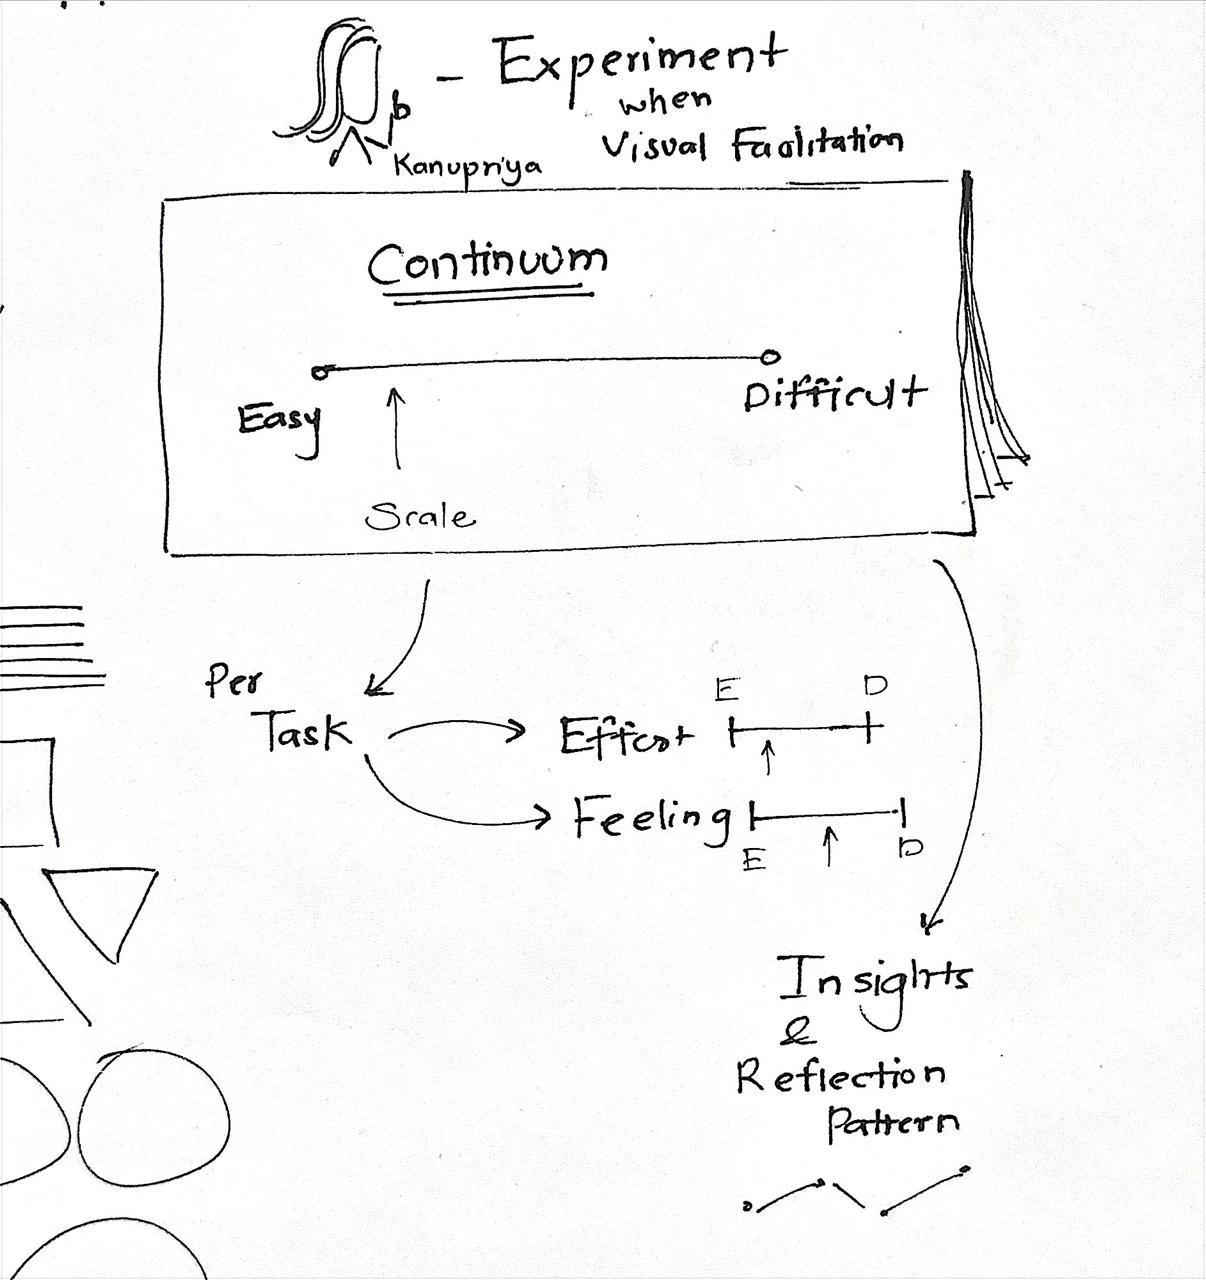
You can go further with multiple continuums for the same task:
One line for effort
One line for pleasure
One line for comfort
Same task, different placement. That contrast is where the insights live.
This is visual thinking at its simplest:
straight lines,
a few labels,
and your tasks laid out as a landscape instead of a mental blur.
Based on continuum concept I shared a 2×2 matrix I use with my team:
Draw a square and split it into four:
X-axis: Information (Less → More)
Y-axis: Speed (Slow → Fast to get done)
Place current tasks into quadrants:
Fast + More Information → Do these first.
Fast + Less Information → Go find the missing info and move quickly.
Slow + More Information → Plan and schedule.
Slow + Less Information → Question if they’re really needed / de-prioritize.
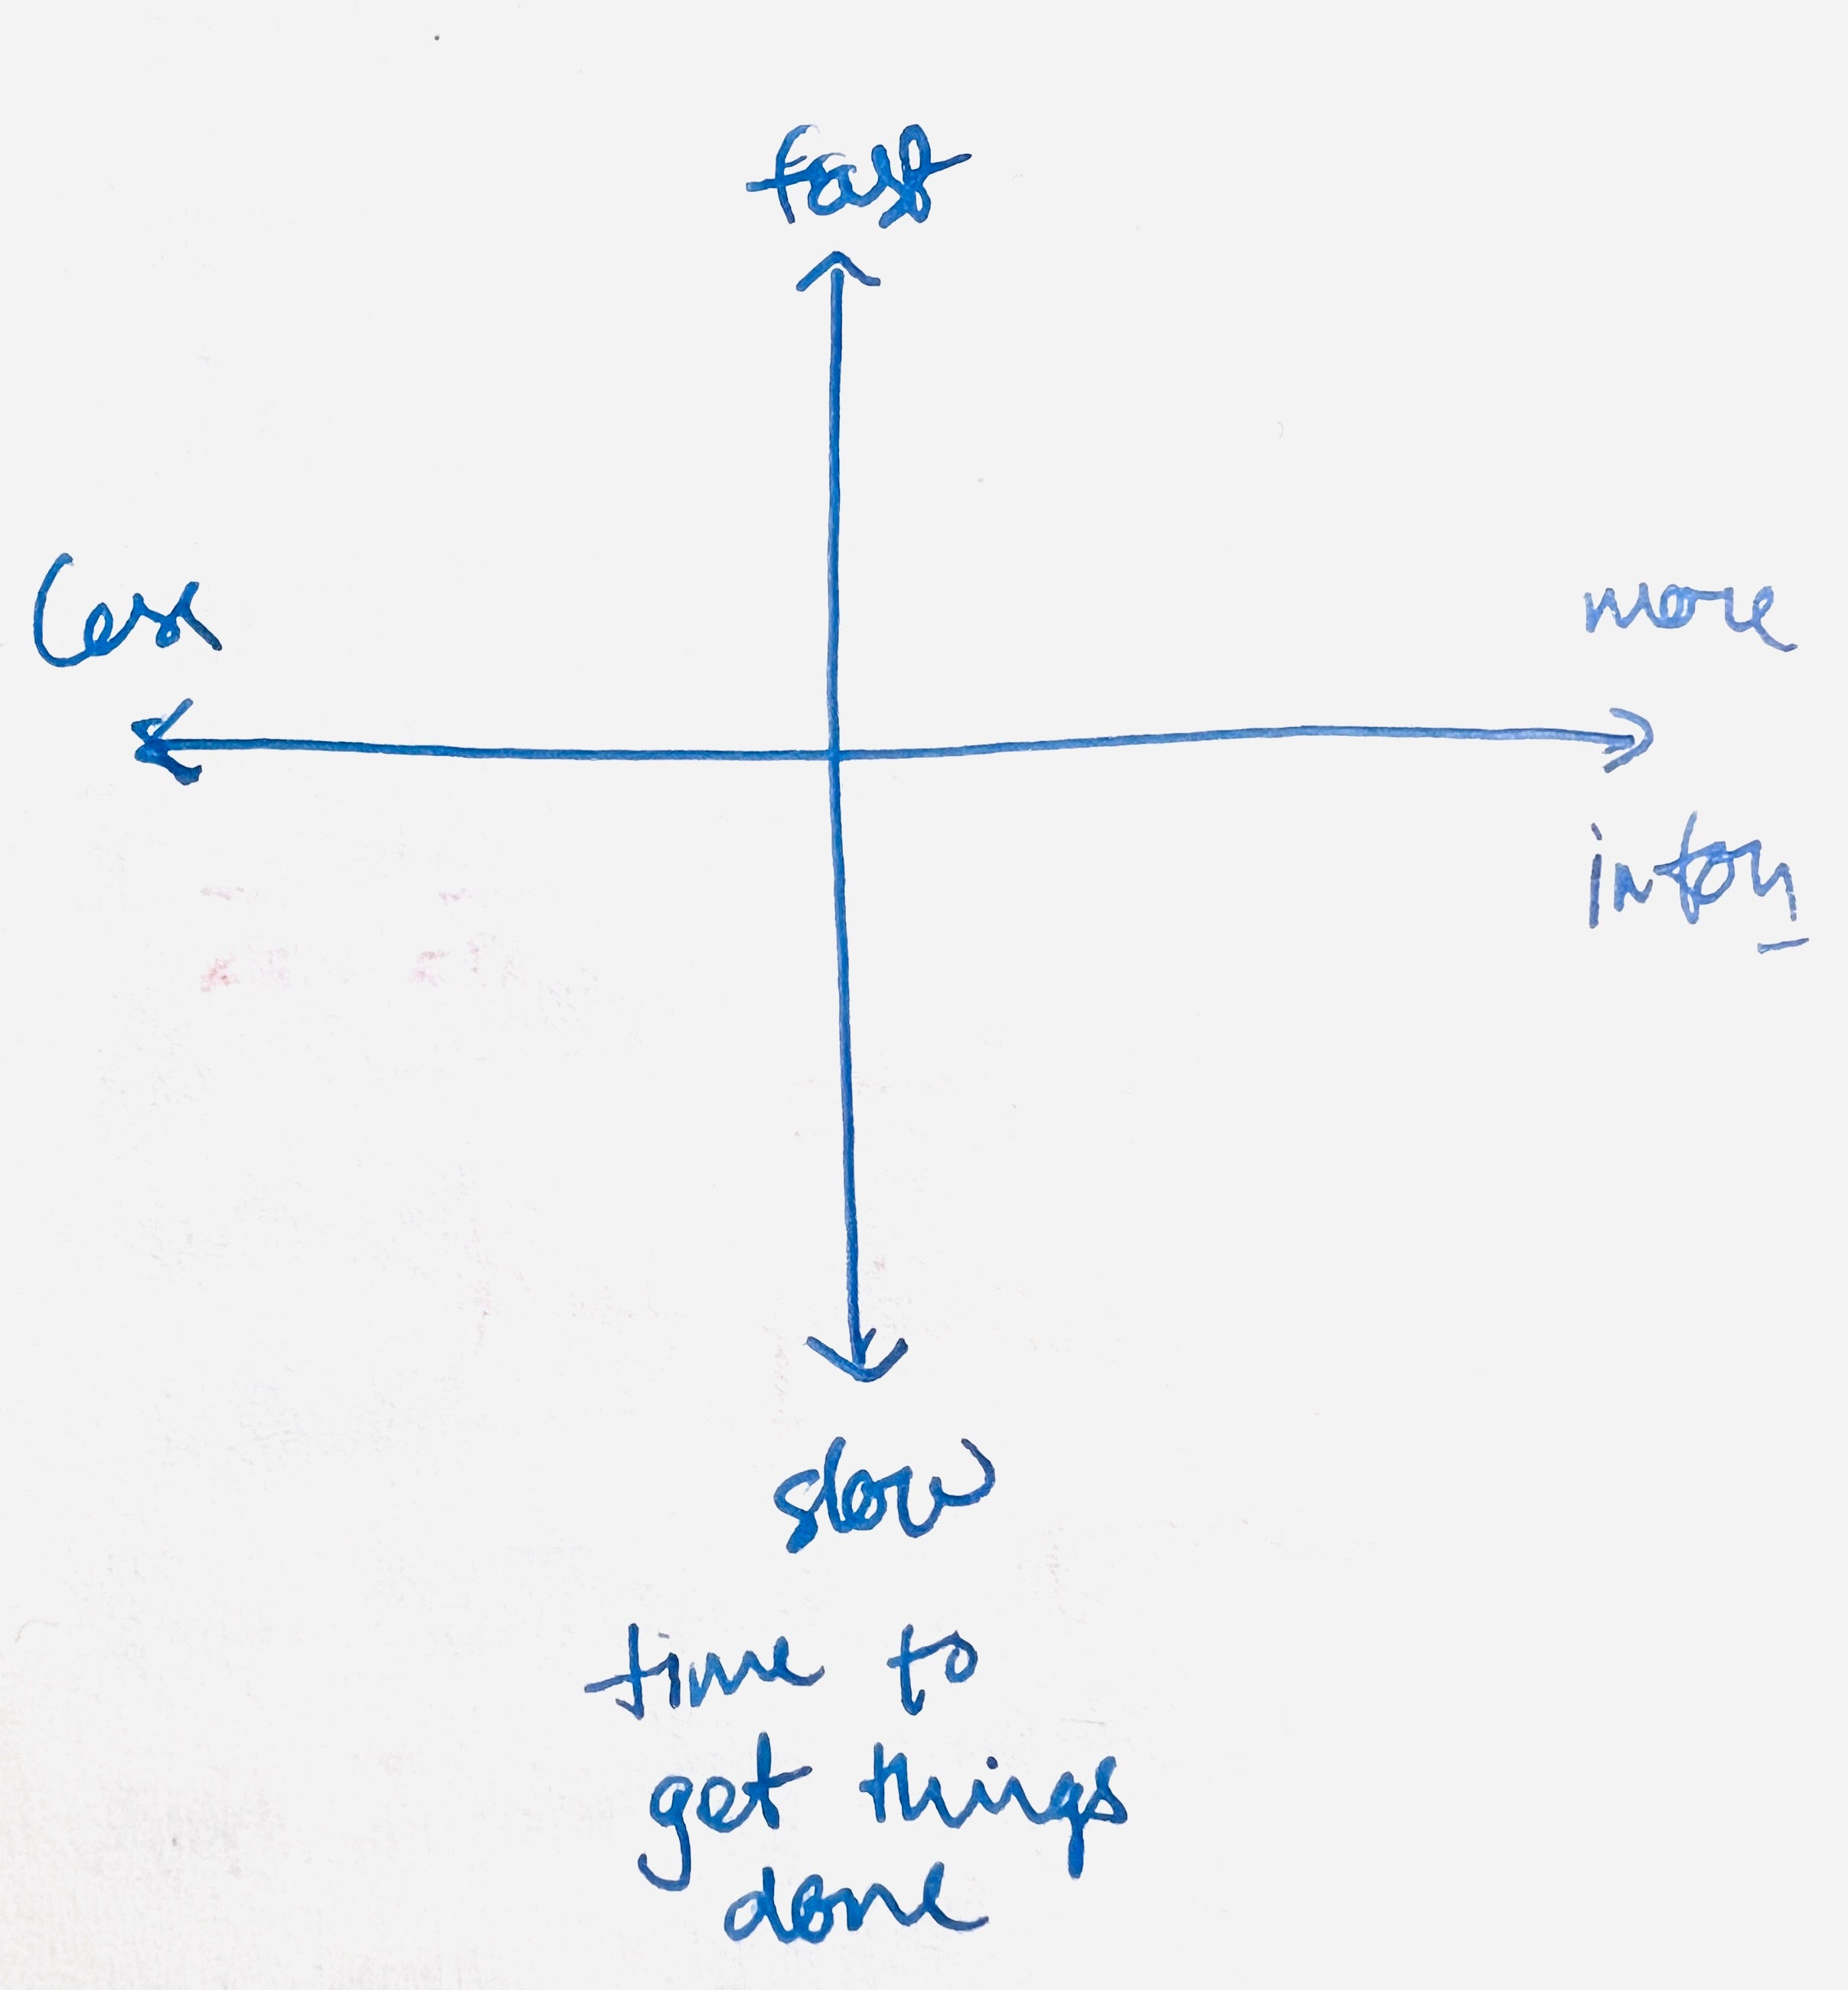
This simple grid helps:
reduce decision fatigue,
surface what you can move on today,
and slowly train people (or yourself) to make clearer choices without constant supervision.
It’s just four boxes, but it becomes a visual dashboard for your work.
I introduced a “brain map” based on five major regions. Idea is to understand the physiology of our brain and map exact information to be more self aware.
You don’t need to remember the exact biology; treat it as a visual template to ask better questions.
Roughly sketch a side view of a head and divide it into five zones
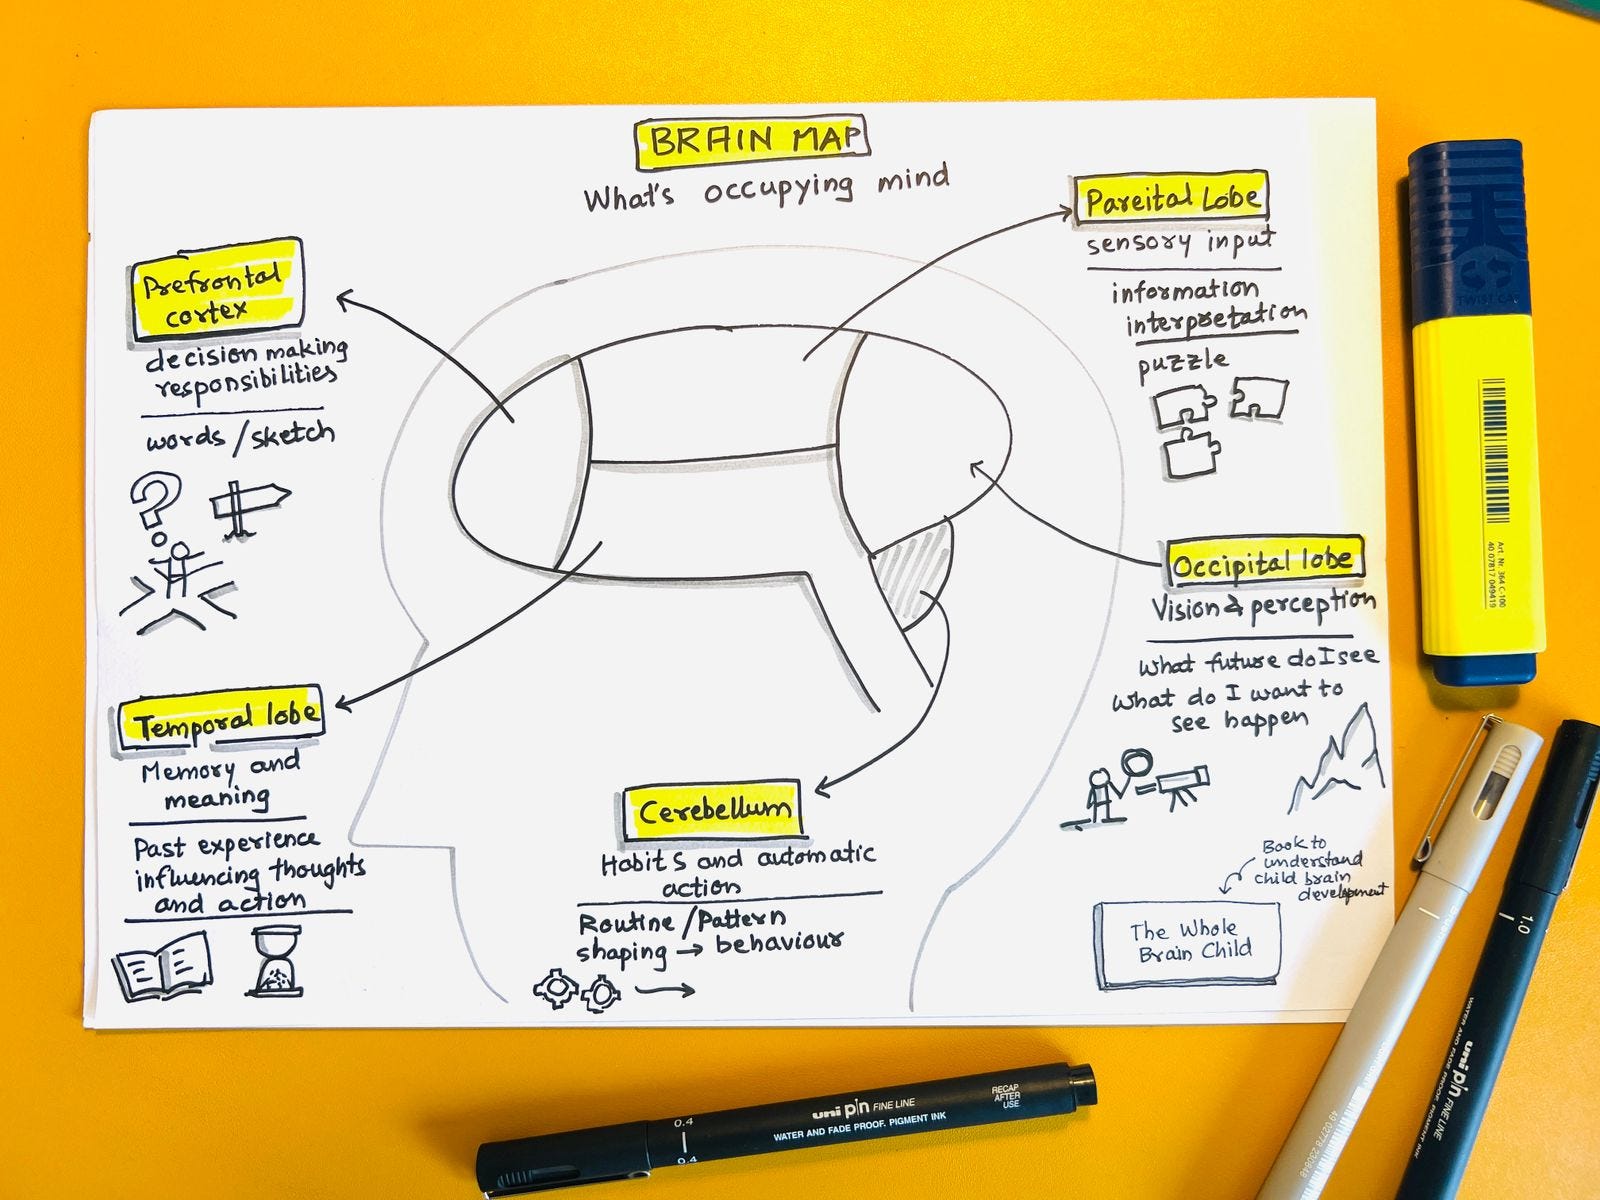
Similarly create another visual framework for Heart map
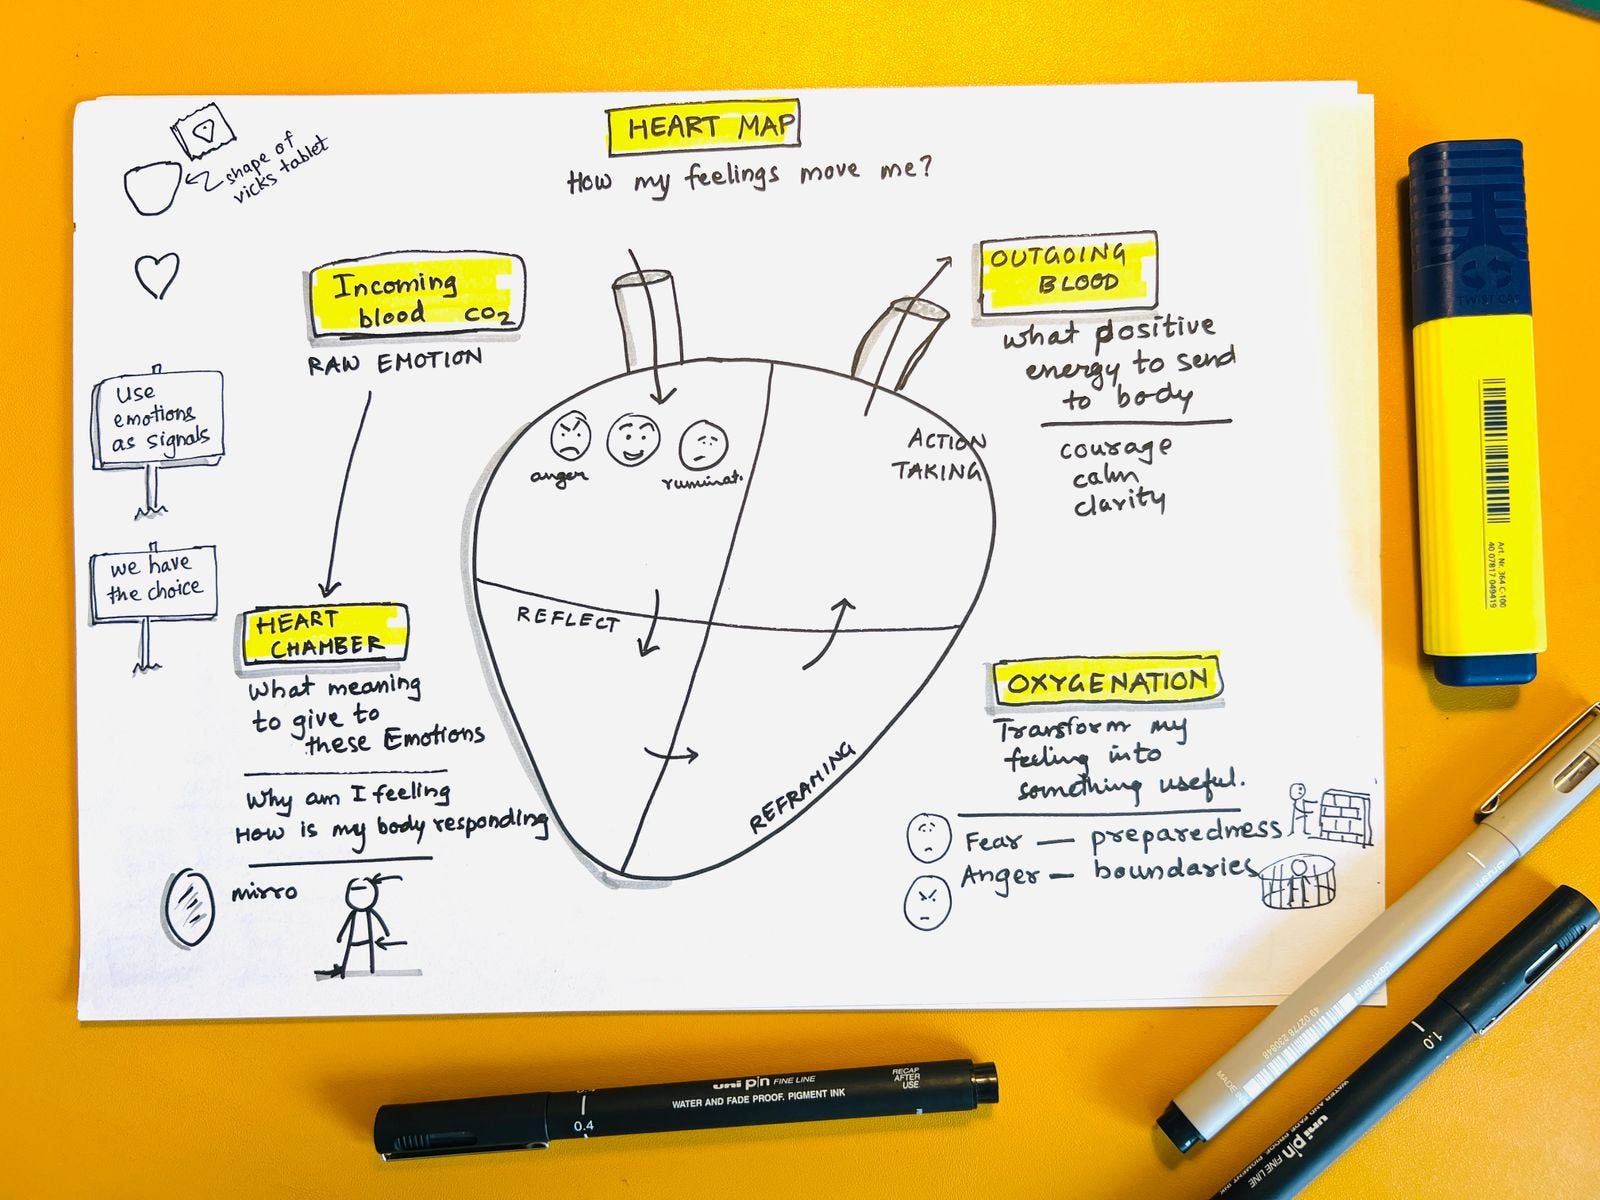
Incoming Blood (negative emotions)
Raw emotions entering: fear, anxiety, anger, rumination
Visual: sketch faces with emotion labels
Heart Chamber (processing/reflection)
Understanding meaning behind emotions
Questions: Why am I feeling this? How is my body responding?
Visual: mirror or body diagram showing physical impact
Oxygenation (reframing)
Transform emotions into useful perspectives
Fear → preparedness, Anger → boundary setting
Reference to Bhagavad Gita: mind as friend when mastered
Outgoing Blood (positive energy)
Transformed emotions: courage, calmness, clarity, patience, joy, compassion
Note: Even positive emotions need balance (avoiding excess)
During the session recommendations for some books that are being read and referred to for the visual frameworks were shared.
Elements of Style (for creative work and writing)
The Whole Brain Child (understanding brain development)
Radical Candor (feedback techniques)
Quiet Leadership (improving team thinking)
That’s all I have for today.
If you like content of this newsletter please click that like button and share it in your network. Help me spread the word about this amazing note taking skill.
Join TheSketchnoters Community
Happy Sketchnoting.
No posts
Comments
Nothing yet. Say the first thing.
Sign in to join the conversation.