
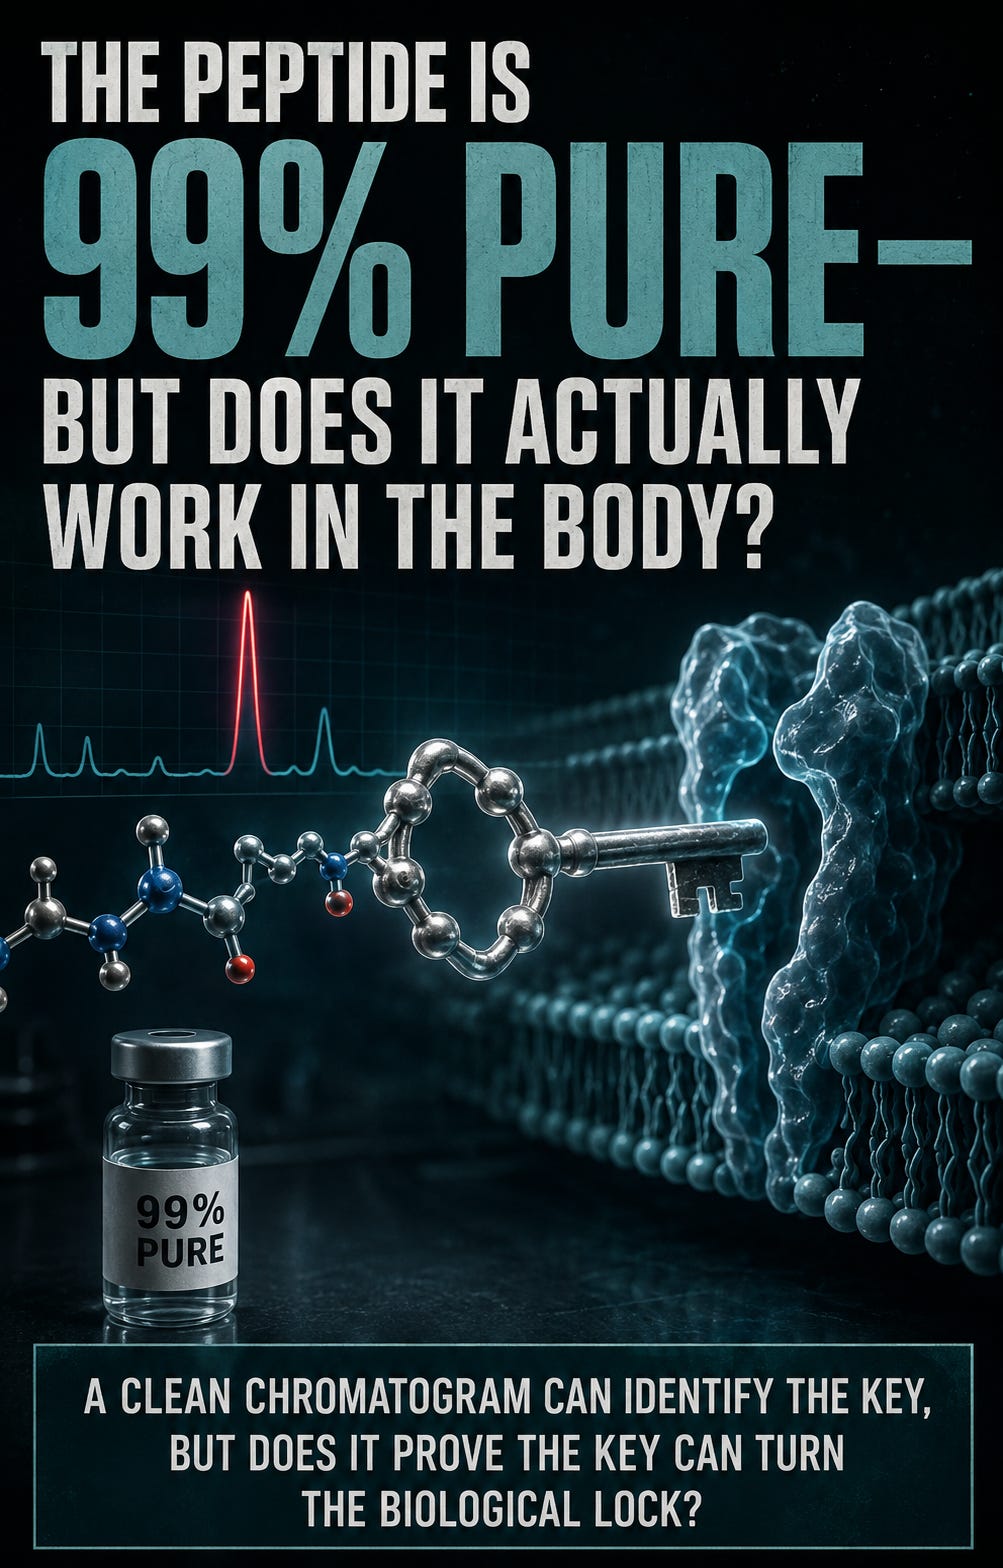
Most grey-market COAs give us three headline results: identity, quantity and a purity percentage. So if those are the results we are shown, how do we know how biologically active the product actually is without a functional assay? Apparently, this isn’t a simple question.
What the Usual COA Tells Us
The reports most people see in the grey market normally answer three main questions:
Identity: Is the detected material consistent with the peptide named on the vial?
Quantity: How much peptide was measured?
Purity: How much of the chromatographic response belongs to the main peak rather than the impurities separated by that particular method?
All three are important, but they’re not three different ways of measuring potency. A result of 99% purity doesn’t mean the vial contains 99% of the amount printed on the box, and it doesn’t mean the product has 99% of the expected biological activity. On the reports being discussed, it generally means that the main peak represented about 99% of the integrated chromatographic response under that laboratory’s test conditions. The result is only as informative as the method’s ability to separate and detect the relevant impurities.
This is where Janoshik pushed back. He asked why anyone would assume degradation wouldn’t appear and pointed to Karlsson’s work, in which an optimised RP-HPLC method separated specific oxidised and deamidated growth-hormone variants. That’s fair evidence that suitably designed chromatography can reveal particular degradation products. It doesn’t prove that a generic HPLC method will find every possible modification, and nobody was arguing that degradation could never appear.
However, “this method could detect it” is not automatically the same as “this report shows it was checked and excluded.”
The question remained: does detecting the expected molecule and its impurities directly measure what that molecule does?
“Same Molecule, Same Bioactivity”
Janoshik's eventual answer was: “Same peptide, same molecule = same bioactivity.”
At a fundamental level, that makes sense. If two samples genuinely contain the same molecule and are compared under equivalent conditions, they should have the same inherent biological activity. Rina from BT Labs made a similar point: if the peptide has the correct structure and folding, it will most likely have the correct biological activity, while structural analysis is faster and cheaper than running an activity assay.
The important words are “genuinely the same complete molecule” and “most likely.”
Those statements explain why activity can sometimes be inferred. They don’t turn a routine purity percentage into a direct measurement of activity. The real issue is how completely “sameness” has been established by the report in front of us.
An expected molecular mass and one dominant HPLC peak can provide strong evidence, but full characterisation may require sequence confirmation, comparison with a suitable reference and complementary methods capable of finding variants that one test may miss.
EMA guidance makes the same distinction. It says a potency assay may be omitted from finished-product release and stability testing when the mechanism of action depends only on the peptide’s primary structure and quantity.
Primary structure means the peptide’s chemical building plan: which amino acids are present, the order in which they are connected and any defined chemical modifications. Higher-order structure means the three-dimensional shape that chain adopts. This includes local features such as alpha helices and turns, its overall fold and, where relevant, how multiple molecules associate with one another.
That shape can affect activity because a receptor doesn’t recognise only a list of amino acids. The important parts of the peptide must also be presented in the correct spatial arrangement to bind and activate it. Two samples might therefore have the expected sequence and molecular mass while differing in conformation, aggregation or molecular association.
Routine HPLC and intact-mass testing don’t automatically establish this three-dimensional arrangement. Higher-order structure can be investigated using complementary methods such as circular dichroism, NMR, infrared spectroscopy and, in some circumstances, X-ray crystallography or cryo-electron microscopy.
For some small, well-understood synthetic peptides, the correct sequence strongly determines the expected shape and activity. If that relationship has been properly demonstrated, regulators may allow routine biological potency testing to be omitted. However, when function depends on a higher-order structure that physicochemical testing cannot adequately establish, EMA says a biological assay should be included. EMA: Guideline on the Development and Manufacture of Synthetic Peptides
In other words, the laboratories aren’t wrong that comprehensive structural characterisation can sometimes provide enough evidence to infer expected activity. The problem starts when “structure” is reduced to a routine purity result and inferred activity is presented as though it had been measured.
GLP Peptides, Helices and the Missing Measurement
The discussion then moved onto the structure of GLP receptor agonists. Chromate said peptides have simple alpha helices that form spontaneously, while Janoshik initially replied that peptides are generally too small to have structures like that. BT Labs pointed out that GLP-based peptides are not all tiny, structureless chains and that GLP receptor agonists engage their receptors in an alpha-helical conformation. A 2024 structural study found receptor-bound retatrutide in a continuous alpha helix at all three of its target receptors. Retatrutide structure study, Cell Discovery
That helped explain the importance of the correct conformation, but it still didn’t answer the original question. Showing, or inferring, the expected structure isn’t the same as measuring receptor activation. For synthetic GLP agonists, the practical question is whether the methods used could detect the relevant sequence errors, degradation products or other variants.
A functional cell-based assay exposes cells expressing the relevant receptor to a series of peptide concentrations and measures the downstream response. For GLP-family agonists, that is commonly cAMP production. The resulting dose-response curve can provide values such as EC50 and Emax, or relative potency against a properly characterised reference.
ELISA or SPR, which were also suggested during the discussion, could provide information about antibody recognition or receptor binding. However, binding isn’t necessarily the same as receptor activation. A molecule may still bind while producing a weaker downstream response, which is why a functional cAMP assay answers a different question.
For retatrutide, one receptor wouldn’t be enough. It was designed as a triple agonist at the GIP, GLP-1 and glucagon receptors, and its original characterisation included functional assays at all three. Coskun et al., Cell Metabolism
That assay wouldn’t tell us how much weight a person will lose, whether they will experience side effects or whether they will respond at all. Those are clinical questions. It would answer the narrower question; does this sample activate the intended receptors, and how does its in-vitro activity compare with a reference?
Pacific Coast Biologics made that distinction themselves when they explained that their scientists use what they described as ED50 data and perform in-vitro biological assays for recombinant proteins. They estimated that a bioassay costs between $1,500 and $1,800, which helps explain why it isn’t part of routine grey-market testing.
A bioassay isn’t automatically definitive simply because it’s biological. It requires an appropriate receptor system, suitable controls, a properly characterised reference and a validated method. For a multi-receptor drug such as retatrutide, testing one receptor would provide only part of the answer. A result would also apply directly to the submitted sample, not automatically to every vial sold under the same batch number.
They later pointed out that human efficacy requires clinical pharmacology and clinical studies. In-vitro potency and human clinical effectiveness aren’t interchangeable. Their own reference to biological dose-response data shows the distinction: a laboratory can measure an in-vitro response without claiming that it predicts what will happen in a person.
Chromate also said potency is ultimately measured in standard mass units during clinical trials. Clinical doses are certainly expressed in milligrams, but dose and potency aren’t synonyms. Mass tells us how much material is present or administered; a functional assay measures the response produced across a range of concentrations. For an established synthetic peptide, mass can be accepted as the routine control when the link between structure, quantity and activity has already been adequately justified. That doesn’t make mass itself a direct measurement of receptor activity.
What Pharmaceutical Tirzepatide Testing Looks Like
Approved tirzepatide provides a useful reality check because its regulatory assessment shows what sits behind a pharmaceutical product. The EMA assessment for Mounjaro describes extensive structural characterisation using complementary methods including LC-MS/MS, peptide mapping, chiral analysis, NMR and circular dichroism. Cell-based bioassays were also used, and the active-substance specification included one as an identification test. The amount was assayed by RP-LC-UV, while purity was assessed by RP-LC-UV and RP-LC-MS.
The routine finished-product specification didn’t list a cell-based bioassay. That doesn’t mean Lilly simply assumed the product worked because one chromatogram looked clean. It means routine release testing was backed by extensive development, reference standards, process validation, structural and biological characterisation, stability studies and manufacturing history. EMA: Mounjaro assessment report
That background is not equivalent to receiving a grey-market report containing an HPLC purity percentage and a measured vial quantity.
Then Came the House Key
Chromate eventually compared tirzepatide with a simple house key. If you have a good copy of the key, he said, you can be certain it will unlock the house. If the lock is broken, that is bad news but not the key’s fault. He contrasted tirzepatide with more structurally complex biological molecules for which a bioassay may provide more useful information.
There is a reasonable scientific point buried inside the analogy. Tirzepatide is a defined synthetic peptide, so expected activity can sometimes be inferred from comprehensive structural and physicochemical characterisation with greater confidence than it can for more complex molecules.
But calling it a “good copy” assumes the very thing under discussion. What testing established that it really was a good copy, and was its ability to turn the biological lock measured or predicted from its structure?
Is the Lock Really Broken?
Individual response to GLP-1 medication does vary, even when the product is regulated and its quality has already been established. In the STEP 1 trial, participants receiving semaglutide lost an average of 14.9% of their body weight. However, 32% lost at least 20%, while approximately 14% failed to reach 5%. The same regulated medication produced dramatically different outcomes. Wilding et al., New England Journal of Medicine
Some of this variation may be genetic. A 2026 study involving nearly 28,000 GLP-1 users identified a variant in GLP1R, the gene encoding the receptor targeted by these drugs. Each copy was associated with approximately 0.76 kg of additional weight loss. Variants around GLP1R were also associated with nausea and vomiting, suggesting that greater weight loss and gastrointestinal side effects may share some of the same underlying biology.
A separate variant in GIPR was associated with vomiting among tirzepatide users but not semaglutide users, which makes sense because tirzepatide acts on the GIP receptor whereas semaglutide does not. Importantly, that GIPR variant was not associated with weight loss. Su et al., Nature
Other genetic studies have identified differences elsewhere in the GLP-1 pathway, but they shouldn’t all be presented as explanations for weight-loss nonresponse. Variants in ARRB1 may affect how GLP-1 receptors are recycled back to the surface of insulin-producing pancreatic cells, but that study measured changes in HbA1c and found no association with weight loss. Mari et al., The Lancet Diabetes & Endocrinology
Research involving reduced-function variants in the PAM gene has provided stronger evidence of GLP-1 resistance. Carriers of one variant had reduced sensitivity to their natural GLP-1 and experienced a smaller improvement in HbA1c when treated with GLP-1 receptor agonists. Around one in ten people may carry a reduced-function PAM variant, but the study investigated blood-sugar control rather than weight loss. It doesn’t establish that one in ten people are resistant to the weight-loss effects of these drugs. Umapathysivam et al., Genome Medicine
The Nature researchers’ model included genetics alongside sex, age, diabetes status, drug, dose and treatment duration. Together, these factors explained only around 25% of the variation in weight loss, with most of that contribution coming from non-genetic factors. Approximately three-quarters remained unexplained.
The “lock” may therefore vary in sensitivity, receptor availability and downstream response, but describing it as simply broken goes far beyond the evidence. Clinical response is produced by the interaction of product activity, dose, exposure, treatment duration, adherence, tolerability and individual biology. Poor weight loss cannot prove that the product was inactive, but it cannot prove that the product was fully potent either.
A customer’s weight loss is not a bioassay.
What Can We Honestly Conclude?
This doesn’t mean every grey-market vial needs an expensive bioassay. It means only that a 99% purity result is not a 99% potency result. For a well-understood synthetic peptide, comprehensive and validated physicochemical testing may still provide very strong evidence of expected biological activity, and current regulatory guidance allows routine potency assays to be omitted in justified circumstances.
If no functional assay was performed, then functional potency wasn’t directly measured. It was inferred from evidence that the sample contained the correct molecule, in the claimed amount and an acceptable condition. That inference may be scientifically strong or weak depending on the molecule, the methods, the reference material and how much characterisation was actually performed.
No posts
Comments
Nothing yet. Say the first thing.
Sign in to join the conversation.