
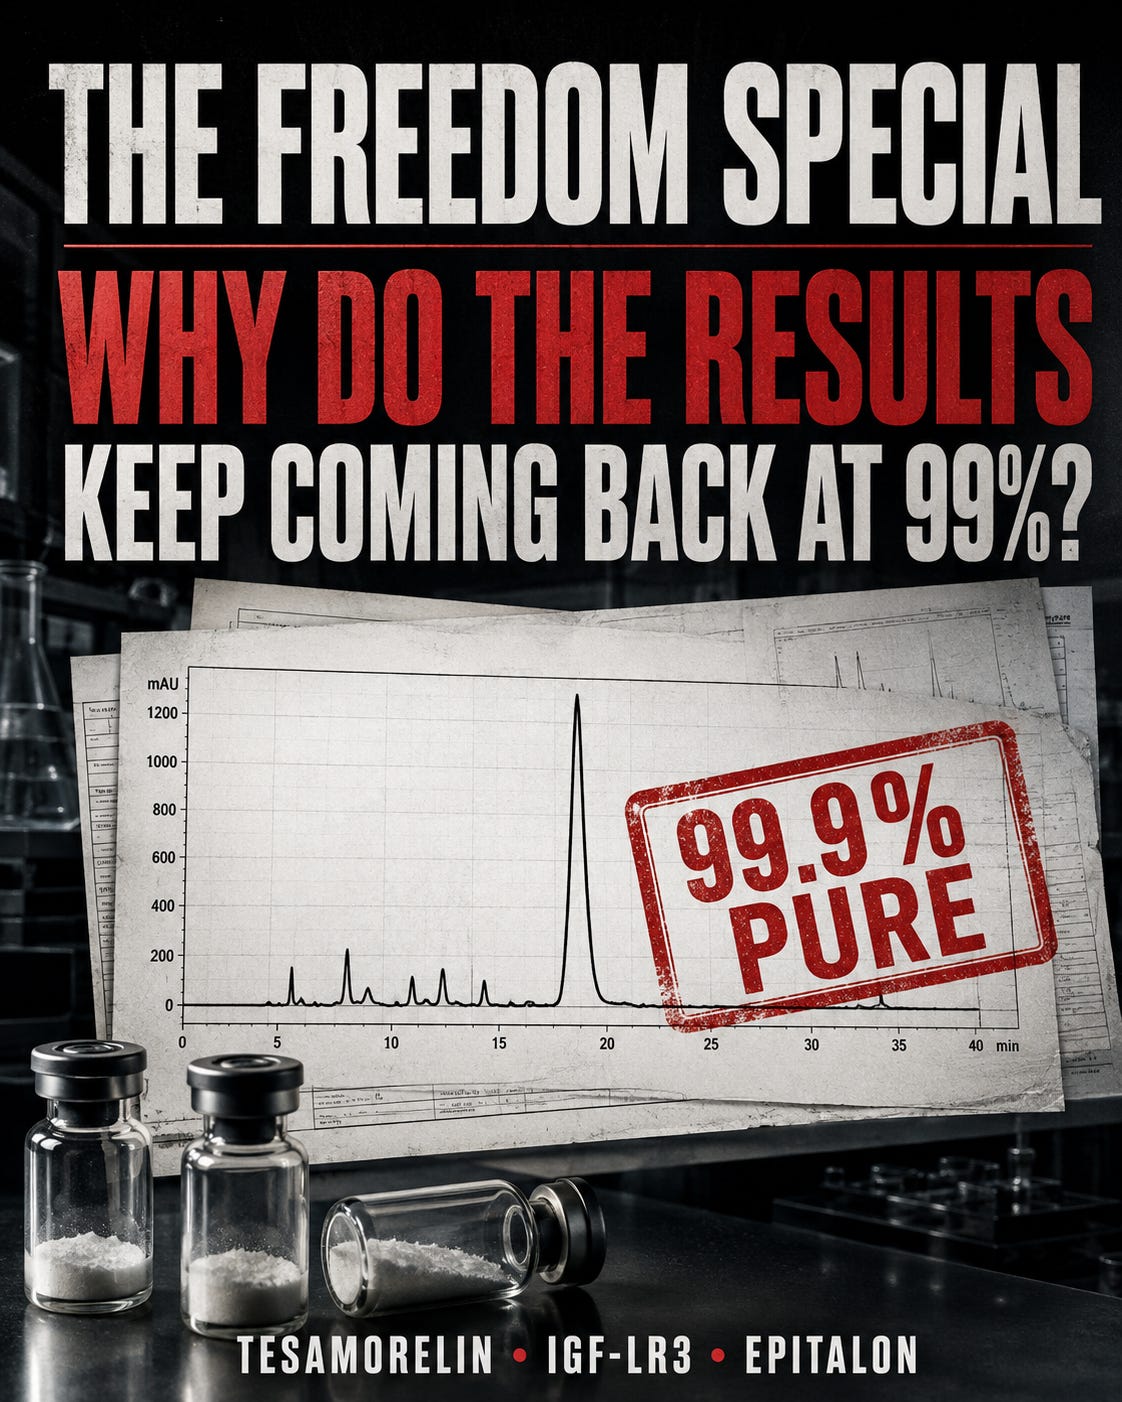
Another day, another 99% plus purity result from Freedom. This time, however, the questions aren’t limited to two laboratories testing different vials and producing different numbers. Some of the problems are visible on Freedom Diagnostics’ own reports.
The discussion began with a Nexaph batch of tesamorelin tested by both Freedom and Janoshik. It then widened when an older Freedom IGF-LR3 report appeared, showing several peaks immediately before the main peak while still declaring 99.79% purity.
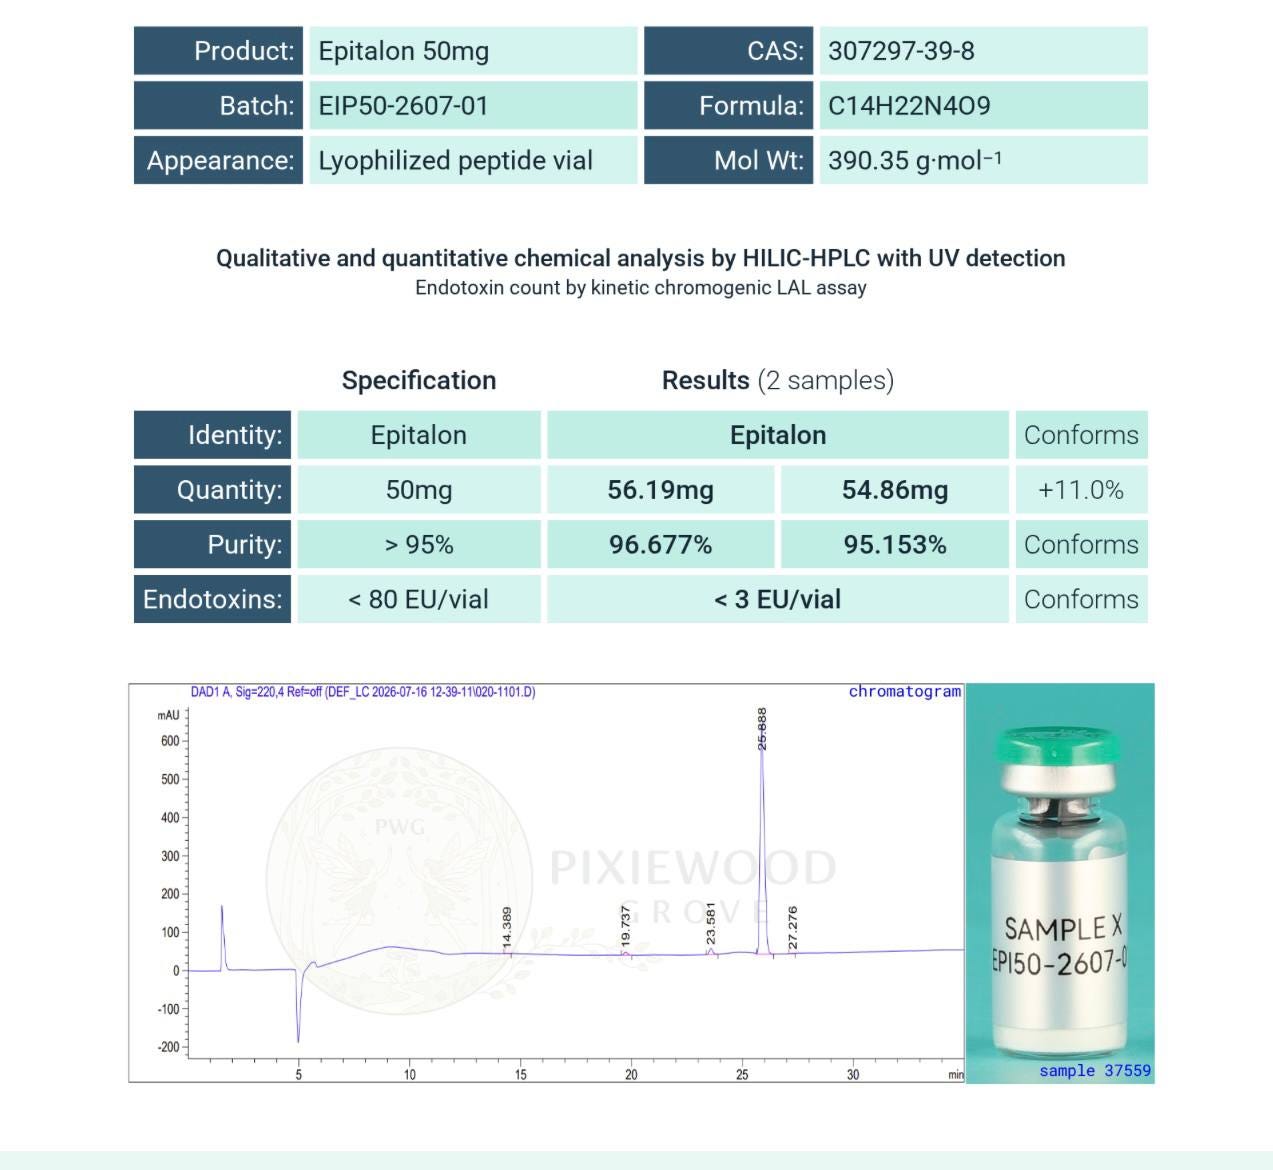
Then came Epitalon. Freedom reported two vials from the same batch at 99.96% and 99.91%, while Chromate found 96.677% and 95.153% using HILIC-HPLC. Accumark reported 99.27%, but measured an extraordinary average of 83.64 mg across two nominally 50 mg vials.
One questionable result might be dismissed as an unexplained exclusion or a different vial. Three products showing the same pattern begin to look like a problem with how Freedom is separating, integrating and reporting impurities.
The Tesamorelin Discrepancy
Both laboratories tested vials carrying the same Nexaph batch number: TES1007182026-21
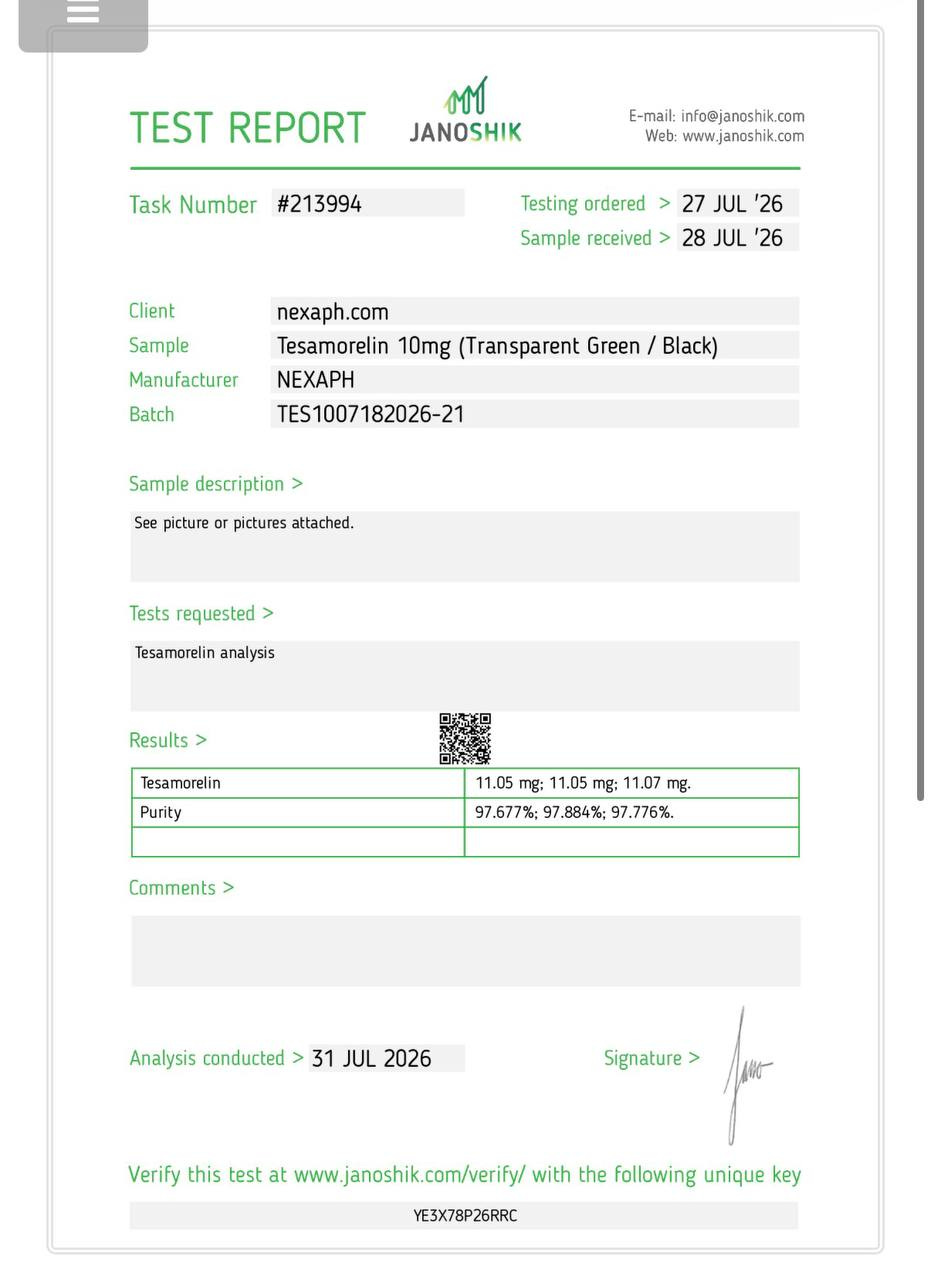
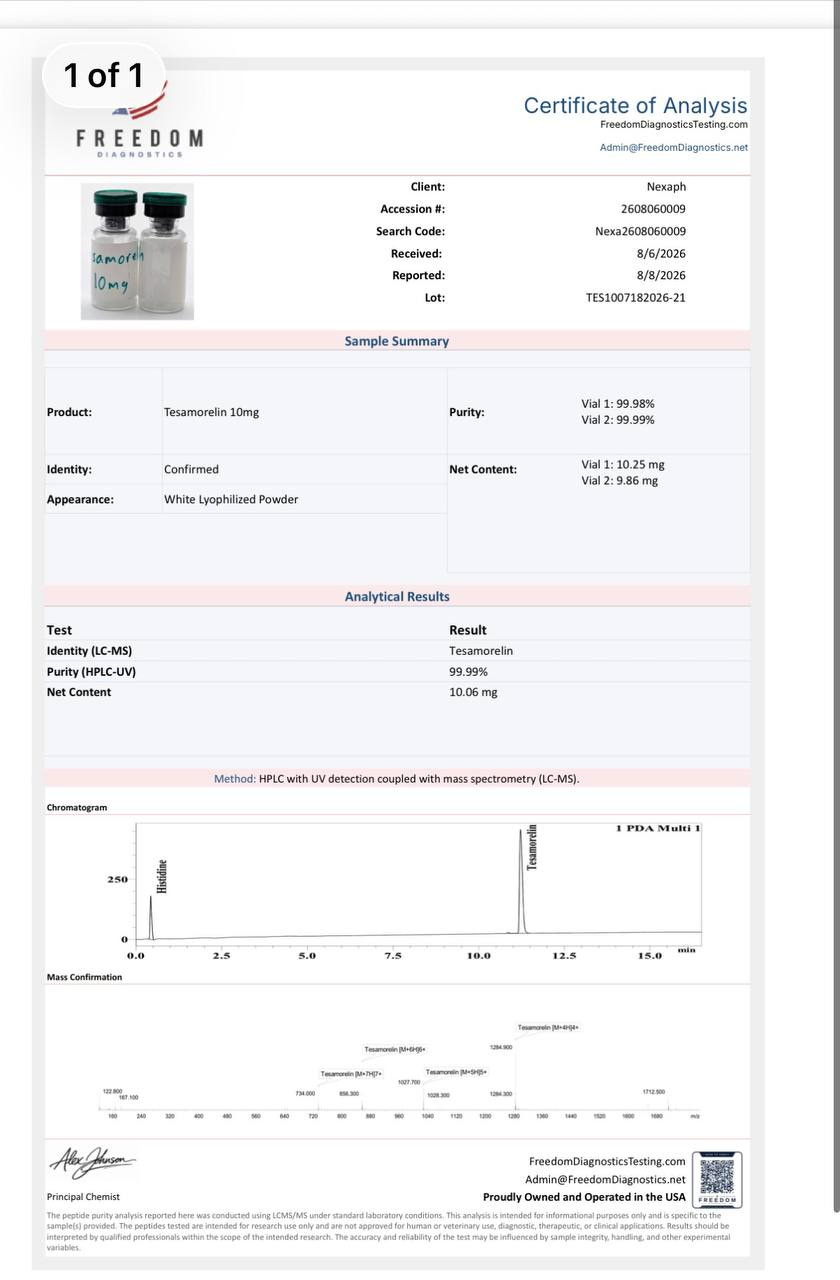
Freedom’s average result was 99.985% purity and 10.055 mg. Janoshik’s average was 97.779% and 11.057 mg. That’s a difference of approximately 2.21 percentage points in purity and 1 mg in content.
The purity difference is more dramatic than it first appears. Freedom’s results imply an average of approximately 0.015% included impurities, while Janoshik’s results imply approximately 2.221%. That’s around a 148-fold difference in the amount of apparent impurity being reported.
These were different physical vials, so poor batch uniformity could contribute to the content difference. Freedom’s own two vials differed by 0.39 mg, while Janoshik’s three measurements were grouped within 0.02 mg. Vial variation doesn’t, however, explain what appeared on Freedom’s chromatogram.
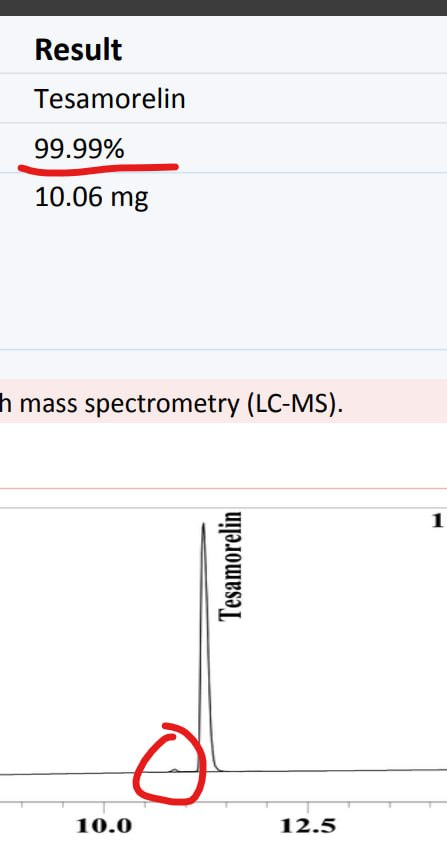
Immediately before the main tesamorelin peak is a small but visible additional peak. Dustin from Vanguard said his laboratory sees the same peak regularly in tesamorelin and includes it when reporting lower purity. Janoshik also questioned why it had apparently not been included.
The chromatogram raises a legitimate question: how did a visible pre-peak produce a result claiming that only 0.01–0.02% of the included chromatographic area was anything other than tesamorelin? Freedom’s report doesn’t provide the peak-area table, integration boundaries or explanation needed to answer that. It also reports results for two separate vials but displays only one chromatogram. There’s no indication of which vial it represents or whether the same pre-peak appeared in both.
Then Came the IGF-LR3 Report
The second example is even harder to ignore.
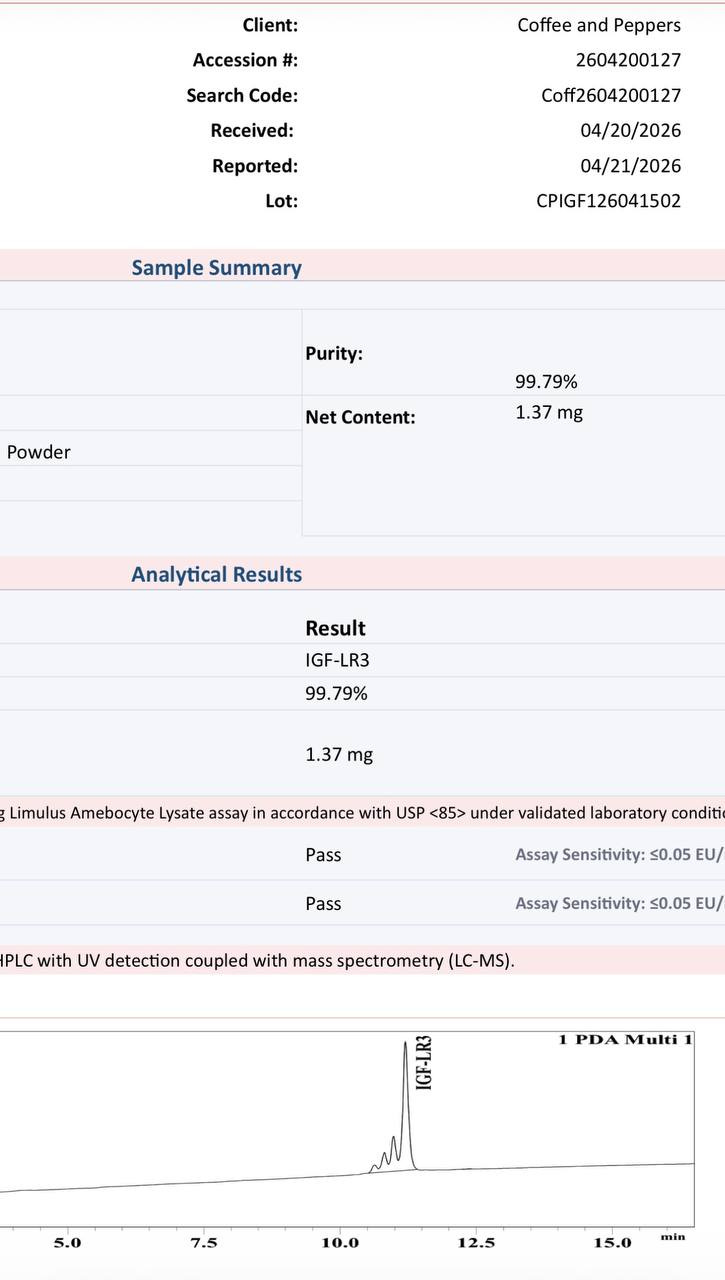
A Freedom report for lot CPIGF126041502 declared:
Identity: IGF-LR3
Content: 1.37 mg
Purity: 99.79%
Its own chromatogram shows a cluster of several visible peaks and shoulders immediately before the labelled IGF-LR3 peak. A result of 99.79% leaves only 0.21% of the included area for every other component combined. The visible cluster appears difficult to reconcile with that figure if those peaks came from the sample and should have been integrated as impurities. Unlike the tesamorelin case, there’s no second lab result for this IGF-LR3 batch. This isn’t a cross-laboratory discrepancy. It’s a question about the apparent consistency of Freedom’s own report.
What are those peaks?
Were they integrated?
Were they excluded?
If they were excluded, what were they identified as and what evidence justified removing them from the purity calculation? None of that information appears on the report.
A Visible Peak Is Not Automatically an Impurity
There is an important qualification. Not every peak appearing on a chromatogram should automatically reduce the peptide purity. Peaks caused by solvents, reagents, the mobile phase, excipients, the sample matrix or an internal standard may be legitimately excluded. Freedom’s tesamorelin chromatogram, for example, contains a large early peak labelled histidine. If histidine was deliberately used as an excipient (which it was in this case), excluding it from the peptide-related purity calculation may be completely reasonable. The disputed peaks are the features immediately beside the peptides being measured.
Official EDQM chromatography guidance allows peaks from solvents, reagents, the mobile phase or sample matrix to be disregarded. It also explains that area-normalised purity is calculated from the peaks that the method decides to report. This is precisely why the missing information is so important. A lab can’t simply display unexplained peaks, publish a near-perfect purity figure and leave everyone else to guess what was removed from the calculation.
Peak height is also not the same as peak area, so the true percentage cannot be calculated from these screenshots. The images raise the question but the raw integration data is needed to answer it.
Mass Confirmation Does Not Answer the Purity Question
Freedom states that it uses HPLC with UV detection coupled with mass spectrometry. Mass confirmation provides stronger evidence that the main peak contains the expected peptide. It doesn’t automatically identify every nearby peak, prove that those peaks should be excluded or validate the reported purity percentage. To resolve the dispute, Freedom would need to provide the mass spectra taken at the retention times of the additional peaks, not merely a spectrum confirming the main peptide.
One Epitalon Batch, Three Different Answers
The most striking example isn’t the tesamorelin result. It’s an Epitalon batch tested by Freedom, Accumark and Chromate, which produced three completely different pictures of what was supposedly inside the same product.
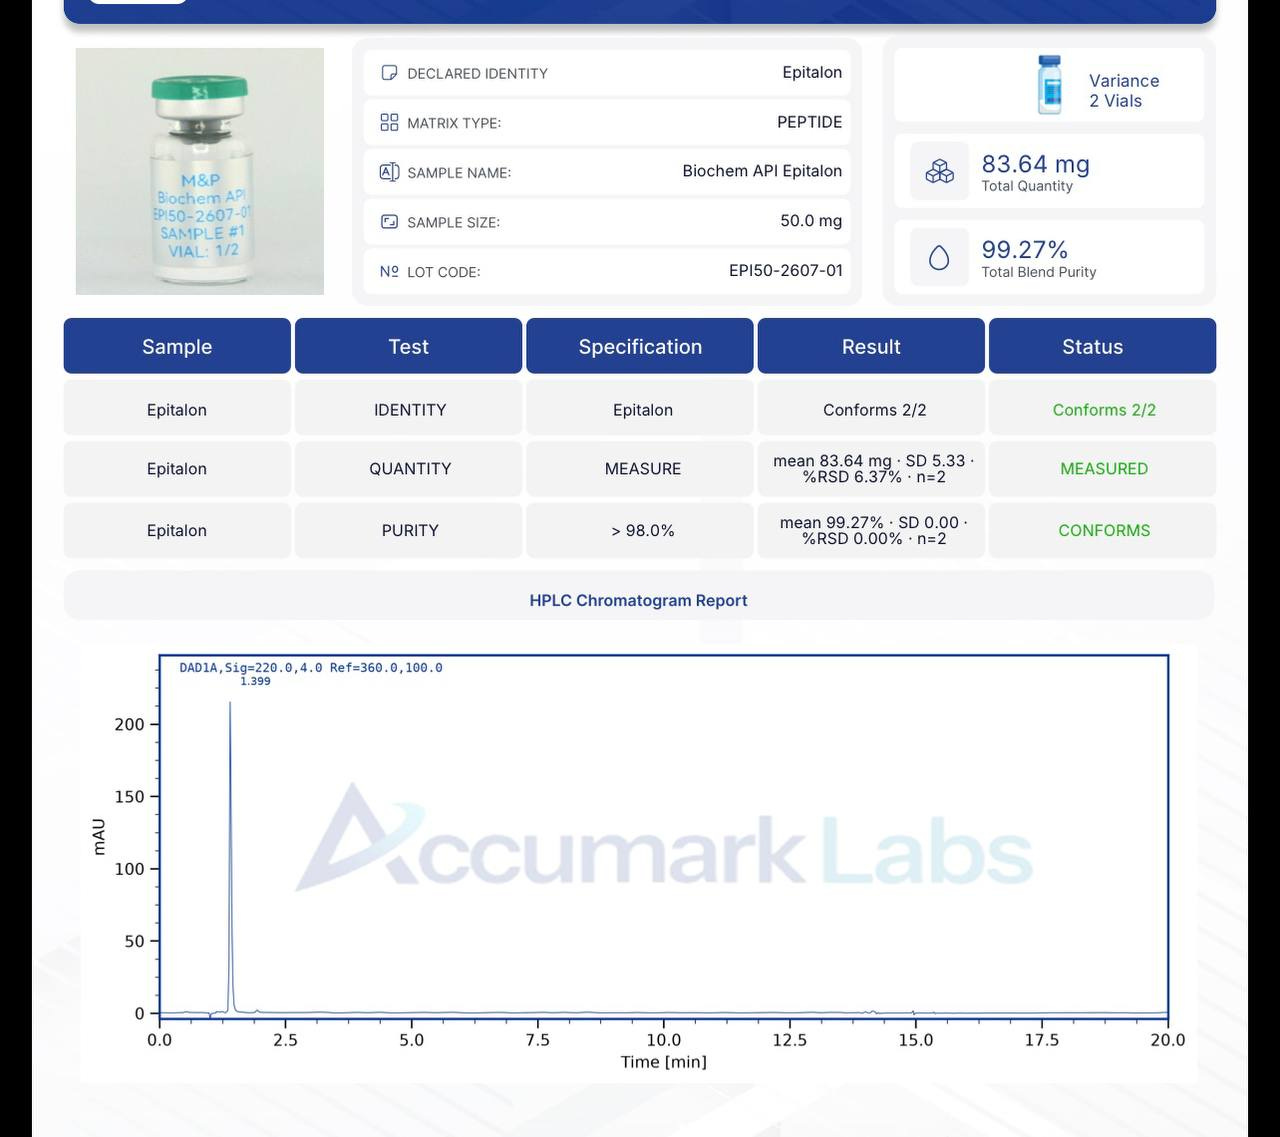
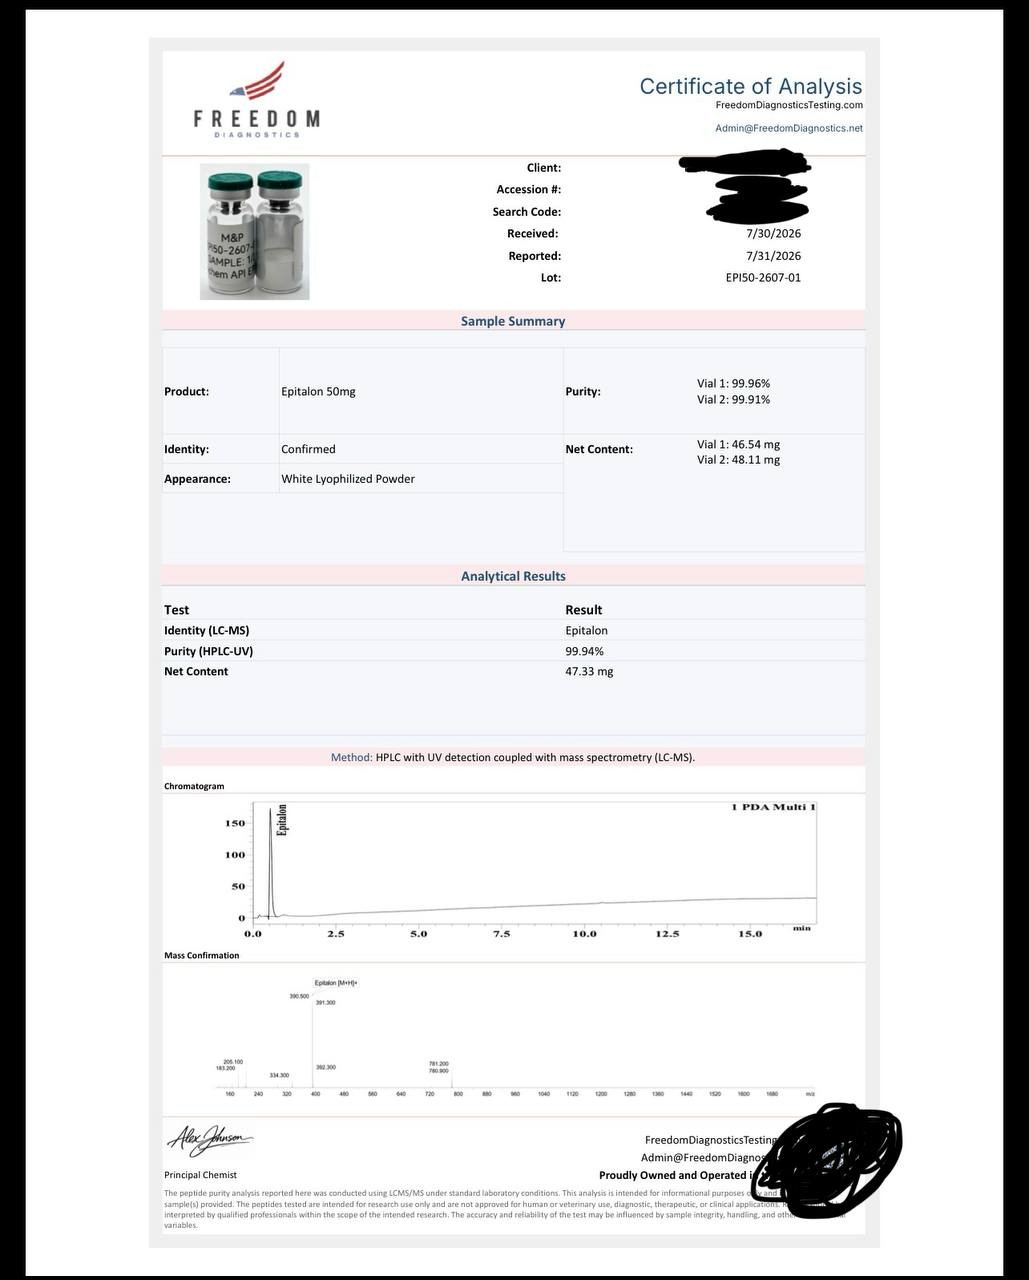
Freedom’s average was 99.935% purity and 47.325 mg.
Chromate’s average was 95.915% purity and 55.525 mg.
That is a difference of just over 4% points in purity and 8.2 mg in measured quantity. Freedom’s result implies approximately 0.065% impurities, while Chromate’s implies approximately 4.085%, around 63 times more apparent impurity.
Accumark created another problem entirely. Its report gives a mean quantity of 83.64 mg across two nominally 50 mg vials, nearly 77% above Freedom’s average and around 51% above Chromate’s. These were different physical vials, so batch variation remains possible. However, each laboratory tested two vials, making it increasingly difficult to dismiss the entire disagreement as one random bad fill. Either this batch was extraordinarily inconsistent or the laboratories weren’t measuring it in comparable ways.
The Chromatograms Explain Why
Freedom’s Epitalon peak appears extremely early in the chromatogram, close to the beginning of the run. Accumark’s dominant peak appears at approximately 1.399 minutes.
Chromate used HILIC-HPLC and retained the main Epitalon peak until approximately 25.9 minutes, with several smaller components visibly separated before and after it. A later retention time doesn’t automatically make a result correct. What matters is whether the method can retain Epitalon and separate it from structurally related impurities.
Epitalon is a very small and highly polar tetrapeptide. This creates difficulties for conventional reversed-phase HPLC because the peptide and its related impurities may be poorly retained or may leave the column close together. When that happens, several components can appear as one dominant peak and produce an impressive purity result. The impurities haven’t necessarily disappeared, its just that the method may simply have failed to separate them.
Janoshik also uses RP-HPLC for Epitalon. Janoshik’s argument wasn’t that RP-HPLC can’t produce an accurate result, but that any laboratory using it must validate that its method retains Epitalon and separates its common impurities. He said HILIC was better suited to the compound but doubted that Freedom and Accumark had demonstrated adequate separation with their methods.
This is the same disagreement seen in the earlier Epitalon lab debate (article linked below). Chromate argued that HILIC was required, while Janoshik and Vanguard maintained that a properly developed and validated RP-HPLC method could produce comparable results.
The issue isn’t simply which type of chromatography was used. It’s whether the chosen method retained Epitalon long enough to separate it from its impurities. Freedom and Accumark need to demonstrate that their methods can do this, but their reports don’t provide that evidence.
The Missing Epitalon Peak
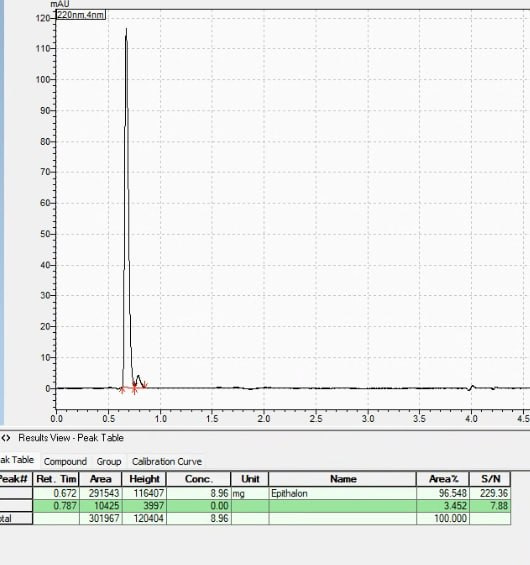
A separate RP-HPLC chromatogram was shared by Janoshik during the discussion showing;
Epitalon main peak: 96.548%
Second integrated peak: 3.452%
Total: 100%
The second peak was given a concentration of 0.00 mg, but that didn’t mean it was absent. It meant the unidentified component hadn’t been quantified using the Epitalon calibration. Its chromatographic area was still included when calculating purity.
This demonstrates the difference between detecting a component and being able to quantify it in milligrams. The laboratory couldn’t say how much of the unidentified substance was present by weight, but it still counted its contribution to the chromatogram. Once that second component was separated and included, the reported purity was approximately 96.5% rather than 99%.
That doesn’t prove Freedom or Accumark produced the wrong result, nor does it identify the second peak. It does show how a method that separates an additional component can produce a substantially lower purity figure. If a similar component was merged into Freedom’s main Epitalon peak or excluded from its calculation, that could help explain its 99.94% result.
If Freedom identified the feature as something that should legitimately be excluded, it should be able to show that. Without its peak table, integration boundaries and Epitalon-specific validation data, there is no way to tell whether Freedom found a cleaner sample or simply counted less of what was present.
No posts
Comments
Nothing yet. Say the first thing.
Sign in to join the conversation.