
This is my first time making a Running Back model in a good few years believe it or not! I have been doing this for a while and usually focus on WR and TE because they are more fun. You can see my R^2 later and read up on all the custom variables I created for the model.
For the past eight seasons, I have been obsessed with predicting NFL outcomes given college production, metrics, and athleticism data. In 2026, it is clear that we have more information than ever and parsing out what to pay attention to can be difficult. Unlike most other platforms who have been around for a few seasons, PFF’s deep history of collecting data at both the college and NFL level since 2014 allows us endless possibilities to create statistically robust models.
This article is going to focus on my 2026 running back model and predicting future NFL success for 2026 rookies given their college production, athleticism, and PFF grades. I will be defining future NFL success for this article as the average fantasy points per game in a player’s first three seasons.
We are going to limit our sample to any player who takes a snap in the NFL or is drafted; I consider these NFL caliber players. To me this is a reasonable filter to have a healthy sample of players for our model to learn and intuitive enough to make practical sense.
This model utilizes a tuned Elastic Net regression to forecast three-year fantasy production by analyzing deep-level interactions between PFF grades, RAS, and collegiate production metrics. By cross-validating across multiple draft classes, the algorithm identifies the optimal balance of variables to isolate the stickiest indicators of NFL success.
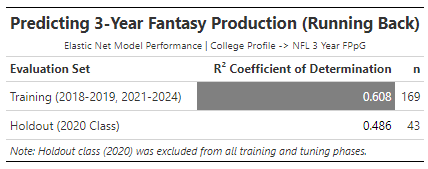
^ For the nerds, I chose 2020 as it seemed like a fair choice to not tank or rapidly improve the training R^2 and validation wasn’t a big dropoff. because the sample sizes are so small, the validation/holdout can vary by a lot. For instance, if i move my holdout to 2022, the R^2 is like a .62 and it didn’t feel fair to advertise that as it would seem suspiciously high imo.
As opposed to the wide receiver or tight end position, running back production is deeply intertwined with a running back’s explosiveness. It is very possible for a receiver to excel at producing by simply getting open as opposed to avoiding tackles and creating YAC opportunities. It is far more difficult for a running back to create yards without being explosive. The main metric I want to discuss is my custom rushing yards over expectation (RYOE).
note: I wrote more about the overall production scores used in the model here
The first time I saw RYOE being used was by Next Gen Stats five to six years ago. The basic premise is that any given play has an expectation of rushing yards based on many different factors. We can calculate the difference between that expectation and what actually happened. This difference is RYOE. If RYOE is positive, it means the running back earned more yards in that situation than an average running back would have. If RYOE is negative, it means that the running back earned less yards than an average running back would have.
My custom RYOE involves six key variables:
Offensive Formation
Defensive Formation
Offensive line PFF Grade
Opponent’s team run defense PFF grade
Opponent conference strength (custom metric)
Conference mismatch (custom metric)
These variables are used in conjunction with more standard variables like yard line, down, distance, etc and trained with an Elastic Net model to create an expected rushing yards metric. We then simply look at the difference between what actually happened and our expectation. What really makes this RYOE different is its emphasis on competition.
For example, when Ashton Jeanty dominates a top tier Power 4 team like Oregon while playing for Boise State, we should heavily reward him. Conversely, if a Power 4 RB struggles to gain yards against a team from the MAC, how can we expect him to succeed at the NFL level?
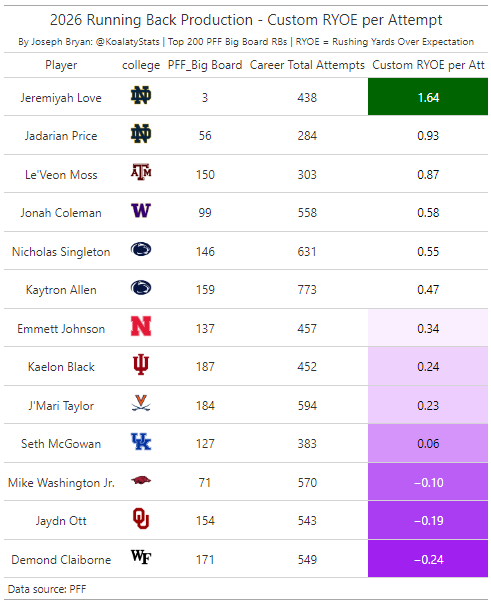
Jeremiah Love is the only player in this draft class with a custom RYOE per attempt above a 1.00. For reference, last year’s class had six and not a single running back in the top 200 of the PFF big board was negative. Love would be an elite prospect in any draft class, but this year he truly stands out.
Mike Washington Jr. has made some very positive noise this offseason given his outstanding athleticism that we will review later. However, his college production was not as special. Since 2018 there have been 52 running backs in PFFs top 100 Big Board. Mike Washington Jr. ranks 51 in RYOE per attempt from that group. Only three of the 52 have a negative RYOE: Ray Davis (-0.01), Mike Washington Jr. (-0.10), and David Montgomery (-0.18).
I cover: PFF Grades + PFF Wins Above Average as well as Game Athleticism Scores and the models overall final prediction below this wall.
I am but one guy with a long history of modeling players. I charge less than $5 a month.
Comments
Nothing yet. Say the first thing.
Sign in to join the conversation.