
Welcome to the Metabolic Insight monthly roundup!
In this series, I summarise interesting studies from the previous month and, sometimes, older studies from “the archive”.
This newsletter includes a look at three studies spanning protein metabolism, food nutrition labels, and the ongoing debate in metabolism of whether total daily energy expenditure is constrained or compensated with physical activity.
Low-fat ground pork stimulates post-exercise muscle protein synthesis to a greater extent than high-fat ground pork
“Poor”, “Fair”, “Good”, “Better”, “Best” food labels lead to healthier shopping baskets
Physical activity is associated with total daily energy expenditure: support for the additive model
New study: Ingestion of a lipid-rich meat matrix blunts the postexercise increase of myofibrillar protein synthesis rates in healthy adults: a randomized controlled trial – available here.
I enjoyed reading this new study from Zupanic and colleagues that examines the role of the food matrix in stimulating muscle protein synthesis (MPS).
For those new to the food matrix, it refers to the interaction between nutrients (proteins, carbs, fats, and micronutrients etc.) and non-nutrient components (the foods physical structure). These affect how the food is digested, absorbed, and the metabolic activity of the food-derived amino acids.
This interesting area of research has shown that whole milk, with its lipid-rich matrix, stimulates MPS more than an equivalent protein amount from skimmed milk. We also see this effect in whole eggs vs egg whites, suggesting that non-protein nutrients can amplify the muscle anabolic response.
Could the lipid-rich matrix in meat do the same?
To test this, the researchers put young, healthy adults through a bout of resistance exercise: 4 x 10 repetitions at 90% of 10RM for leg press and leg extension. After this they immediately consumed either:
20g protein from low-fat ground pork (120 kcals)
20g protein from high-fat ground pork (266 kcals)
73g carbs from Gatorade (266 kcals)
*The carbohydrate group served as a calorie-matched control for the high-fat condition.
Participants received a continuous intravenous infusion of stable isotope-labelled phenylalanine (an essential amino acid) and underwent 2 or 3 quadriceps muscle biopsies; standard methods to measure acute MPS.
Contrary to the researcher’s initial hypothesis, low-fat pork caused the highest post-exercise MPS response.
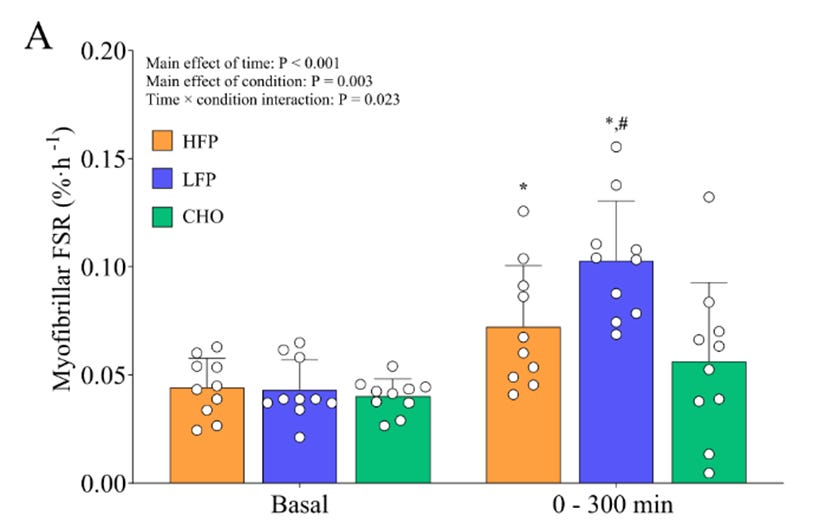
The best explanation is the rate of essential amino acid (EAA) digestion, absorption, and appearance in the systemic circulation. EAAs are responsible for triggering MPS, and higher concentrations in the plasma are mostly *but not always* predictive of stronger MPS responses.
Low-fat pork intake led to higher post-meal EAA and leucine concentrations, termed aminoacidemia. When assessed across all groups, there was a moderate positive relationship between the maximal plasma EAA concentration (Cmax) and the change in MPS.
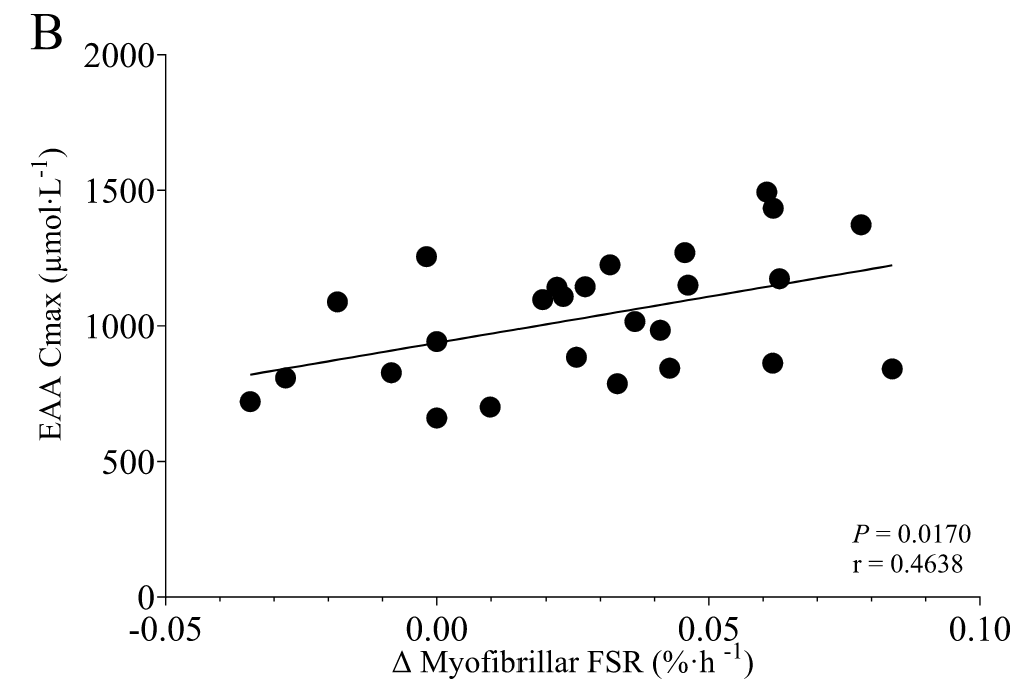
It is not that the high-fat pork amino acids were not absorbed; they were. Instead the fat content slowed digestion and gastric emptying causing a more gradual plasma EAA response with a lower peak concentration.
Another explanation is the physical structure of the food matrix. For whole milk and whole eggs, the food matrix is naturally formed, and proteins are intertwined with lipid-rich bioactive components. However, the pork meat matrix was created by blending lean and fat trimmings together to achieve a specific composition. In this sense, we might think of the pork protein as being co-ingested with lipids rather than encased as part of its native food matrix.
I am not sure how this difference in structure could influence MPS, but we should not rule it out as a possible factor. Each food matrix is unique, and simple heuristics like “lipid rich matrix amplifies MPS” cannot be used for all foods.
In the context of a whole diet, total protein intake across the day is the most important variable for MPS and muscle growth over time. However, this study does show that the amino acids in low-fat pork were more effective at being incorporated into muscle proteins compared with the high-fat pork. In situations of lower protein intakes or over long periods of time, these acute metabolic mechanisms may compound into improvements in muscle mass, strength, and physical function.
Full study available here.
New study: Nutrition info and other front-of-package labels and simulated food and beverage purchases – available here.
This inventive study caught my eye during a long Thanksgiving weekend drive home.
It gets at a very simple question. Can changing the front-of-package food label influence the foods and drinks people buy?
Policymakers have called for front-of-package food labels that interpret the products healthfulness, moving beyond the standard Nutrition Facts label with calorie and macronutrient numbers. Current front-of-package labels show whether the product contains low, medium, or high amounts of saturated fat, sodium, and added sugar. As nutrients of concern, lower is deemed *better*.
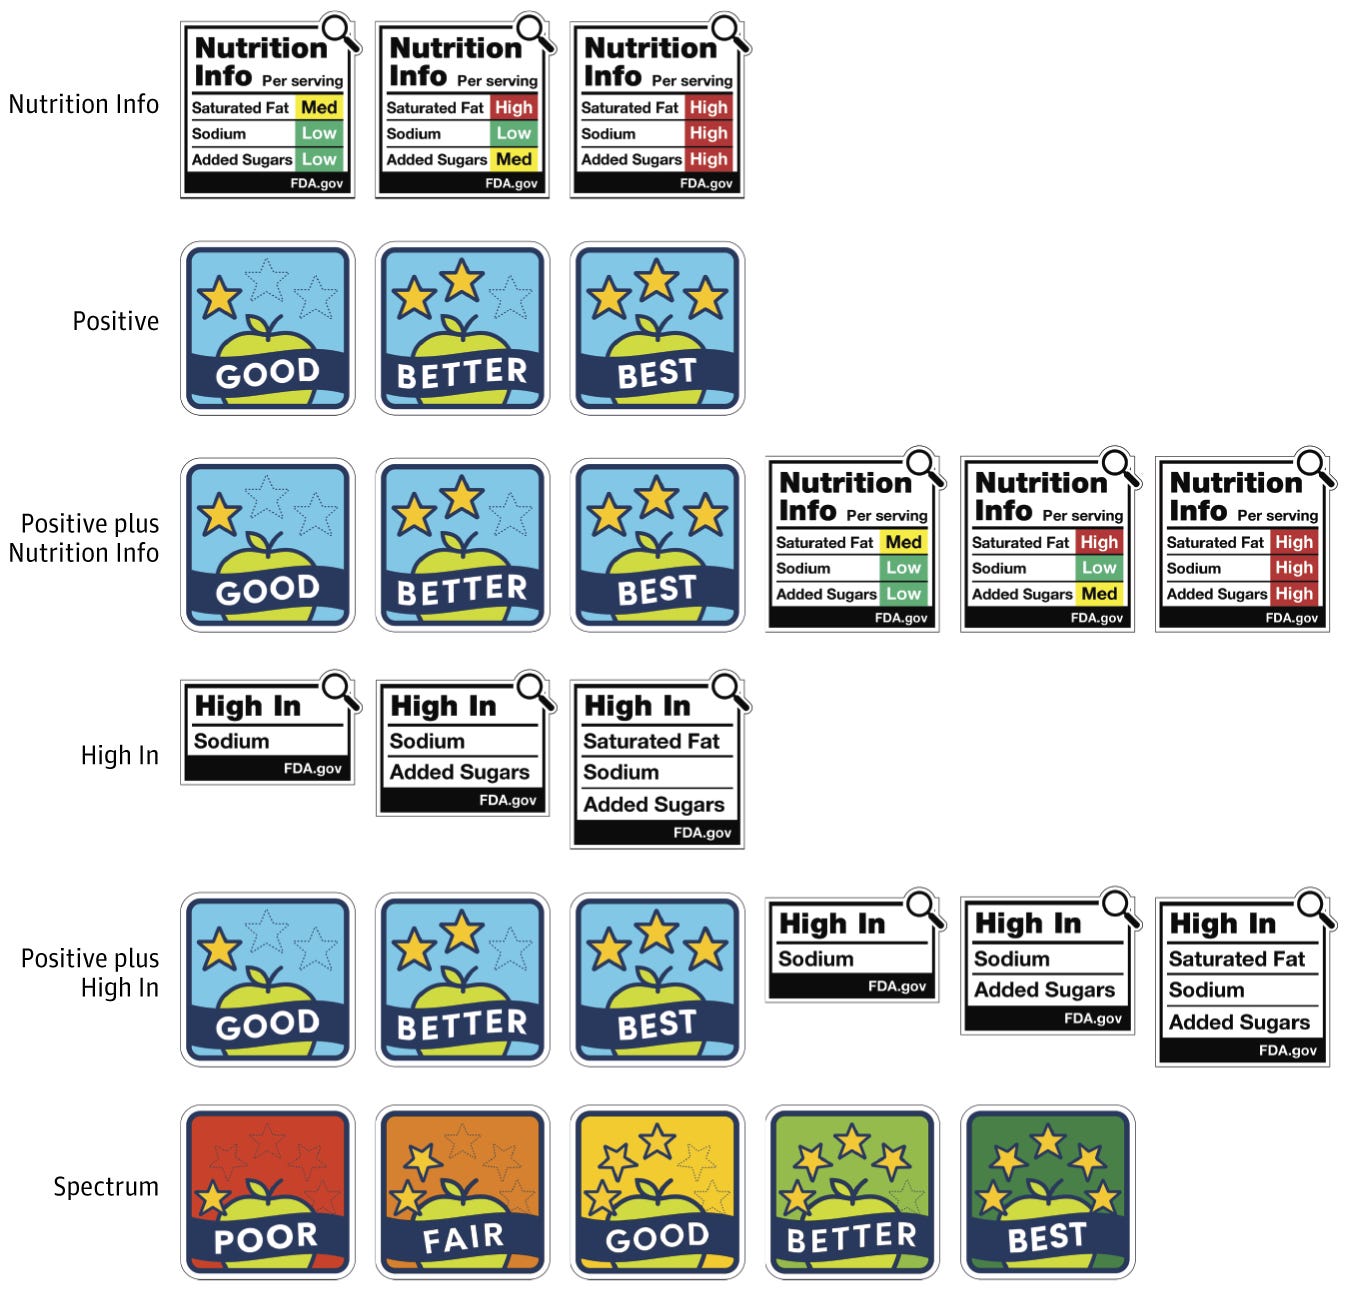
Building upon this, the researchers created a series of labels and tested whether they changed buying habits compared with positive “good”, “better”, “best” labels (used as the standard benchmark).
First, credit to the researchers, 5636 adults completed the study (~940 people per labelling group) including a wide range of ages, ethnicities, education levels, and household incomes. This is an excellent sample size that provides statistical power to detect between-group effects.
Participants completed their shopping in a simulated online grocery store with the look, feel, and functionalities of a normal supermarket website. To encourage normal shopping habits, they were assigned a budget of $35 and informed that 1 in 50 participants would receive their groceries (this was deception, they actually received a $35 gift card).
Over 5000 products were included in the store with their images, names, and prices and one of the six different front-of-package labels: positive, nutrition info, high in, positive + nutrition info, positive + high in, or spectrum (image above).
After completing their shop, food and drink selections were assessed using the UK’s Ofcom Nutrient Profiling Model. Direct from the study methods:
“Under this model, foods and beverages are scored as healthier when they have lower levels of calories, sugar, saturated fat, and sodium density, higher levels of fiber and protein density, and higher fruit, vegetable, nut, and legume content. People who eat diets with healthier Ofcom scores are less likely to develop cardiovascular disease and metabolic syndrome. We calculated Ofcom scores for all products in the store, converting scores to a scale of 0 to 100 such that higher scores indicated healthier selections.”
Nutrition science debates rage over what constitutes a healthy diet. My two-cents is that recommendations for an individual person may well be different from national-level population guidelines. In the context of this study, using the Ofcom model means higher scores align with healthier population dietary patterns.
Exposure to five of the six labels did not move the needle much (healthfulness scores 58.5 to 59.1 out of 100). But the spectrum labels displaying the “Poor”, “Fair”, “Good”, “Better”, “Best” language, led to a significantly higher healthfulness score compared with the other labels (score 60.9).
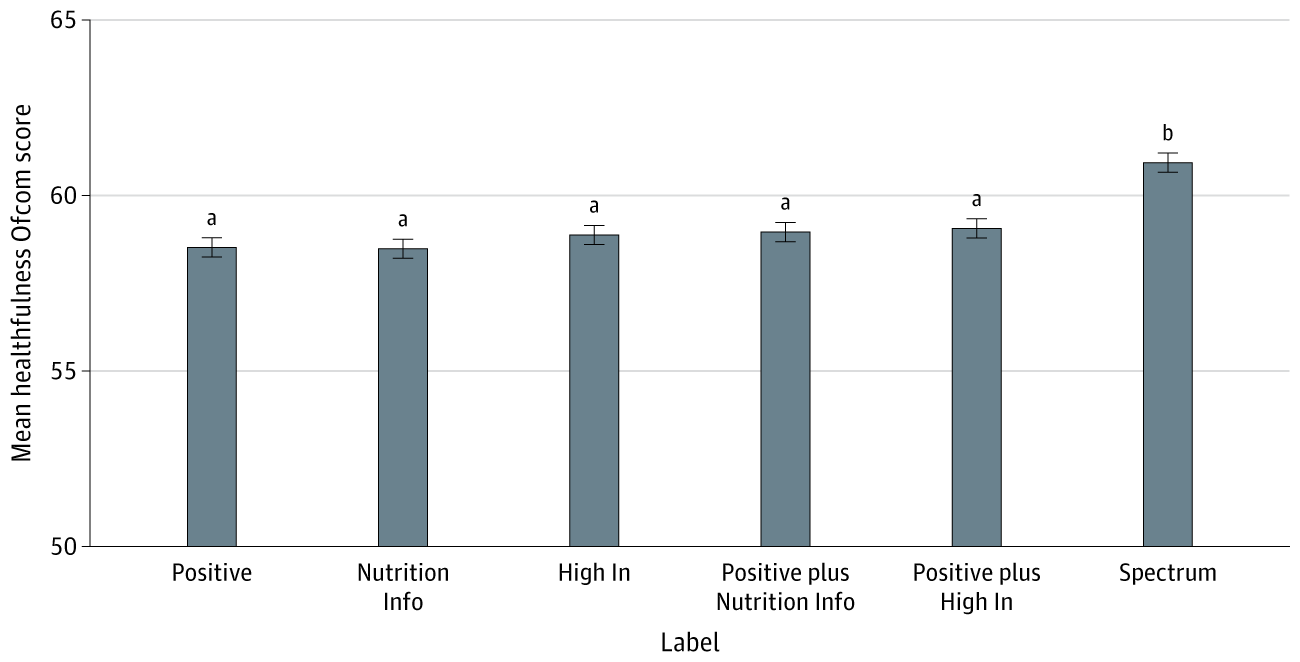
Improved scores came from higher fiber and protein, and lower calorie density, total sugar, saturated fat, and sodium choices. Results on the healthfulness across all groups were not affected by participant’s nutrition literacy, household income, or education level.
Why did spectrum labels perform best?
Perhaps the simple, intuitive descriptors, were easier to interpret than potentially conflicting information on other labels. Alternatively, spectrum labels appear effective because of a structural tautology; their grading system (for what constitutes poor, fair, good, better, and best) mirrors the nutrient- and ingredient density rules used in the Ofcom scoring method.
A 2-point increase in the Ofcom score is tiny, and it is debatable whether this translates into a meaningful effect on health outcomes. The authors address this by referencing epidemiological research that shows a 2-point increase is associated with a 14% lower risk of developing cardiovascular disease. But that association comes from long-term changes in dietary patterns, not a one-off behaviour in simulated shopping task.
To put the results in a broader context, I was surprised by how closely the healthfulness scores in this study (58.5 to 60.9 out of 100) match the US Healthy Eating Index scores for the general population (58 out of 100) which measure how well a diet aligns with the Dietary Guidelines for Americans. Improving population dietary patterns clearly remains an ongoing challenge for nutrition science.
Should we use spectrum labels?
Buried in the supplementary files (I read them, so you don’t have to) is Table e9, which contains survey results on participant’s reactions, perceptions, and support for the different labels. Spectrum labels were rated the lowest for perceived helpfulness, understandability, and trustworthiness. Creating a beautiful irony of the least popular label being potentially the most health-promoting.
Designing labels to show evidence-based health information suitable for a whole population is no easy task and I applaud the researchers for this study. Their results suggest to me that providing simple one-word descriptions creates a black box scenario that could disempower people: the juice is not worth the squeeze.
Full study available here.
New study: Physical activity is directly associated with total energy expenditure without evidence of constraint or compensation – available here.
Howard and colleagues added fuel to the fire of the ongoing debate on whether total daily energy expenditure (TDEE) is constrained or compensated in response to physical activity.
Introducing the *additive model* and the *constrained model* of TDEE.
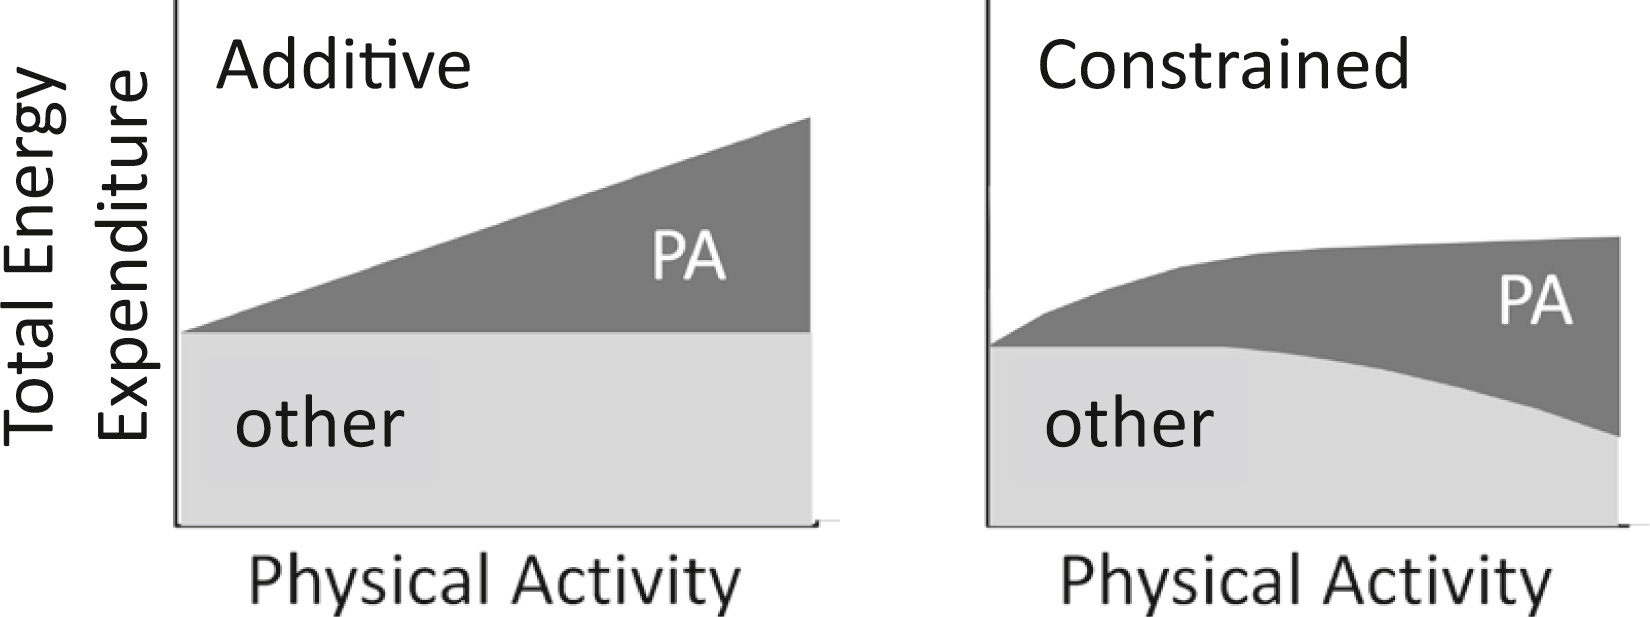
The *additive model* proposes that kcals burned from low-to-moderate physical activity linearly “add” to TDEE. We move more, we burn more.
In contrast, the *constrained model* proposes that there is eventually a plateau in TDEE; around 3000 kcals a day on average. After which additional physical activity energy expenditure is compensated by reduced energy expenditure from elsewhere, like reduced resting metabolic rate or non-exercise activity thermogenesis (a complicated term for general movements and fidgeting).
To investigate these models further, this study recruited 75 healthy weight-stable adults with a wide range of physical activity levels: from sedentary couch potatoes to ultra-endurance athletes. The most active participant self-reported walking and running 128.7 km per week!
They went about their normal daily business, exercising as much or as little as normal. Meanwhile energy expenditure was measured using the gold-standard doubly labeled water technique. This involves participants drinking water enriched with two stable isotope labels (H2O becomes 2H218O) and collecting daily urine samples for 2 weeks.
Results showed a positive linear relationship between physical activity, TDEE, and metabolic scope (the ratio between TDEE and resting metabolic rate), even after adjusting for fat-free mass and resting metabolic rate. No clear plateau.
Succinctly put by the researchers: “This relationship is consistent only with the additive model and does not support the constraint or compensatory models”.
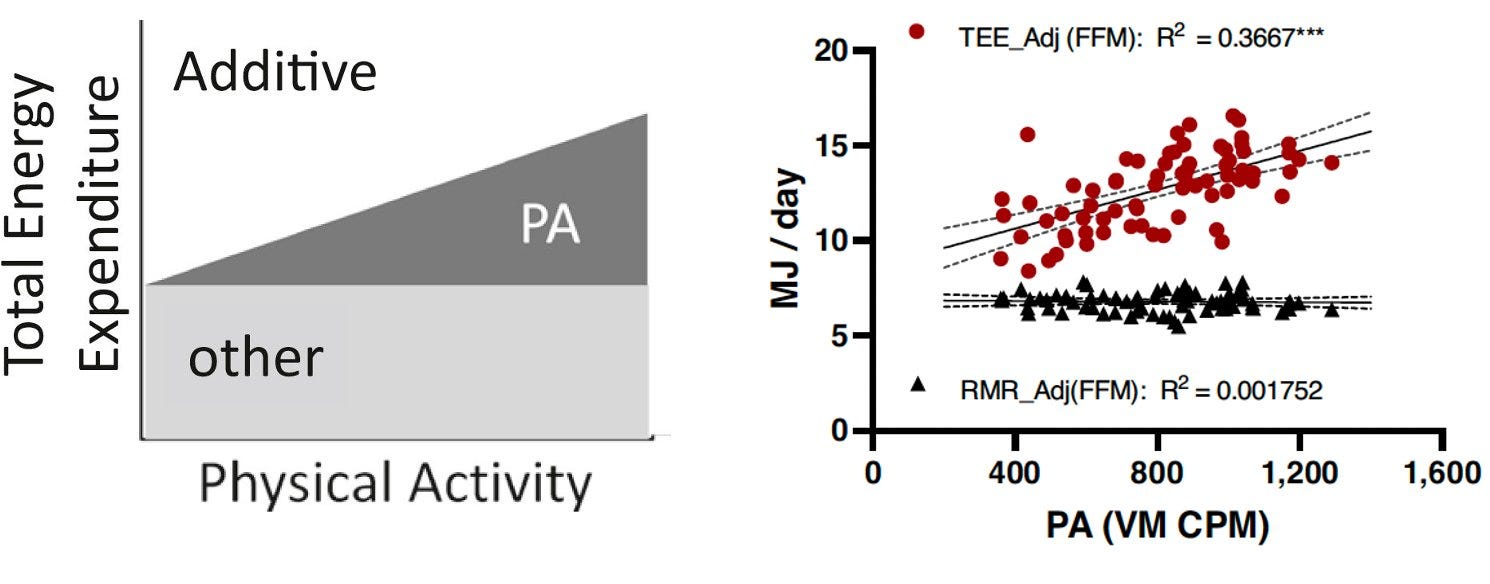
If you head out for a 5km run, the calories burned will directly add to your TDEE.
Does this mean the constrained model is dead? Not necessarily, but the “metabolic ceiling” may be higher than we thought.
I also expect that the different findings across studies are due to energy availability.
These participants were required to be “weight-stable”, defined as bodyweight within ± 5 lbs over the previous year. This is a proxy for sampling people who are in energy balance: calories in (via food) match calories out (via TDEE).
Constraint and compensation are more likely to occur with people who are in a negative energy balance: calories in are not sufficient to match calories out. This creates an energy deficit that the body compensates by reducing energy expenditure from elsewhere.
As a Nutritionist, I have worked with athletes’ experiencing relative energy deficiency in sport (or RED-S). This describes a condition of chronic low energy availability that can lead to lower resting metabolic rate, and loss of reproductive, bone, hair, and nail health. Faced with high physical activity energy demands, the body robs Peter to pay Paul. This condition improves as energy balance is restored and by addressing the behavioural causes of underfueling.
Overall, excellent work from the researchers, it adds another important piece of the puzzle to our energy metabolism knowledge.
Full study available here.
No posts
Comments
Nothing yet. Say the first thing.
Sign in to join the conversation.