
After a chaotic surge in 2020 and 2021, gun homicide in America is plummeting. Data for 2019 to 2025 from the Centers for Disease Control (CDC)1 make this plain:
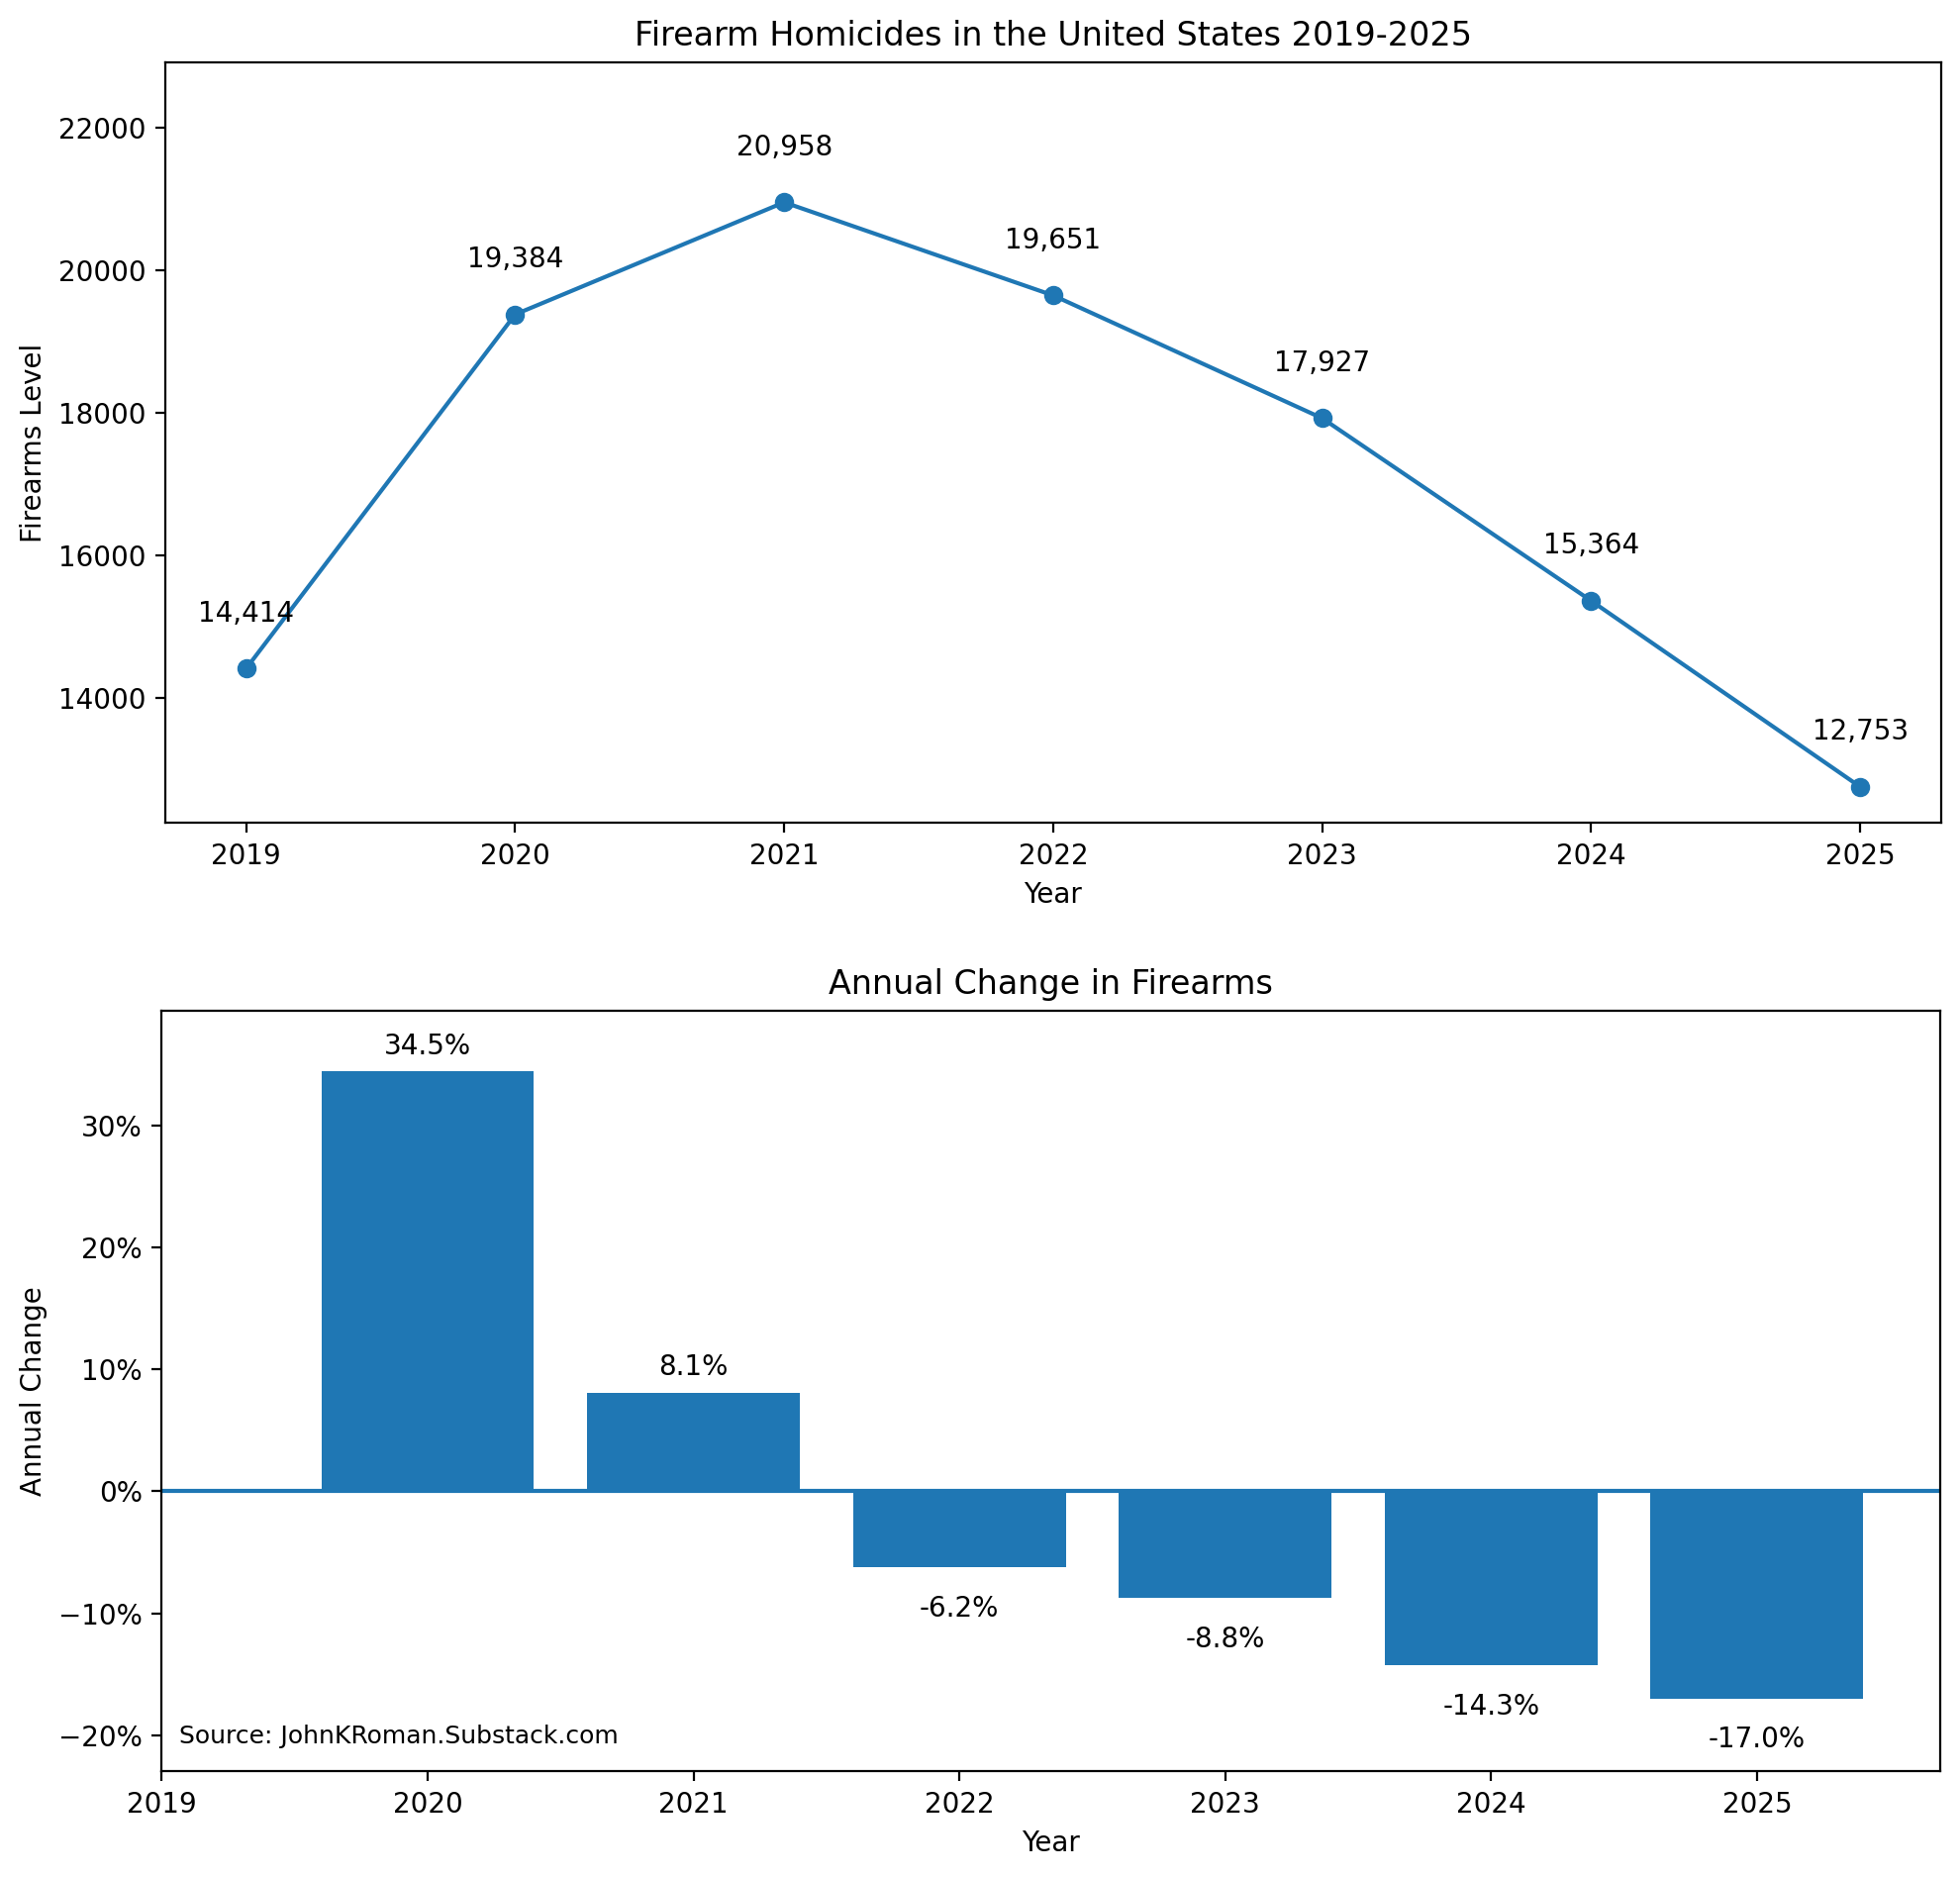
The overall effect has been to leave America in a better, less violent place in 2026 than it was in 2019 before the pandemic started. Gun homicides have declined from 14,414 in 2019 to 12,750 (estimated) in 2025. But that is only half the story, the good half. The bad news is that the number of firearm suicides appears to be at or near a record high.
The decline in firearms homicides is well documented and crystal clear from just those few figures. We are still grappling with why this decline is occurring. One obvious mechanism would be for the data on gun sales to contain something that readily explained the decline.
However, the gun sales data story is complicated. What I hope to show you, though, is that the patterns we see in sales data fit existing theories to explain the change in firearms suicide, while the effect on gun homicide is much murkier.
It is interesting to juxtapose the decline in firearms homicides with gun sales in the US, which, while declining from a 2020 peak, remain above 2019 levels. Notably, the total number of gun sales in the period is quite extraordinary. Between the beginning of 2020 and the end of 2025, more than 100 million guns were sold in the United States.
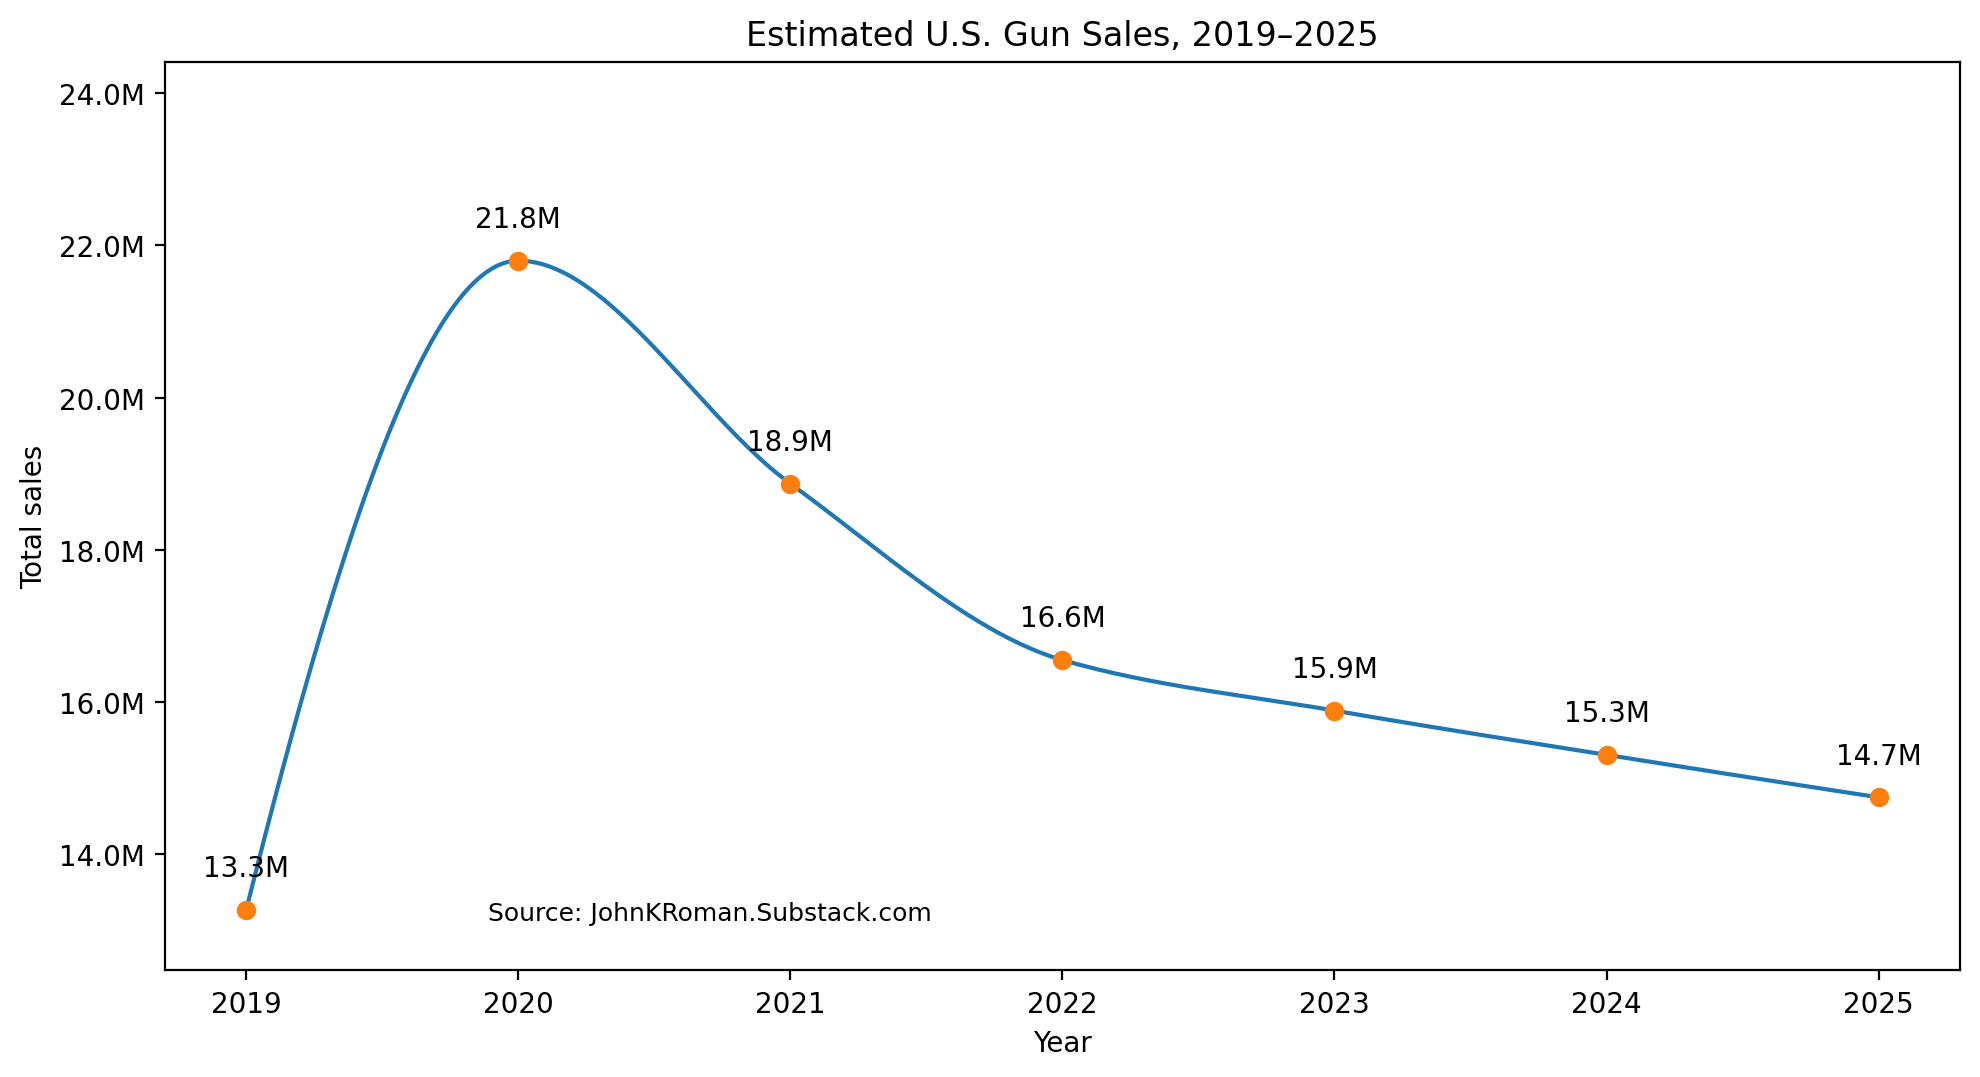
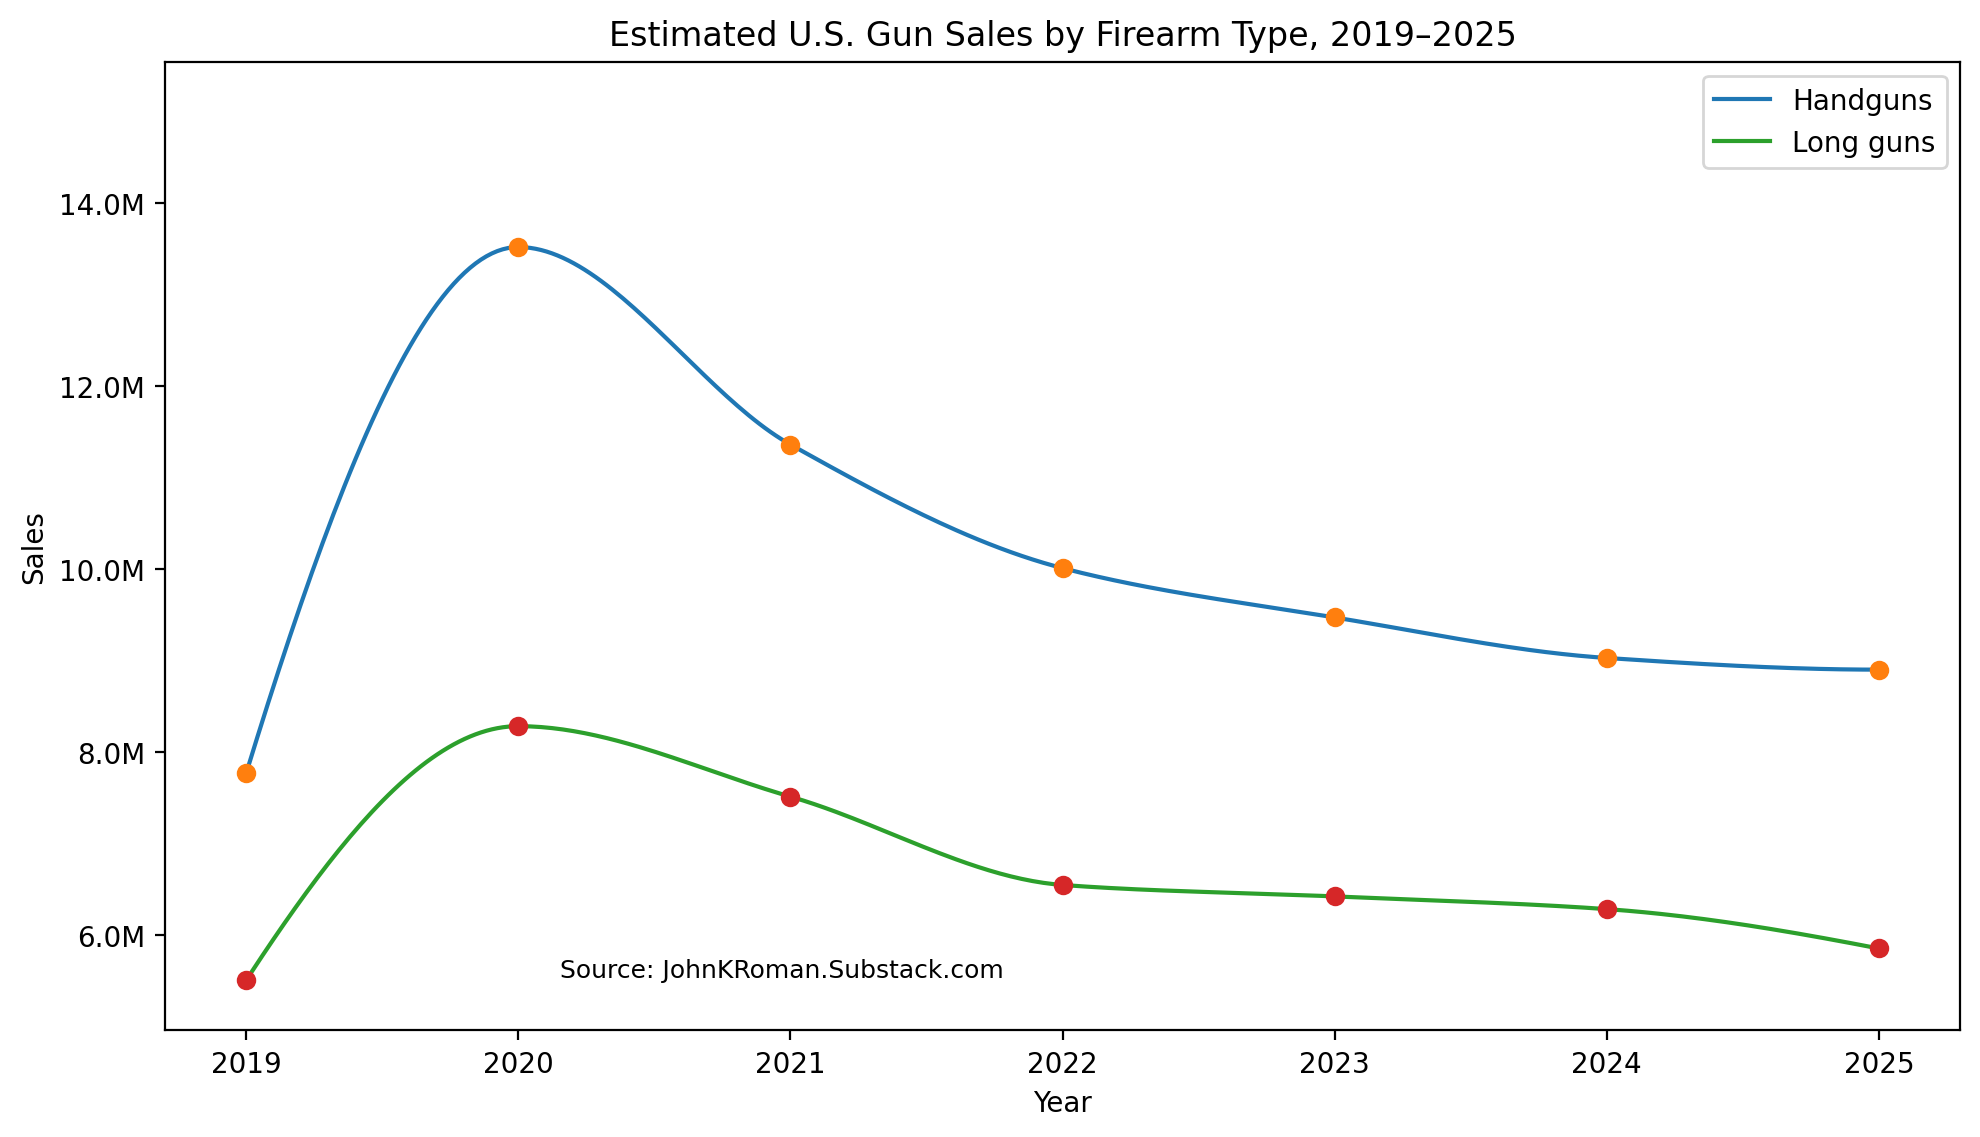
There has been a persistent mystery about why gun violence is declining rapidly when gun sales to civilians remain persistently above pre-pandemic levels. A closer look at the data helps to paint a clearer picture.
In 2019, the year before the pandemic, there were 13.5M guns sold in the United States. Sales spiked in 2020 to 21.8M, and actual gun sales for each year from 2021 to 2025 were greater than the number sold in 2019. Just comparing sales by year after 2019 to the 2019 level would suggest there were cumulatively 23.5 million gun sales above the 2019 level.
Taking a longer view shows that gun sales were increasing throughout the 2000s and 2010s. A better approach than comparing 2019 gun sales to later sales would be to compare post-2019 sales to the longer-term trend.
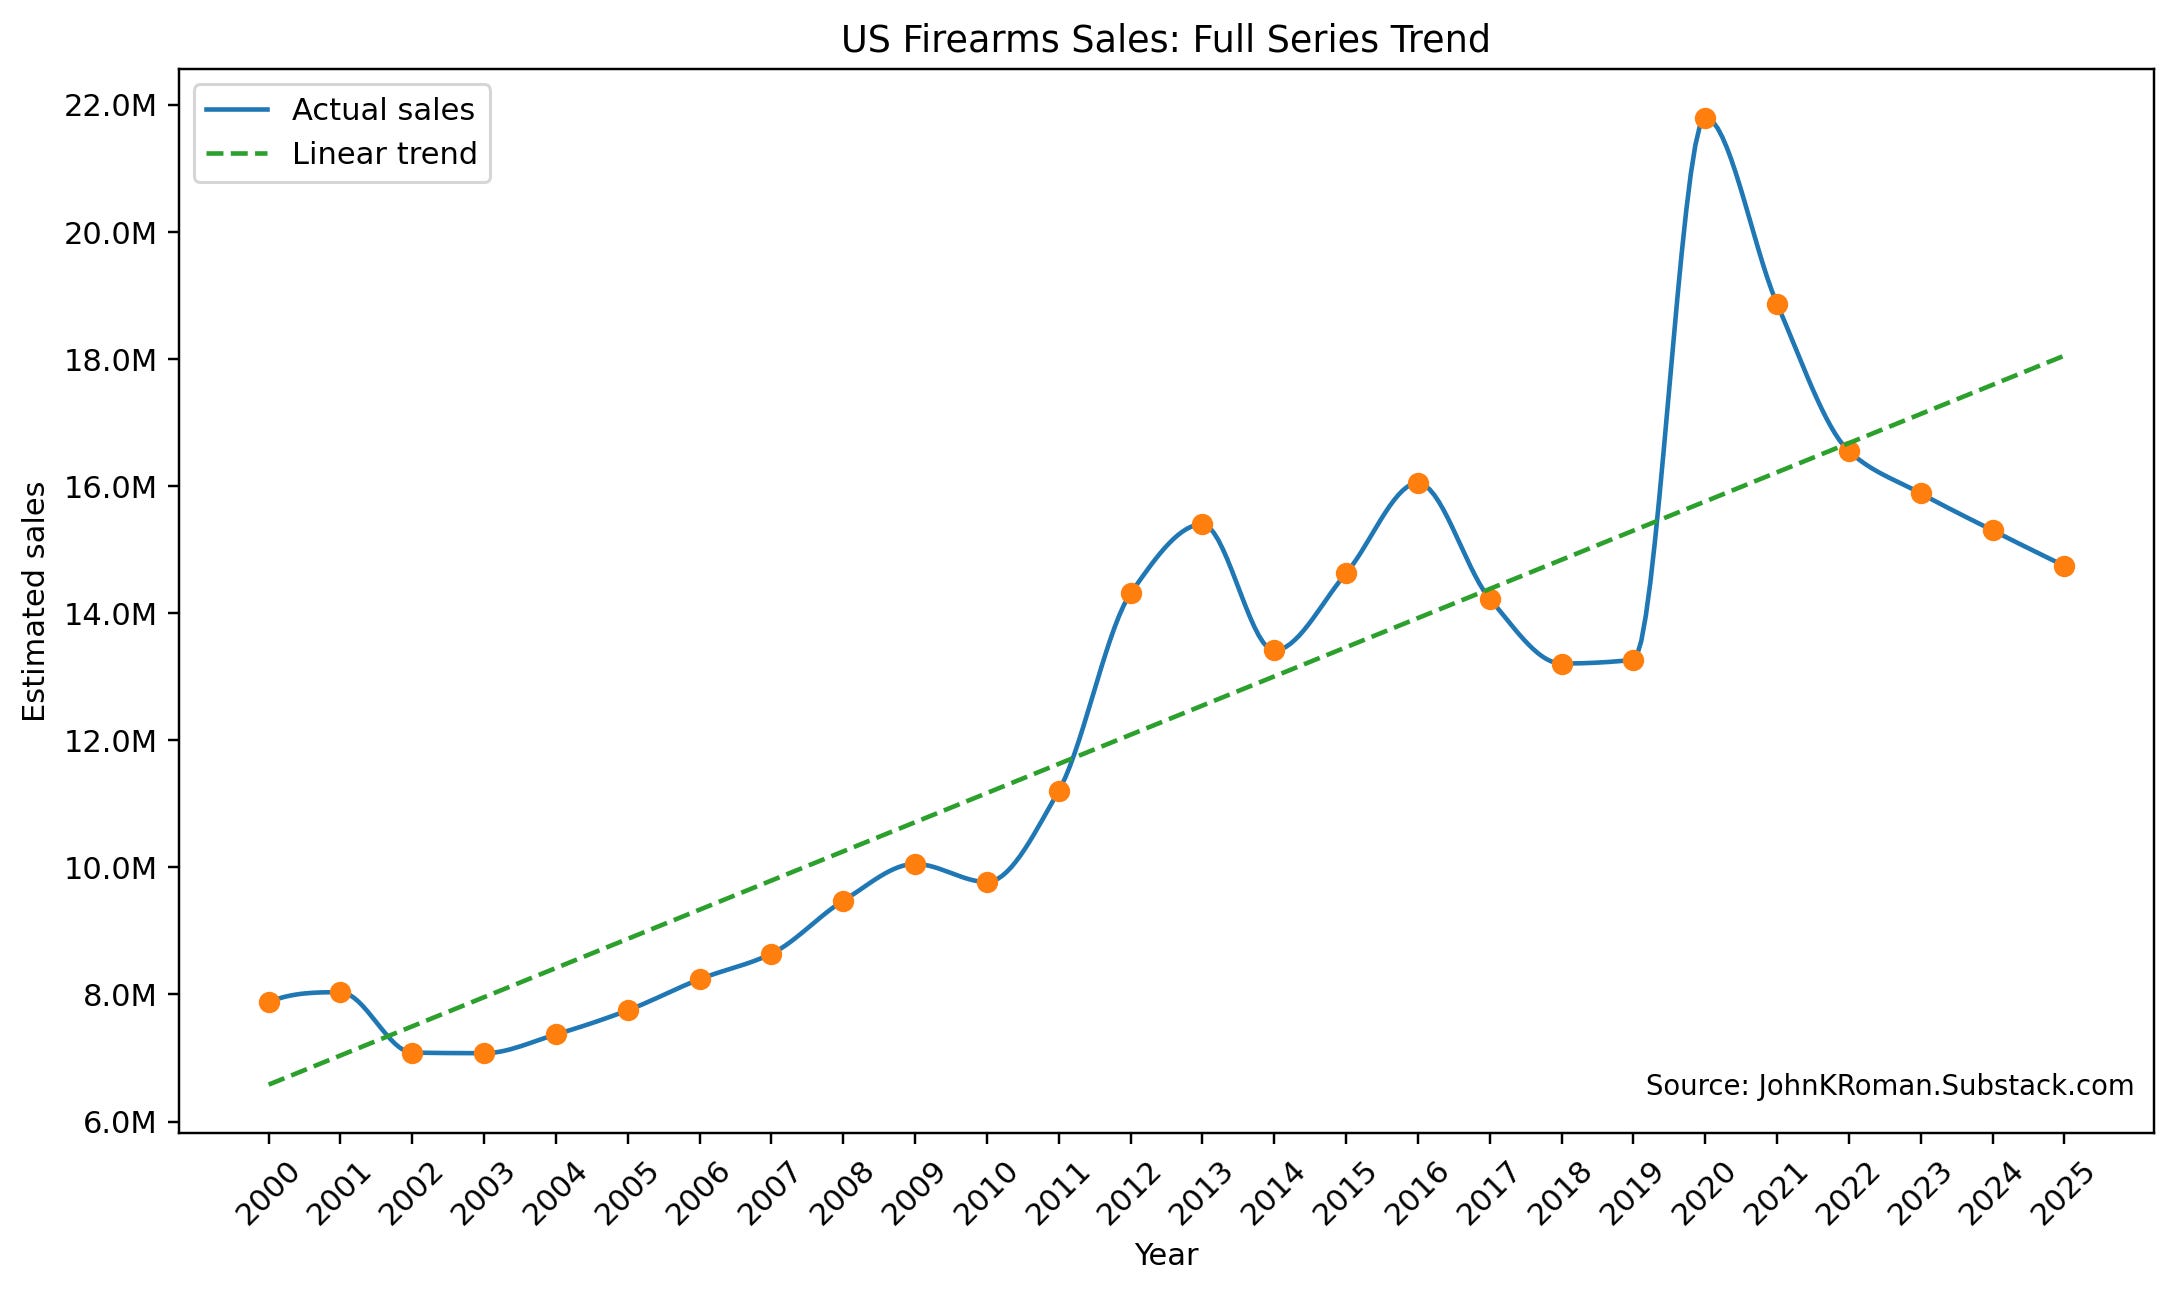
It is clear from the 2000-2025 data that there was a long-term and relatively stable upward trend in gun sales in place for two decades before the beginning of the pandemic. 2019 was a relatively low value compared to that trend.
In the figure above, I fit a long-term linear trend to the decade before COVID (2010-2019). That bit of math produces an intercept of 12,232,142 gun sales in 2010, and an expectation that sales would increase by 292,281 guns each year throughout the decade (and each year in the 2020s). The green dotted line in the figure above represents that trend line. We can then directly compare these two means of estimating expected and excess gun sales during the pandemic.
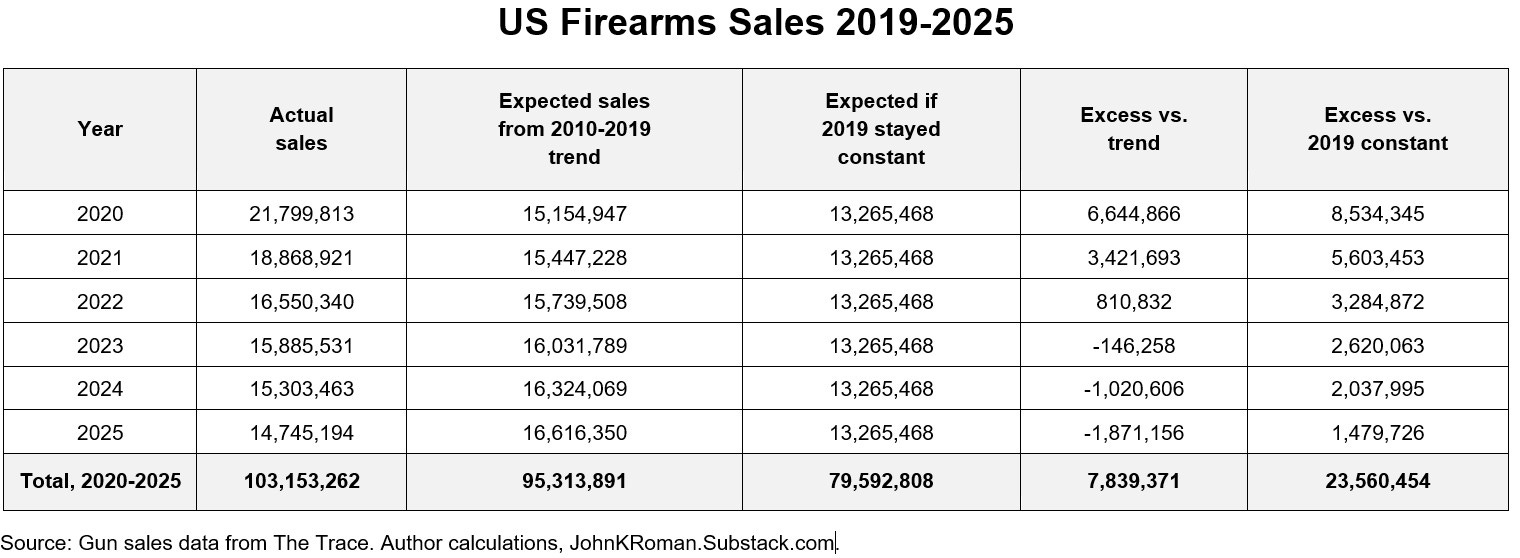
The pattern then is quite clear. The ‘actual sales’ rose by roughly 64% from 2019 to 2020, then fell by roughly 13% from 2020 to 2021, while still remaining well above trend (in the ‘Expected sales from 2010-2019 trend column’).
Using the ‘Excess vs trend’ column as a reference, gun sales flattened back to trend (2022 and 2023) and then fell below trend in 2024 and 2025. In sum, about 3M fewer guns were sold in those two years (2024 and 2025).
But the headline is what happened in 2020. In 2020, at the height of the pandemic, gun sales were greatly above trend: more than 6.6M additional guns were sold that year. The next year, more than 3.4M excess sales occurred. That’s 10 million extra gun sales in just two years, 2020 and 2021.
The effect of gun sales on guns used in crimes is notably complex. It does not appear to be the case that the simple fact that gun sales were higher in the 2020s led to higher rates of gun homicide. Gun sales were about the same in 2023-2025 as they were in 2011-2016, but gun homicide rates were plunging in the 2020s and relatively stable in the 2010s.
One explanation is that it matters whether there is a clear upward or downward trend, more than the volume of sales alone.
One way to think about this is to use a metaphor, borrowed from physics. A basic relationship in physics is FORCE = MASS X ACCELERATION. With respect to firearms and homicide, Mass is the number of guns sold, and acceleration measures how much gun sales are increasing. When both are increasing, the force they exert on illicit gun use is likely much greater. In 2024 and 2025, though, there is actually a deceleration in firearms sales. Clearly, there has been some lessening of pressure.
Now, it would be an exaggeration to say that those declines below expected sales levels contributed directly to the decline in gun violence. We know so little about who buys guns that those statistical associations are fraught. There is evidence that pandemic gun buyers were more likely to be first-time gun buyers, but that trend seems to have ended. Thus, it may well be that much of the growth in gun sales in recent years is simply people adding to their collections.
What we don’t know for sure is the relationship between first-time gun ownership and firearms homicides, nor the effect of buying a 5th gun on firearms homicide. We know that the time from initial purchase until a gun turned up at a crime scene accelerated in 2020 and 2021, and seems to have slowed since.
What we do know with much greater certainty is the relationship between gun sales and suicide by firearm. In fact, the relationship is well understood, and we use it to calculate what is likely the grimmest equation in the field of criminal justice.
There is currently no direct administrative data mechanism to estimate how many households in America own a gun. We can use surveys, and proxy measures—sales of Gun & Ammo magazine were often used in this way in the past.
In 2004, Deborah Azrael, Philip J. Cook, and Matthew Miller validated FSS—the share of suicides committed with a firearm—as a strong proxy for household firearm prevalence. The logic is that the ratio of suicides by firearm to all suicides provides an accurate approximation of the percentage of households owning a firearm.
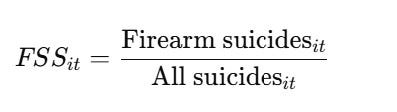
FSS is the ratio of firearms suicides to all suicides, i measures each place in each time period (t).
Another well-established rule of suicides in general and firearms suicides in particular is that easy access to a lethal device increases the likelihood of a death by suicide. Dramatic increases in the number of guns in circulation will likely increase access to a weapon in a time of crisis. While we don’t know for certain the relationship between the number of guns in a household and firearms suicide risk, it is reasonable to assume that there is some increase if a household goes from zero firearms to one, and some increase if the household goes from five to six.
To estimate the trend in firearms suicides, I use the same CDC WONDER data as above, and use the same process to impute values for partial data for November 2025 and not yet reported data for December 2025 (please see the endnote for important caveats about this imputation).
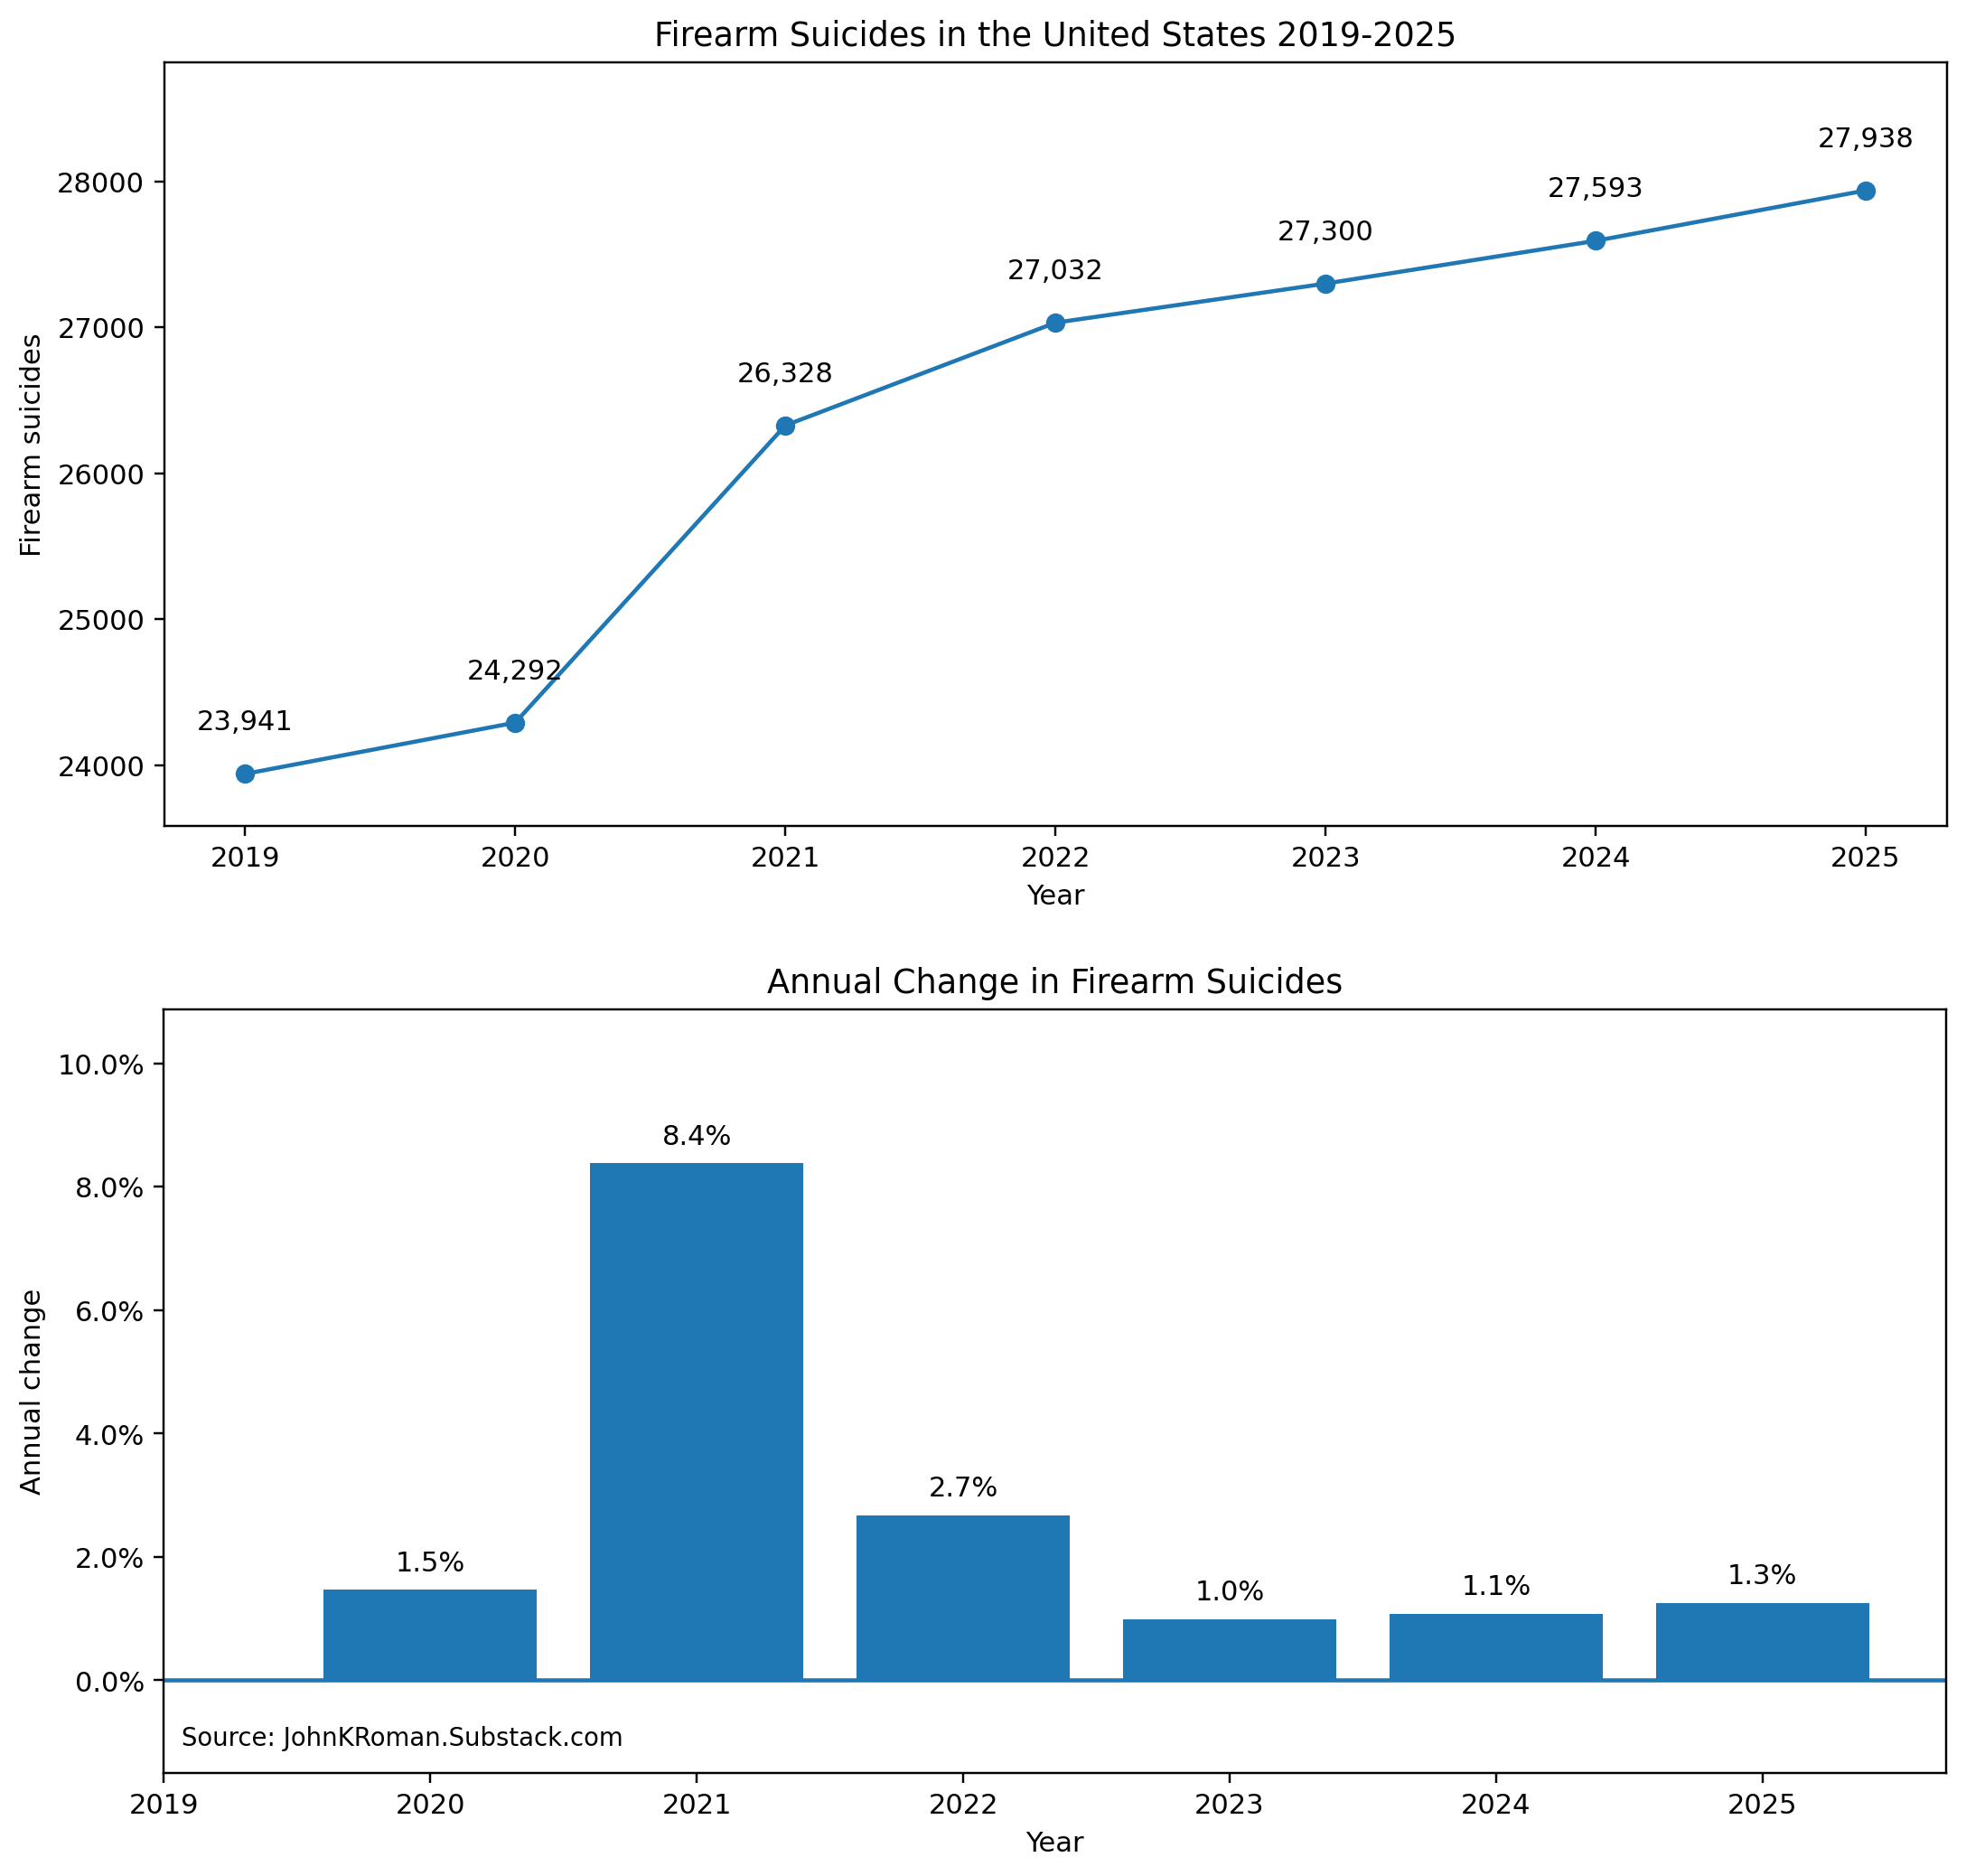
The interpretation of firearms suicide data does not require much explanation. The number of firearm suicides has increased each year since 2019. There was a large spike in 2021, followed by consistent growth throughout the period.
Finally, since I have the data handy, I thought it would be interesting to compute the FSS for 2020-2025. Again, the FSS is a ratio of the number of firearms suicides to all suicides, which is used to estimate the prevalence of US households owning firearms.
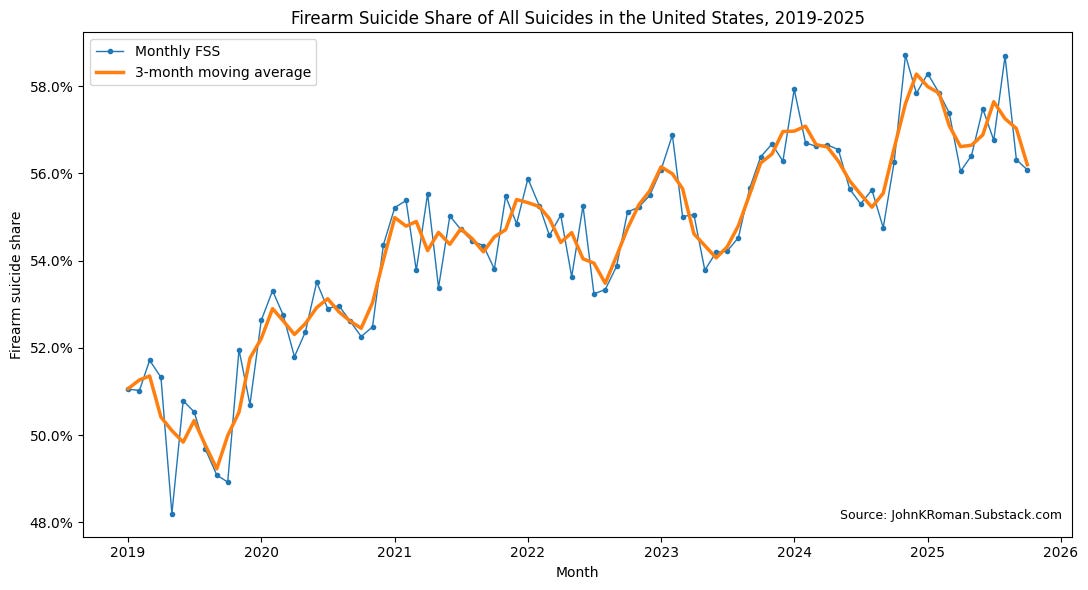
The data imply that at the beginning of the pandemic, the FSS was about 50%, and by 2025, that percentage had increased to about 56%. This is slightly higher than the rate of household firearm ownership implied by national survey data, which was around 46% in the early 2020s. The firearm-suicide proxy implies a substantial increase in firearm prevalence or access after 2019.
Comments
Nothing yet. Say the first thing.
Sign in to join the conversation.