
I think I can nail this in one easy-to-understand slide. Take the penultimate slide of part 3 in this series and imagine that the homogenous data cloud for this gets coded into normal and extreme mortality periods. That sure would nail things, and in a grisly graphical manner.
To get the ball rolling we have to define ‘extreme mortality’ and I’ve gone for the easy option of declaring this to be a rescaled influenza mortality for England & Wales exceeding 5 deaths per 100k population for the period 1965 – 2022. This simple definition yields 7 extreme years, and if I re-jig that penultimate plot of part 3, it looks like this:
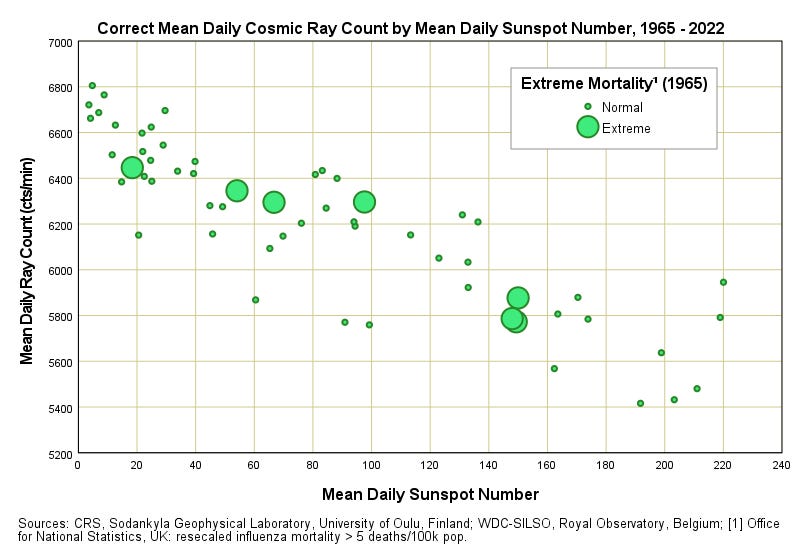
This makes it pretty clear that there’s no obvious and immediate link between cosmic ray counts, solar activity and influenza mortality (if we ignore the likelihood of lagged effects, that is). If cosmic rays were a problem, then those whopper extreme mortality blobs would cluster top left; if solar activity was a problem then they’d congregate bottom right; but tha…
Comments
Nothing yet. Say the first thing.
Sign in to join the conversation.