
A junior engineer wires up Spring Boot Actuator, adds
spring-boot-starter-actuatorto the POM, and calls it done. They get/actuator/metrics/jvm.memory.usedout of the box. Beautiful, until they look at what that costs.Spring Actuator’s default
MeterRegistryusesAtomicLongfor every counter. Under load — 50,000 connection events per second — every increment is a compare-and-swap on a shared cache line. The CPU burns cycles retrying failed CAS operations as threads collide. At 10 threads that’s noise. At 500 Virtual Threads funneling connection events, that’s measurable throughput degradation. You’ve added observability that slows down the thing you’re observing.The second trap: metric collection tied to the request path. If scraping your
/metricsendpoint blocks on the same lock that your connection handler uses to update state, you’ve just made Prometheus scrapes into a latency spike for every client connected at that moment.The third trap: string formatting. Spring formats metric names and labels on every read.
String.format("gateway_events{server='%s'}", hostname)in a tight loop allocates heap on every invocation. At 1M events/minute, you’re feeding the GC constantly.
The naive implementation collapses under two forces simultaneously.
Cache line contention: An
AtomicIntegeris 16 bytes. Under JVM object layout, a hot counter sits on a 64-byte CPU cache line. When 500 Virtual Threads all increment it, the L3 cache must arbitrate ownership of that cache line across CPU cores. Intel MESIF protocol means each increment — fetch, modify, write-back — stalls other cores. You get cache line bouncing, visible as elevatedLLC-load-missesinperf statoutput. Throughput flatlines at ~2M increments/second where the unconstrained math says 100M+.Eden space pressure from metric labels: Prometheus exposition format requires label strings. Generating
gateway_events_total{shard="3",type="MESSAGE"}\non every scrape via naive concatenation creates oneStringobject per metric per scrape interval. At 200 metrics, scraped every 15 seconds, that’s manageable. But if you push metrics instead of pull — formatting on every event — you’ve turned your metrics layer into an allocation firehose.The rate calculation trap: Storing raw event timestamps to calculate events-per-second means
ArrayList<Long>growing unbounded. At 10,000 events/second, you’re storing 600,000 longs per minute before any GC has a chance to clean up. The heap inflates. Stop-the-world pauses start showing up at the worst moments — during traffic spikes, precisely when you need accurate metrics most.
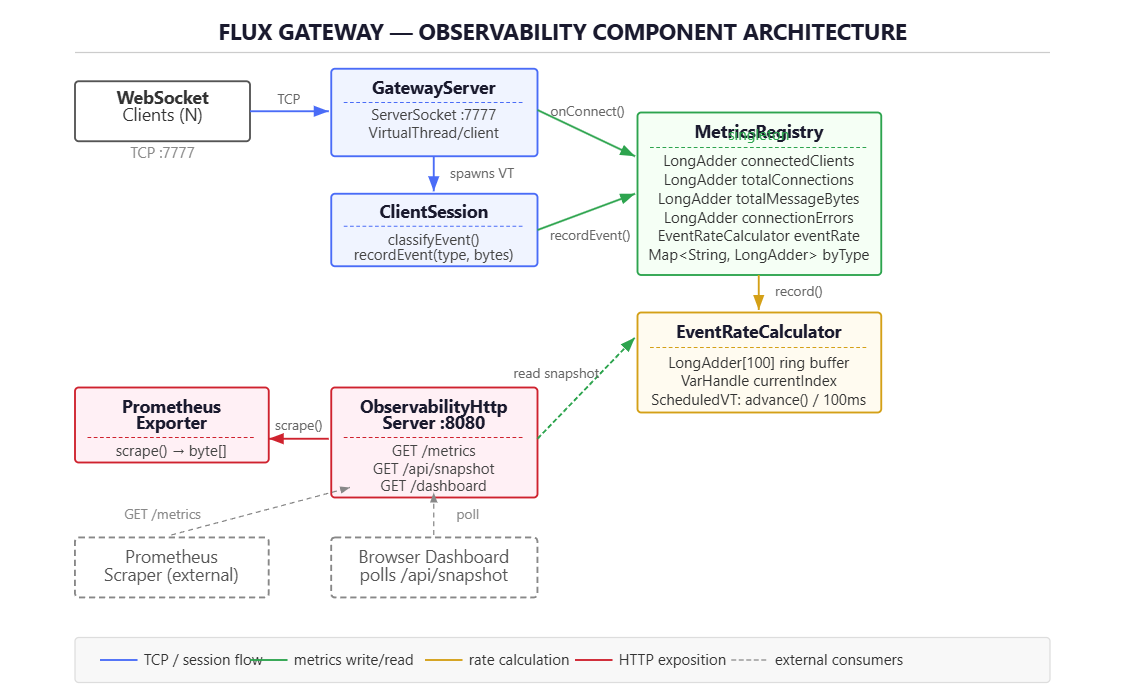
Three principles drive the observability layer:
Wait-free counters via LongAdder: Java’s LongAdder uses Striped64 internals — it maintains an array of Cell objects, each pinned to a thread group via a hash of the thread ID. Increments write to thread-local cells. Reads sum all cells. No CAS contention on increments because threads rarely collide. The tradeoff is that reads are slightly stale — the sum is eventually consistent, not instantaneous. For Prometheus metrics scraped every 15 seconds, this is irrelevant.
Ring buffer for rate calculation: Events Per Second is computed over a sliding window. Instead of storing every timestamp, a fixed-size ring buffer of slot counters tracks events per 100ms bucket. EPS = sum of last 10 buckets / 1 second. The ring buffer is pre-allocated at startup — no heap allocation on the hot path, ever.
Pre-formatted label strings: Metric names and labels are computed once at registration and cached as byte[]. The Prometheus exposition format writer copies pre-built byte arrays into the response buffer. Zero String allocation during scrape.
https://github.com/sysdr/discord-flux-p/tree/main/day60/flux-gateway-observability
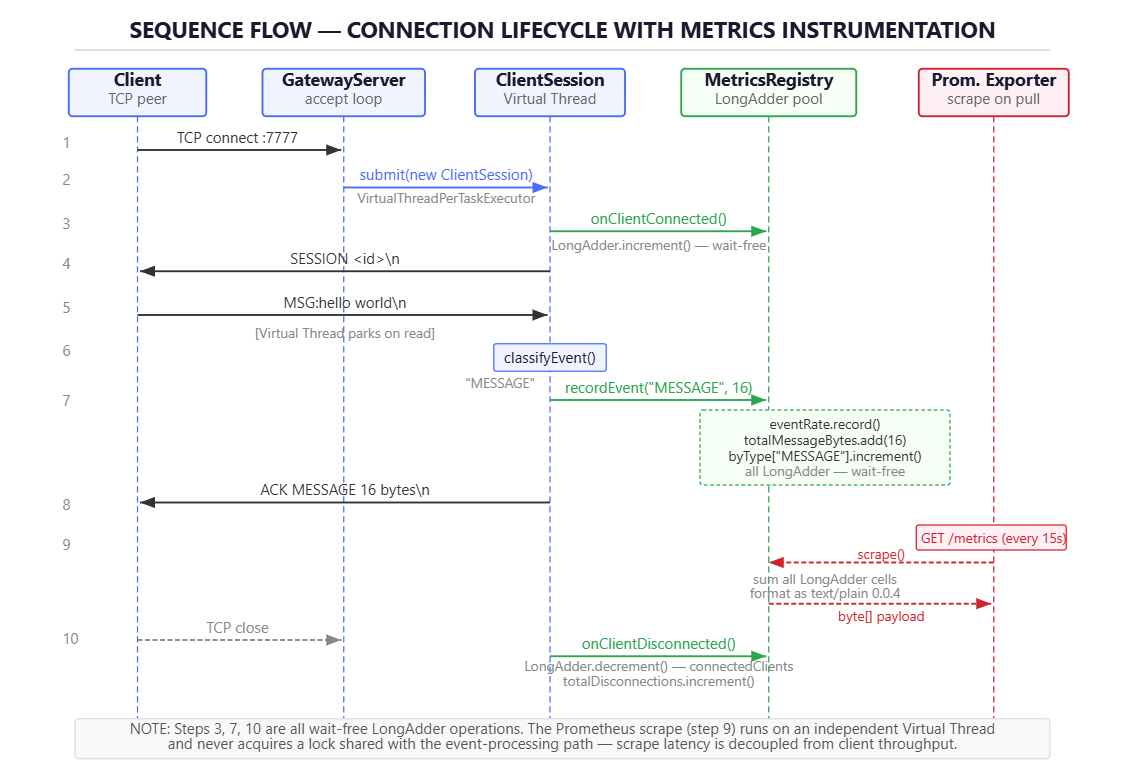
LongAdder as gauge delta: Connected client count is a gauge, not a counter. On connect, call connectedClients.increment(). On disconnect, call connectedClients.decrement(). The longValue() at scrape time gives the current snapshot. The JVM’s Striped64 implementation handles the summation across cells under the hood.
EventRateCalculator ring buffer: The calculator maintains a LongAdder[] buckets array of size 100 (100 buckets × 100ms = 10 seconds of history). A currentBucket index advances every 100ms via a ScheduledExecutorService using a Virtual Thread factory. On advance, the old bucket is zeroed. EPS is sum(buckets) / 10.0. This is O(1) on the write path — just buckets[currentBucket].increment() — with no synchronization needed on the hot path.
VarHandle for atomic bucket index: The currentBucket pointer uses VarHandle.getAndAdd() with modular arithmetic. This is cheaper than AtomicInteger for this access pattern because we only need release/acquire semantics, not full sequential consistency.
Prometheus text format: The exposition format is dead simple:
# HELP gateway_connected_clients Current number of connected WebSocket clients
# TYPE gateway_connected_clients gauge
gateway_connected_clients 4821
# HELP gateway_events_per_second Event processing rate
# TYPE gateway_events_per_second gauge
gateway_events_per_second 12847.30
Pre-build the # HELP and # TYPE lines as byte[] at startup. At scrape time, concatenate with the current value formatted via Long.toString() — the only allocation.
Virtual Thread HTTP server: The metrics HTTP server uses com.sun.net.httpserver.HttpServer with a Virtual Thread executor. Each Prometheus scrape gets its own Virtual Thread. Since scrapes are I/O bound (write response, flush socket), Virtual Threads park during the write and yield the carrier. No blocking, no wasted platform threads.
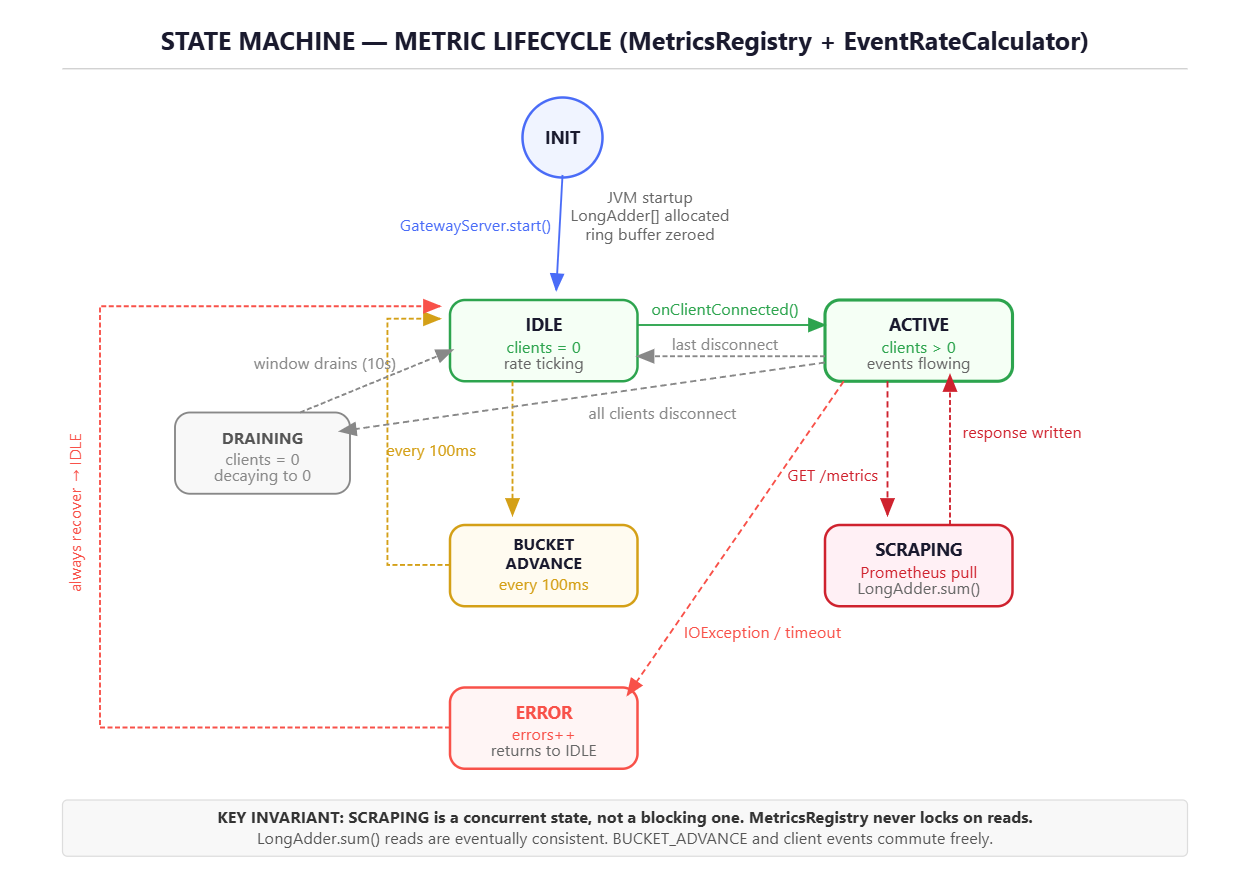
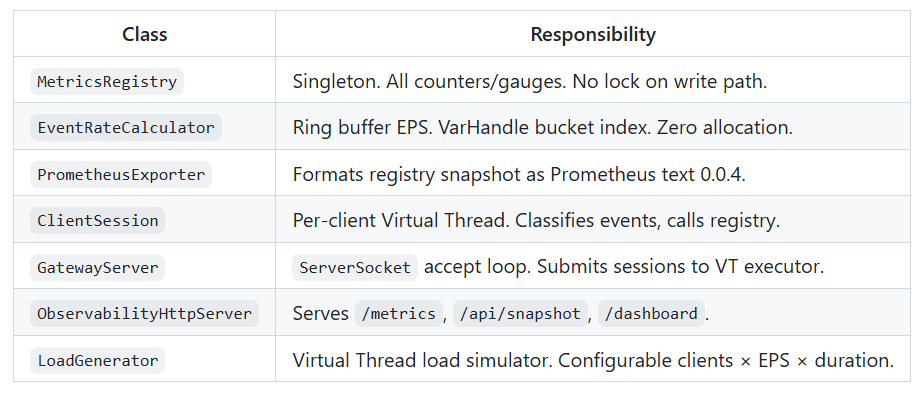
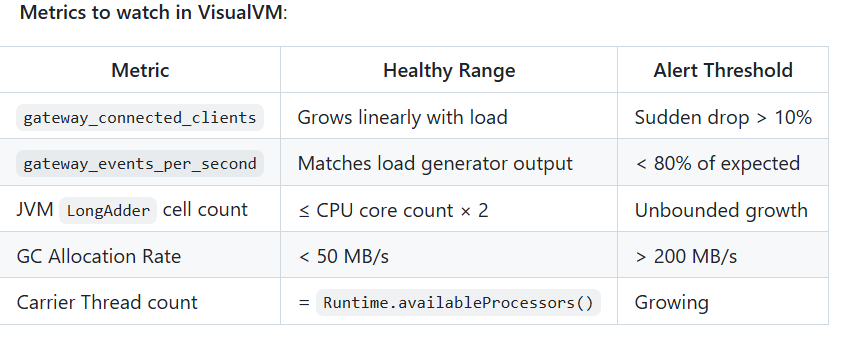
The carrier thread count is the canary. If Virtual Threads are parking correctly on I/O, you should see exactly N platform threads (where N = available CPUs) doing real work. If the count grows, something is blocking a carrier — a synchronized block, a native call, or a pinned Virtual Thread.
Key jcmd commands:
# Thread dump to catch pinned virtual threads
jcmd <pid> Thread.dump_to_file -format=json /tmp/threads.json
# GC stats
jcmd <pid> GC.heap_info
# Live memory
jcmd <pid> VM.native_memory
Heap vs off-heap: The ring buffer and pre-formatted label bytes live on-heap but are long-lived — they’ll be promoted to Old Gen immediately and rarely GC’d. The allocation rate should be near zero for the metrics layer itself. If you see consistent Eden allocation from the metrics package, you’ve got a formatting leak.
JDK 21+
Maven 3.9+
VisualVM 2.x (for thread/heap observation)
curl(for endpoint verification)python3(optional, for JSON pretty-print inverify.sh)
cd flux-gateway-observability
chmod +x start.sh demo.sh verify.sh stop.sh cleanup.sh
./start.sh
Expected output:
==> Building flux-gateway-observability...
==> Starting server...
=== Flux Gateway Observability — Day 60 ===
[ObservabilityHttpServer] http://localhost:8080/dashboard
[ObservabilityHttpServer] Prometheus: http://localhost:8080/metrics
[main] Gateway on :7777
[main] Dashboard at http://localhost:8080/dashboard
[main] Prometheus at http://localhost:8080/metrics
[main] Press Ctrl+C to stop.
[GatewayServer] listening on :7777
In a second terminal:
cd flux-gateway-observability
./demo.sh
Expected output:
[LoadGen] starting 50 clients @ 10 events/s each for 30s
[LoadGen] sent=1024 errors=0 remaining=28s
[LoadGen] sent=3148 errors=0 remaining=26s
...
[LoadGen] done. total_sent=15000 total_errors=0./verify.shExpected output:
==> [1] Checking Prometheus /metrics endpoint...
  [PASS] gateway_connected_clients present
  [PASS] gateway_events_per_second present
  [PASS] gateway_connections_total present
==> [2] Checking JSON snapshot...
  [PASS] connectedClients in snapshot
  [PASS] eventsPerSecond in snapshot
==> [3] Checking dashboard...
  [PASS] dashboard returns 200
==> [4] Live metric values:
{
    "connectedClients": 50,
    "eventsPerSecond": 487.20,
    "totalConnections": 50,
    "totalDisconnections": 0,
    "totalMessageBytes": 49152,
    "connectionErrors": 0
}
==> All checks complete.
curl http://localhost:8080/metricsExpected:
# HELP gateway_connected_clients Current number of connected WebSocket clients
# TYPE gateway_connected_clients gauge
gateway_connected_clients 50
# HELP gateway_events_per_second Sliding-window event processing rate
# TYPE gateway_events_per_second gauge
gateway_events_per_second 487.20
# HELP gateway_connections_total Total WebSocket connections accepted
# TYPE gateway_connections_total counter
gateway_connections_total 50
...
# HELP gateway_events_by_type_total Events processed broken out by type
# TYPE gateway_events_by_type_total counter
gateway_events_by_type_total{type="MESSAGE"} 9823
gateway_events_by_type_total{type="HEARTBEAT"} 3014
gateway_events_by_type_total{type="VOICE"} 1201
gateway_events_by_type_total{type="REACTION"} 962
cd flux-gateway-observability
mvn testAll three test classes should pass: MetricsRegistryTest, PrometheusExporterTest, EventRateCalculatorTest.
Open VisualVM, connect to the running
gateway-observabilityprocess.Under the Threads tab: you should see N carrier threads (N = CPU count) and the Virtual Thread count spiking to ~50 during the load test, then returning to baseline after the demo completes.
Under the Heap tab: the allocation rate should be near zero from the metrics layer — a flat sawtooth from normal JVM overhead, not a climbing ramp.
If you see carrier thread count growing beyond N, run
jcmd <pid> Thread.dump_to_file -format=json /tmp/td.jsonand grep for"PINNED"to find the culprit.
./stop.sh      # kills the running server process
./cleanup.sh # removes target/ and build artifacts (does not kill the process)Beginner: Add a gateway_disconnections_total counter broken out by reason code (timeout, error, clean close). Expose it in the Prometheus endpoint with a reason label.
Intermediate: Implement an HDR histogram for event processing latency. Track min/max/p50/p99 latency in nanoseconds using a simple power-of-2 bucket array (no external libraries). Expose as gateway_latency_ns_bucket{le="..."} in Prometheus histogram format.
Expert: Replace the pull-model Prometheus endpoint with a push-model PushGateway client. Batch-write metrics every 5 seconds using a Virtual Thread. Handle PushGateway unavailability with an exponential backoff retry loop using VarHandle-based state to avoid double-sending during retries. The state machine should have states: IDLE → PUSHING → RETRYING → IDLE.
No posts
Comments
Nothing yet. Say the first thing.
Sign in to join the conversation.