
First, a brief return to the buses. A report on Japanese TV news this week highlighted the 98:2 problem in the bus industry. I was puzzled by what the 98:2 problem could possibly be. It turned out to be the ratio of male to female bus drivers. The solution offered to the shortage of drivers was to increase the proportion of female drivers. I’d kind of felt that I saw more female bus drivers in Japan than I had in the UK, so I was deeply sceptical of this idea. But, it turns out that the proportion of female bus drivers in the UK is about 10 percent of the total, so maybe there is room for more hiring of female bus drivers here. This is only likely to tinker at the edge of the problem though. I doubt it’s a very attractive job for most women, despite the TV segment’s desire to persuade them otherwise.
As this article makes clear: Bus Operators Struggle for Survival Even in Urban Areas, the choices are: to raise fares to pay bus drivers higher wages, reduce services, or increase taxes to subsidise local bus operators, which currently have to make a profit. Increased fares would hit the very people who need the service the most. Increasing the tax burden wouldn’t be popular either. So currently, reducing bus services is winning out — it turns out there are other options to increasing wages.
This week, I’d like to start looking at wages in the manufacturing industry — one of the three big employment industries in Japan. Nominal wages over the last twenty years for full-time workers look like this:
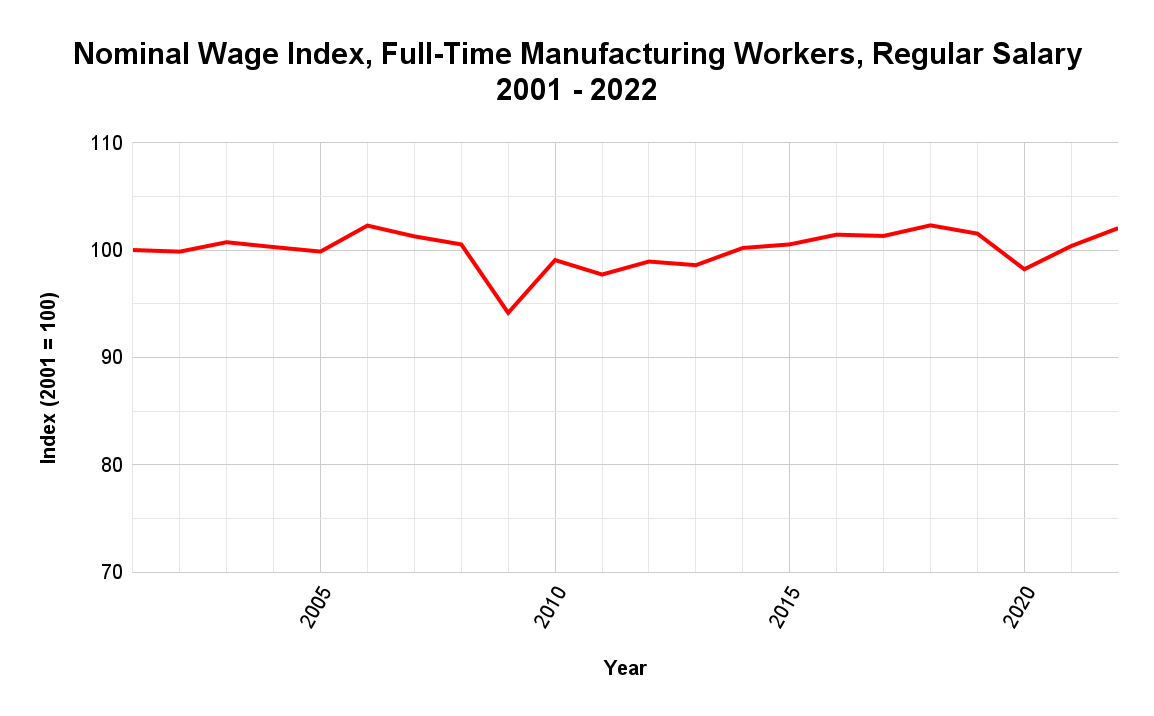
As flat as a pancake (OK, there’s a couple of holes in there, maybe as flat as a crumpet). As are real wages over the last twenty years:
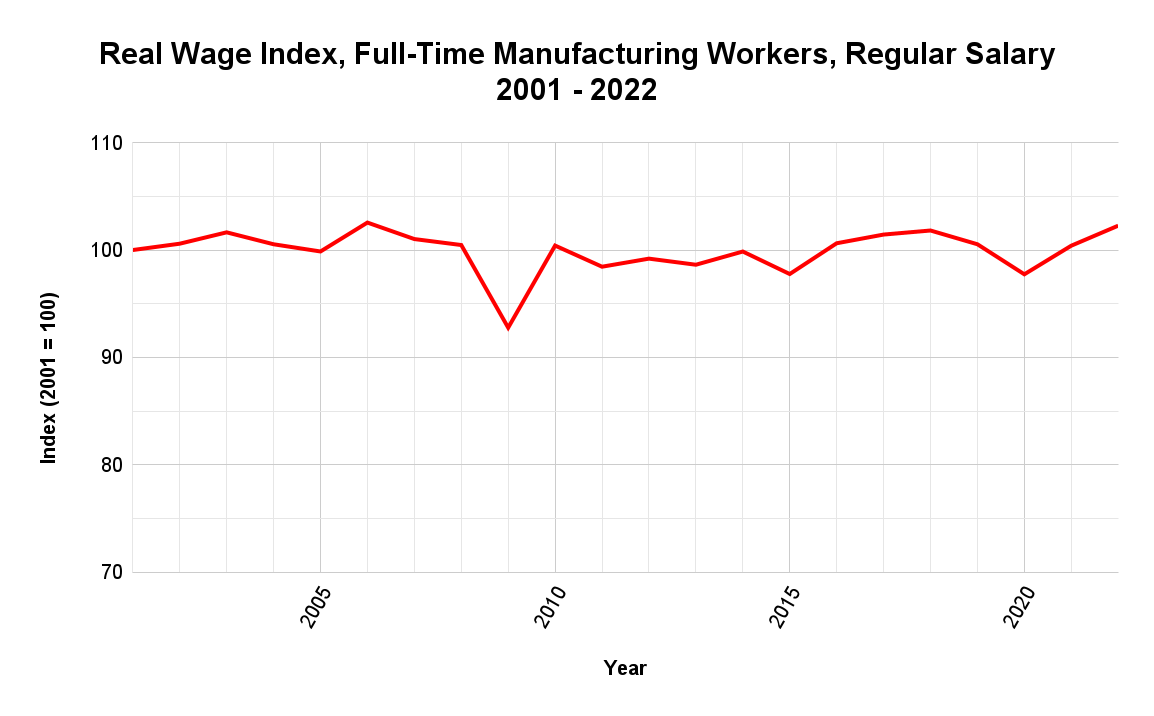
The steady increase in nominal wages between 2011 and 2018 is offset by the rising average inflation rate during the same period. The number of hours worked has fallen very slightly, so real wages per hour have risen a smidgen.
And yet, productivity in the manufacturing sector in Japan increased by 40 percent between 2000 and 2011 (source: Output Per Hour in Manufacturing in Japan) (I can’t find more up to date statistics). The increase in productivity certainly didn’t find its way into workers’ wages.
The wage profile by age for the manufacturing industry looks like this:
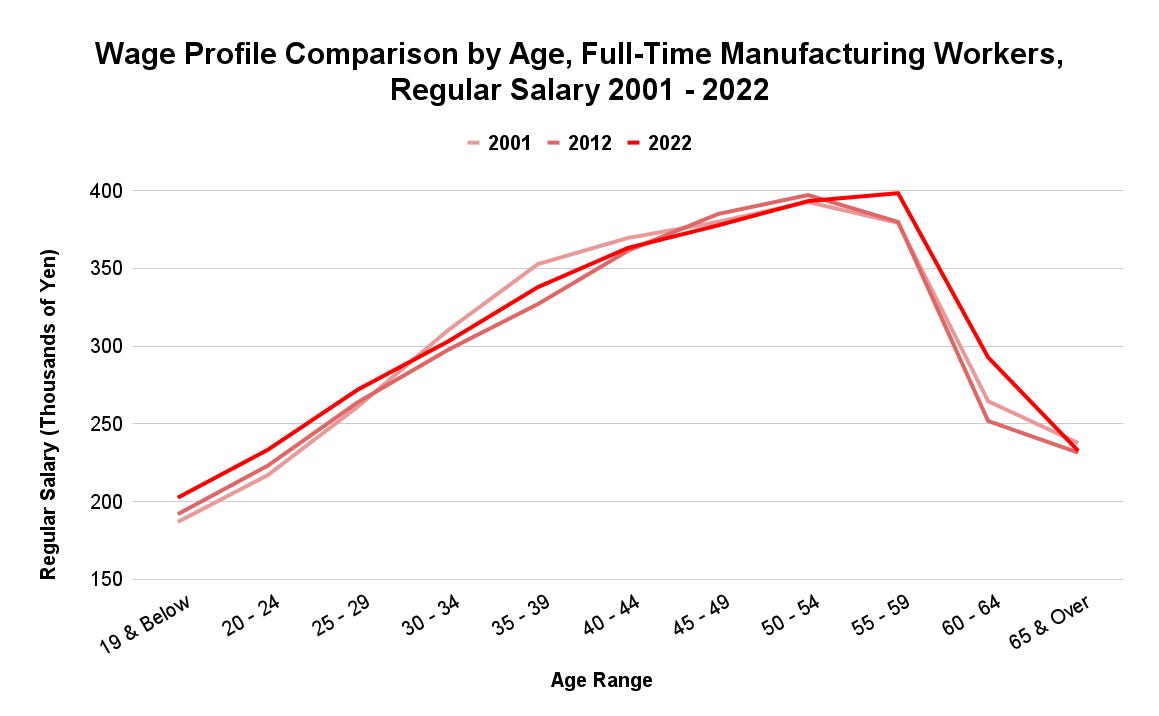
There’s hardly any change. The flattening we saw with bus drivers’ wages hasn’t occurred here, probably because more experienced manufacturing workers are actually considerably more productive than more experienced bus drivers. The main changes are at either end of the chart. There are signs of new entrants’ wages being pushed up, and at the other end, there’s a desire to retain older workers for longer.
Next time, we’ll look at part-time workers’ wages and the change in the proportion of part-time workers in the manufacturing industry.
Comments
Nothing yet. Say the first thing.
Sign in to join the conversation.