
Welcome to the 186th issue of On-chain Insights by IT Tech. Small-wallet demand built through the first half of July, climbing to a 30-day change of +3.48% by July 14, then gave almost all of it back by Sunday’s -3.46% print. Bitcoin barely noticed: it’s trading at $64,529 in Sunday’s still-open weekly candle, up 1.17% on the week, holding the same $61,800-$65,600 range it’s traded since the correction from $126,200 began.
The pullback in retail demand wasn’t the only reversal this week. Short-term holders sent 33,697 BTC to exchanges at a realized loss on July 14, the sharpest loss print in weeks. By Sunday, that number had fallen to just 1,144 BTC, among the shallowest readings of the past two weeks. Coinbase’s premium gap on both Bitcoin and Ethereum stayed negative all week, though it narrowed meaningfully from the depths of late June, and Bitcoin ETFs broke an eight-week outflow streak on July 12 before slipping into a small net redemption again this week. Sector breadth told a similar story: only 9 of 24 sectors closed green, and OTHERS underperformed Bitcoin by nearly 3 percentage points.
Individually, each of these reads as a market catching its breath rather than reversing. Together, they describe a week where selling pressure eased without buying pressure showing up to replace it. The data below breaks down where the two forces stand and what would need to change for either side to take control.
This Week in On-Chain:
Retail demand (0-$10K cohort) reversed from +3.48% to -3.46% in five days - the tailwind that built through early July faded by the weekend
STH realized losses to exchanges fell from 33,697 BTC (Jul 14) to 1,144 BTC (Jul 19) - the sharpest loss print of the month eased fast
Coinbase Premium Gap stayed negative on both Bitcoin (-38.86) and Ethereum (-1.38) all week, though both narrowed from June’s deep discount
Bitcoin ETF flows broke an eight-week outflow streak on July 12 (+$197.4M) before slipping back to -$61.0M this week, while Ethereum ETFs posted their best week of the stretch (+$73.8M)
Only 9 of 24 sectors closed green, weighted average sector move -1.52% - breadth stayed defensive even as Bitcoin held its range
Stablecoin supply contracted for a second straight month to $310.1B with USDT dominance near 59.35% - liquidity stayed on the sidelines rather than rotating into risk
🎥 YouTube: Onchain_Insights - English | IT Tech PL - Polish | Hub: btc-analysis.com
I share structured trade ideas for Bitcoin and Ethereum aligned with the on-chain framework used in this report. Access is free via one of the partner exchanges. Both exchanges are regulated in the European Union.
Bybit.eu 🇪🇺 EU users (EEA) - claim up to 40 USD 🎁 in BTC
OKX.com - MiCA and MiFID II licenses - Spot and derivatives trading in the EU 🇪🇺
*Disclaimer: Educational content only. Not investment advice. Past performance does not guarantee future results.
Cooling inflation offset renewed US-Iran tensions this week, while crypto ETFs snapped an eight-week outflow streak and the CLARITY Act kept moving through Congress.
Crypto ETFs Return to Net Inflows. US spot Bitcoin ETFs pulled in roughly $197M for the week of July 12, the first positive week after eight straight of redemptions. Ethereum ETFs added $84M, with BlackRock’s IBIT leading.
Bitcoin and Ethereum Post Mild Gains. Bitcoin traded $62K-$65K, Ethereum climbed alongside it. Altcoins were mixed, with AI and meme-adjacent names outperforming.
CPI and PPI Signal Cooling Inflation. June headline CPI came in soft on falling energy prices; PPI followed suit, easing near-term rate-hike fears and lifting risk assets.
CLARITY Act Advances. The Digital Asset Market Structure bill moved closer to a merged draft and possible Senate action; GENIUS Act stablecoin implementation also progressed.
US-Iran Tensions Spike Oil. Renewed Strait of Hormuz tensions pushed Brent above $76, pressuring risk assets early in the week before markets stabilized.
Stocks Mixed, Tech Resilient. S&P 500 and Nasdaq posted modest gains on chip and AI strength; the Dow lagged. Bank earnings and SK Hynix’s debut added volatility.
Fed Signals Stay Mixed. New Fed Chair Kevin Warsh’s testimony and other Fedspeak showed divided views on rates, with softer CPI providing some relief.
Stablecoin and Institutional Moves. New launches (Open USD) and tokenized deposit progress continued; Strategy’s Bitcoin accumulation remained in focus.
China and Global Macro Data. Q2 GDP, trade, and retail sales prints from China, plus US housing and sentiment data, shaped the broader growth picture.
Tokenization and AI-Crypto Overlap. Franklin Templeton’s move onto BNB Chain and continued miner AI pivots extended the TradFi-crypto-AI convergence theme.
💬 Comment
Cooling inflation did more for sentiment this week than any single crypto catalyst. Softer CPI and PPI eased rate-hike fears just as ETF flows turned positive for the first time in two months, for the week ending July 12. Section 11 shows what happened after. The Iran-linked oil spike tested the mood early on but faded without lasting damage. None of this settles the on-chain question, though. Headlines set the backdrop; the sections below decide whether Bitcoin’s demand actually improved. Section 3 picks up the general market update next. One positive ETF week doesn’t confirm a trend. Two would.
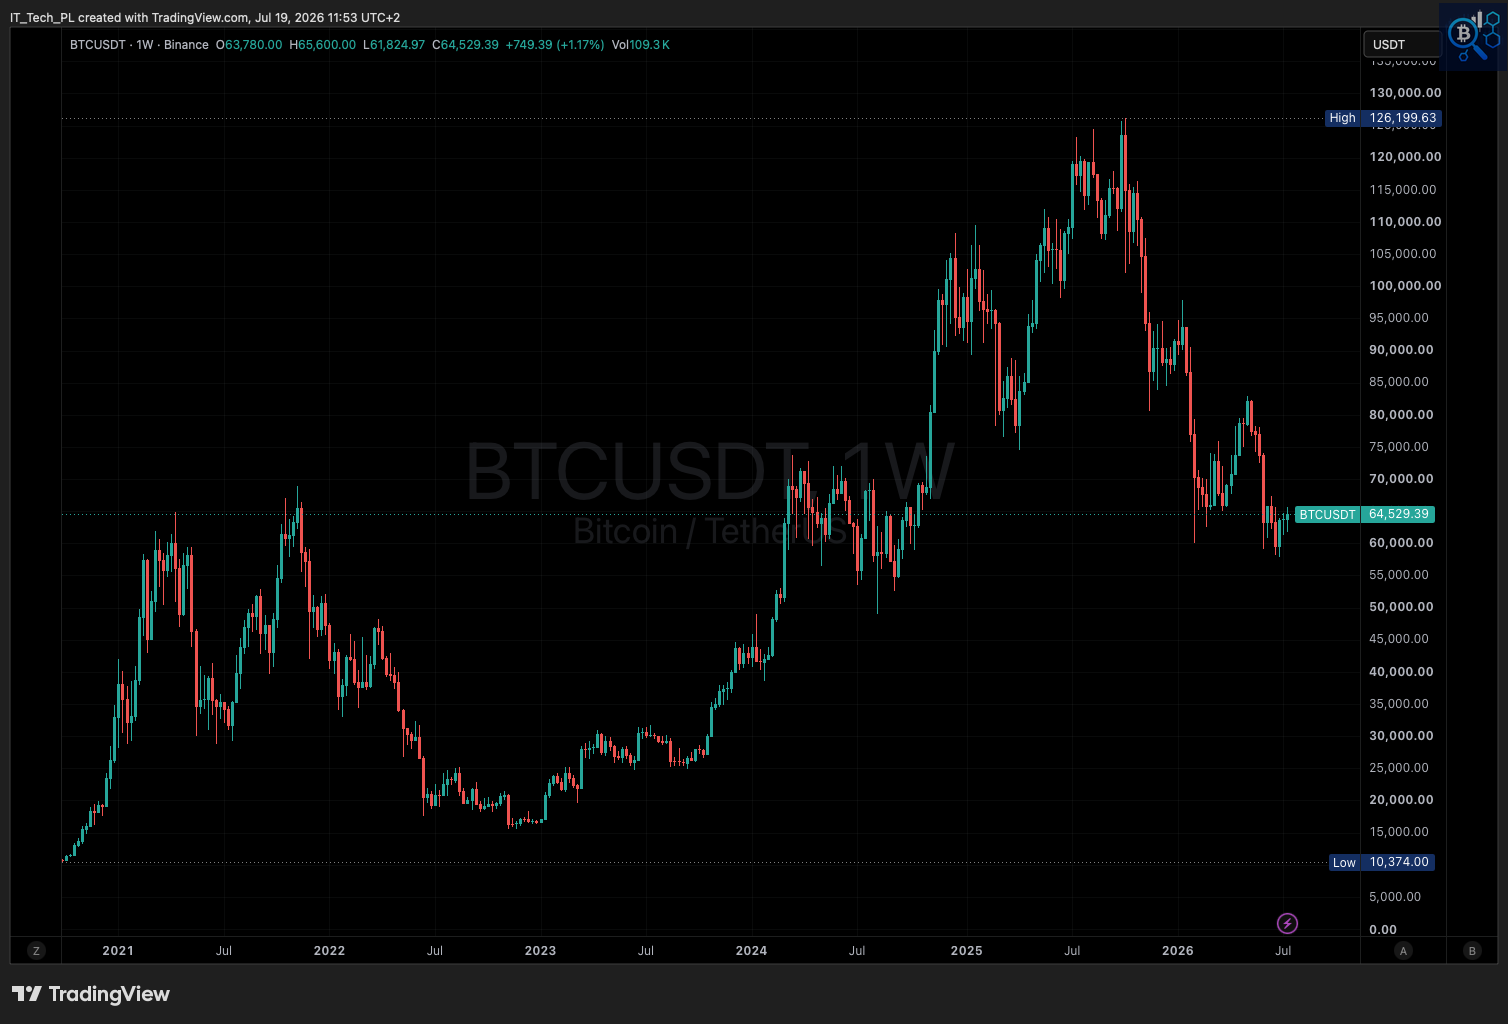
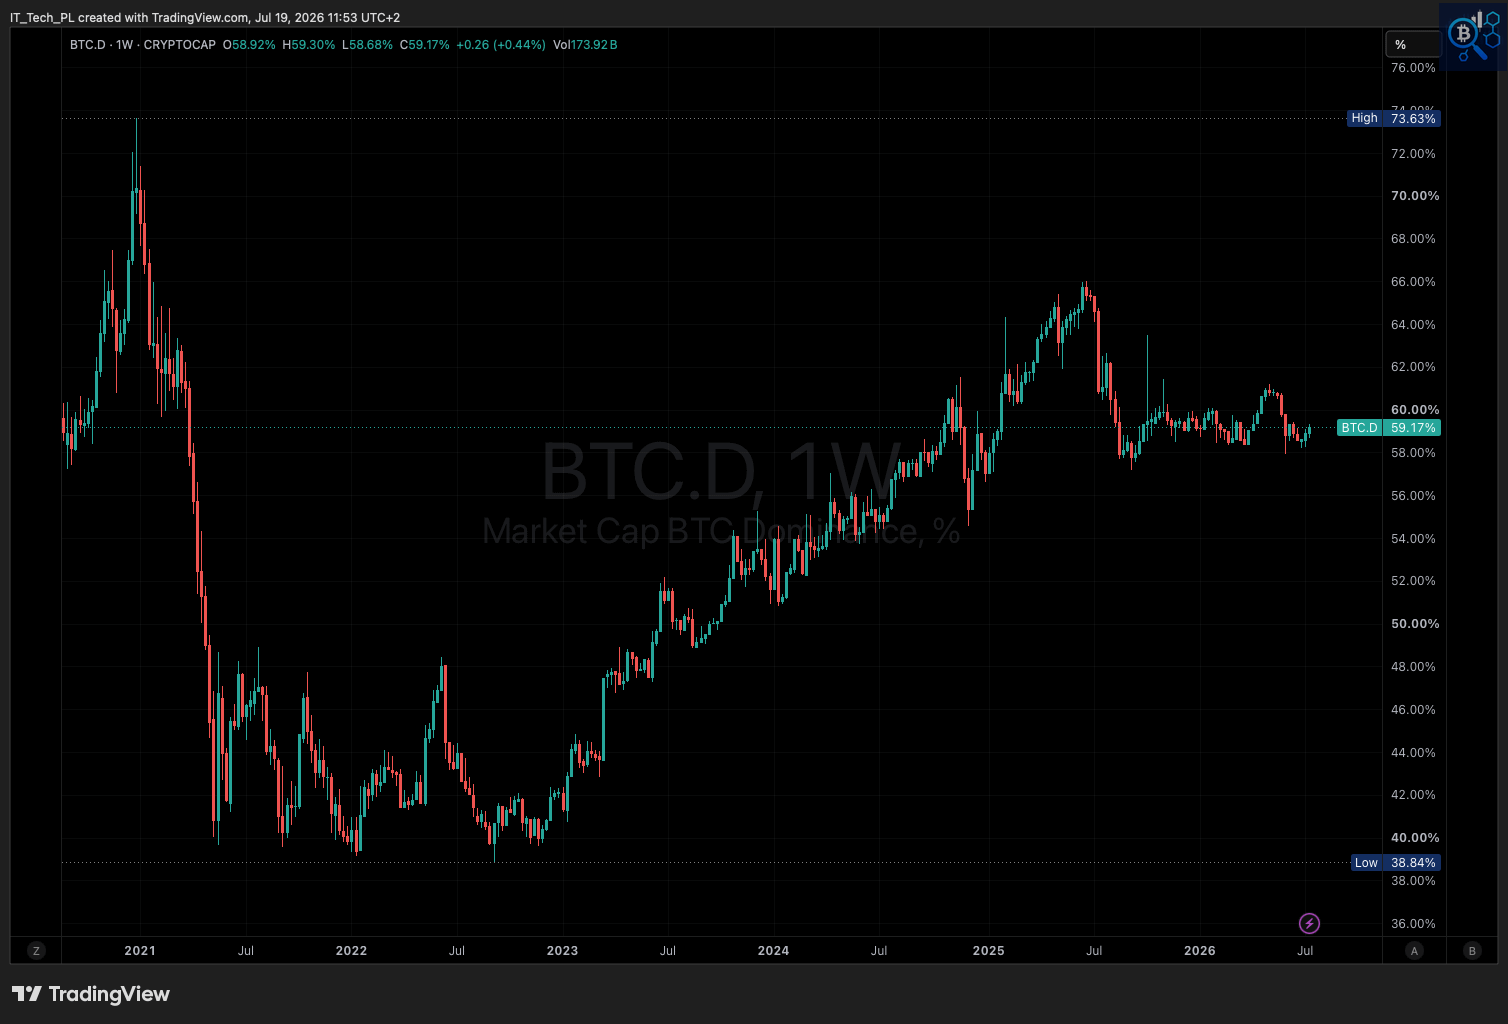
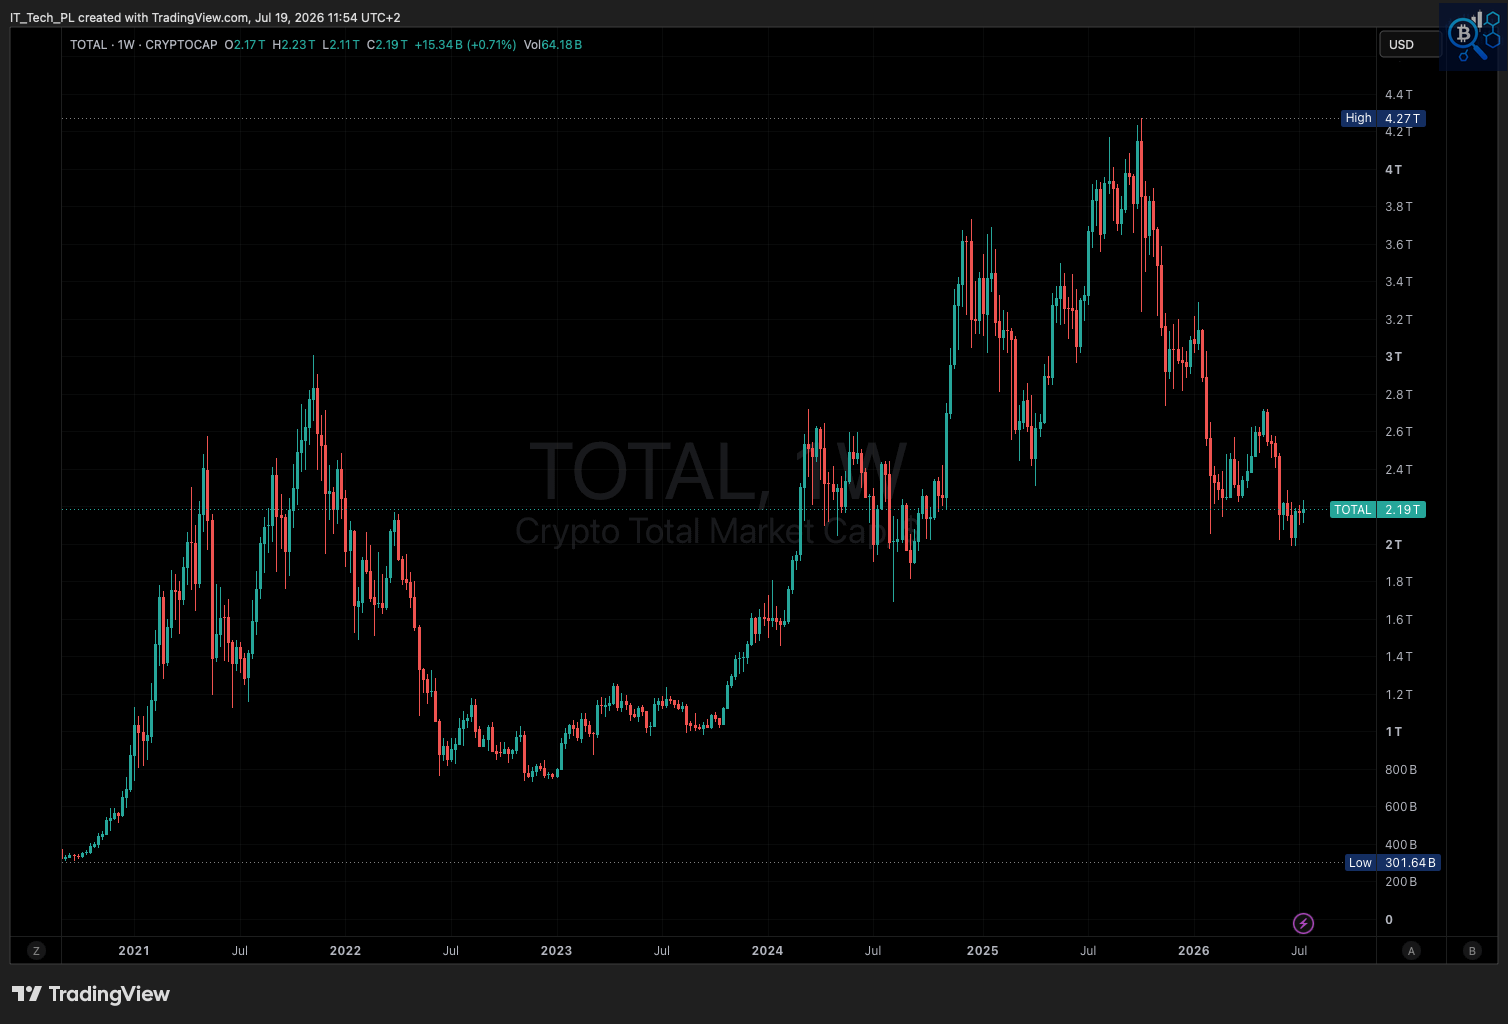
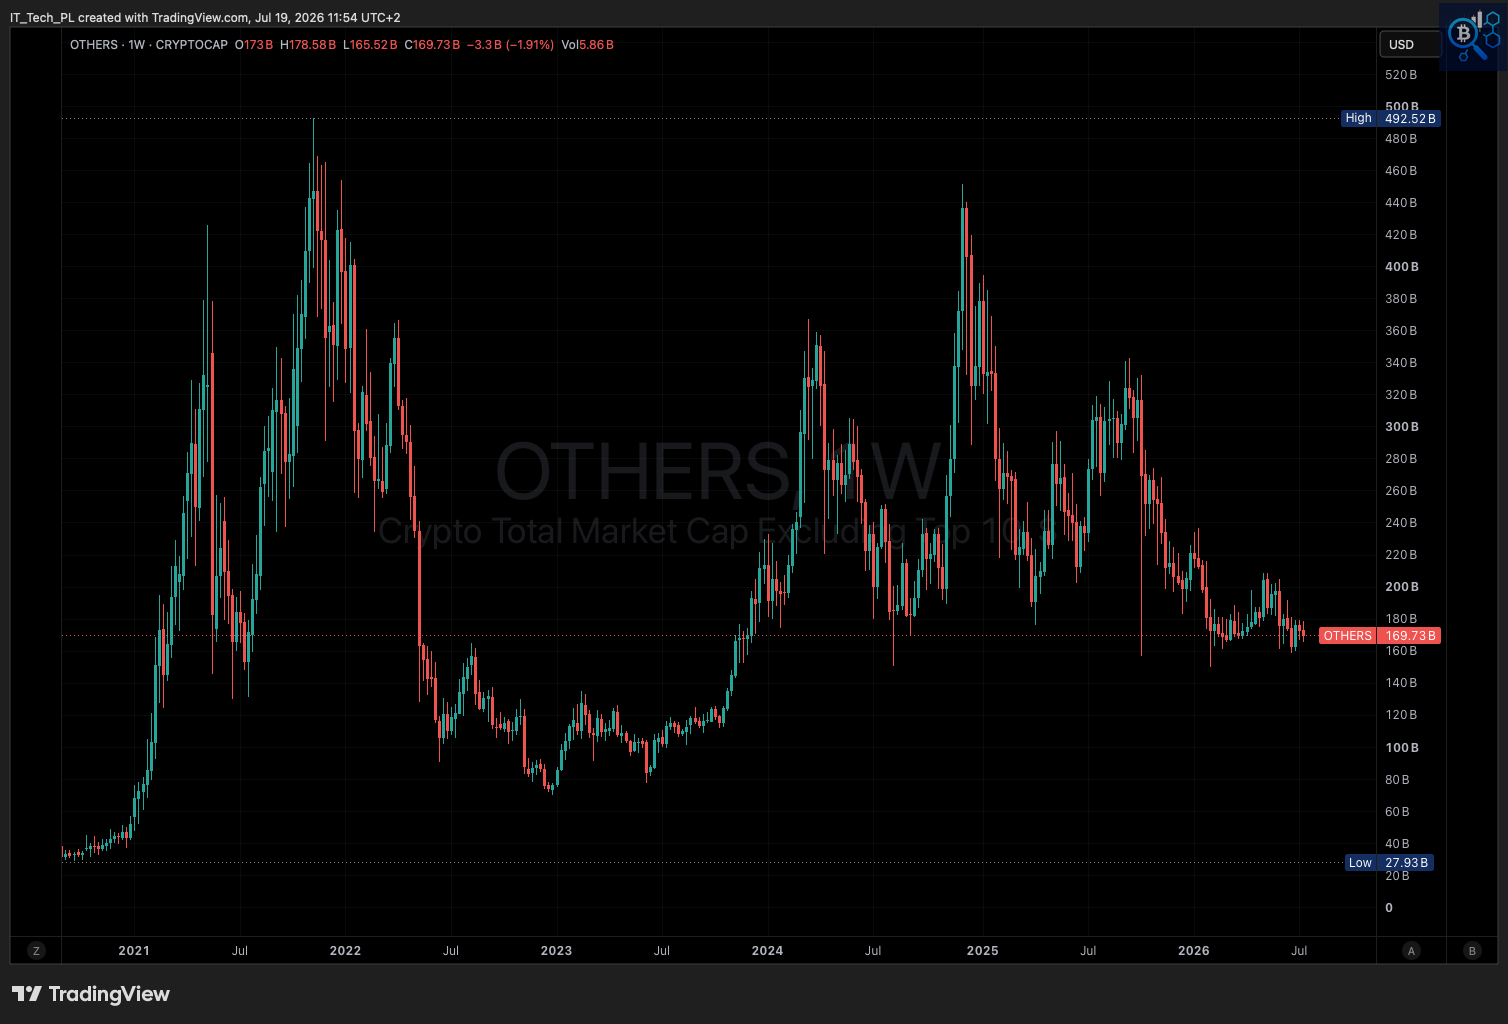
Bitcoin holds its range while altcoins carry the week's losses.
Current state (still-open weekly candle at the time of writing, Sunday)
BTC: $64,529 | WoW +1.17% | ATH $126,199 (-48.9%), range $61,825-$65,600
BTC.D: 59.17% | WoW +0.44pp | cycle high 73.63%, still range-bound since spring
TOTAL: $2.19T | WoW +0.71% | ATH $4.27T (-48.7%)
OTHERS: $169.73B | WoW -1.91% | ATH $492.52B (-65.5%), the week’s weakest reading
Key levels: Bitcoin support $61,800 (this week’s low), resistance $65,600-70,000
💬 Comment
Bitcoin spent the week inside a familiar band, bouncing off $61,800 without testing the $65,600-70,000 resistance shelf that has capped every rally since the correction from $126,200 began. Dominance barely moved. On its own, that would read as a quiet week, except OTHERS (Crypto Total Market Cap Excluding Top 10) fell almost 2% while Bitcoin gained more than 1%, a gap the BTC.D print doesn’t capture. Capital is sitting in Bitcoin and stablecoins, not rotating into altcoins. The heatmap below shows exactly where that weakness is concentrated. OTHERS needs to outperform Bitcoin before weak breadth stops being the base case.
Crypto Heatmap TOP 300 Coins (7D).
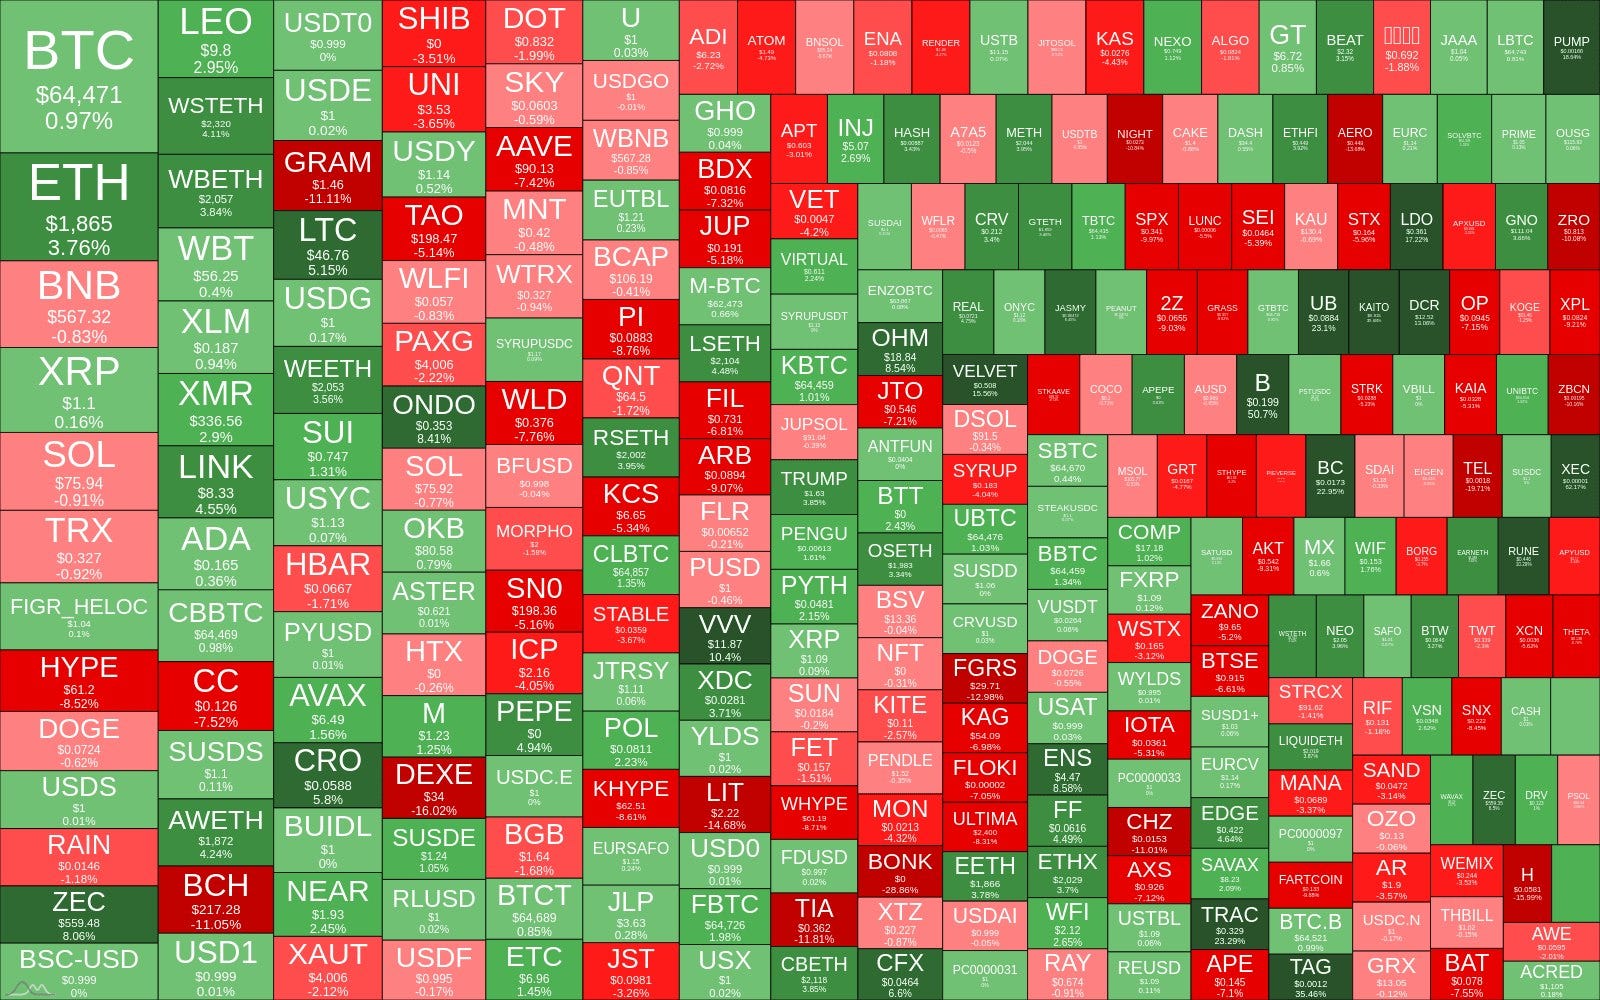
Bitcoin and Ethereum green, majors mixed, and red concentrated in mid- and small-caps.
Current state:
BTC +0.97% ($64,471) | ETH +3.76% ($1,865) - Ethereum leading this week
Majors: LTC +5.15%, CRO +5.80%, BNB -0.83%, SOL -0.91%, TRX -0.92%
Notable green: SBTC +50.7%, ZEC +8.06%, VVV +10.4%, OHM +8.54% - no shared theme
Notable red: BONK -28.9%, LIT -14.7%, FGRS -13.0%, DEXE -16.0%, GRAM -11.1%
💬 Comment
Ethereum’s 2.8-point lead over Bitcoin this week is the one break from the pattern in Section 3, but it doesn’t extend to the rest of the top 300. Red is concentrated in low-liquidity mid-caps like BONK, LIT, and DEXE, with no sector in common, while the handful of large green moves in SBTC and VVV look isolated rather than thematic. Spot and futures structure is up next, in Section 4. Green needs to cluster into an actual sector before this stops being a two-coin story.
I built a free on-chain dashboard on CryptoQuant. Bitcoin macro metrics, NUPL, SOPR, STH cost basis, exchange flows, and much more - all in one place. No noise. Just the data I actually track.
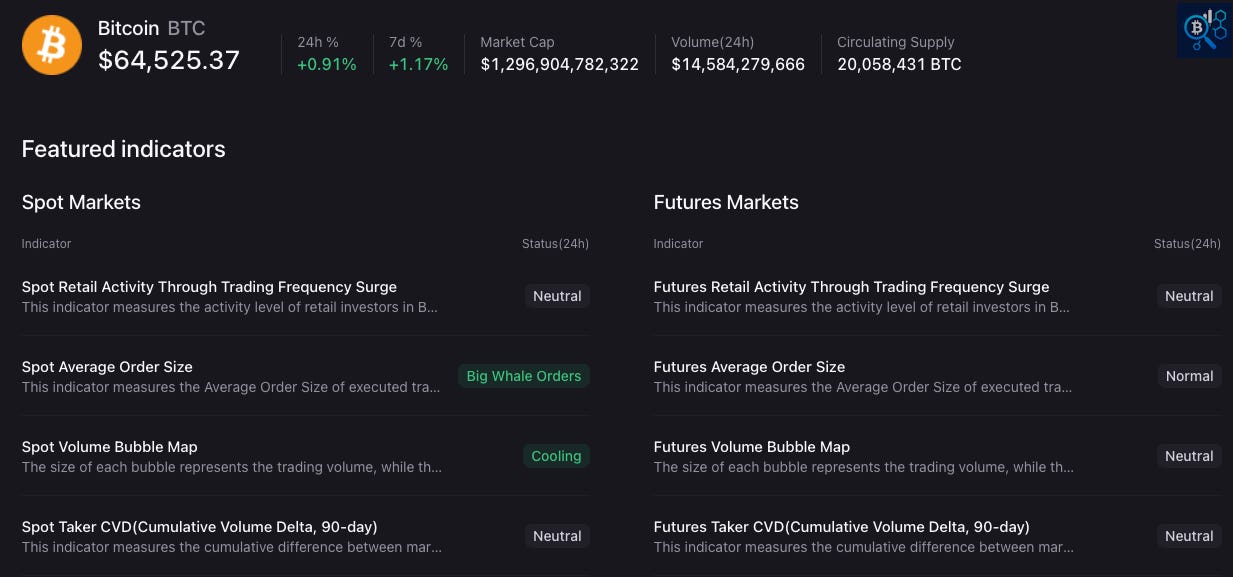
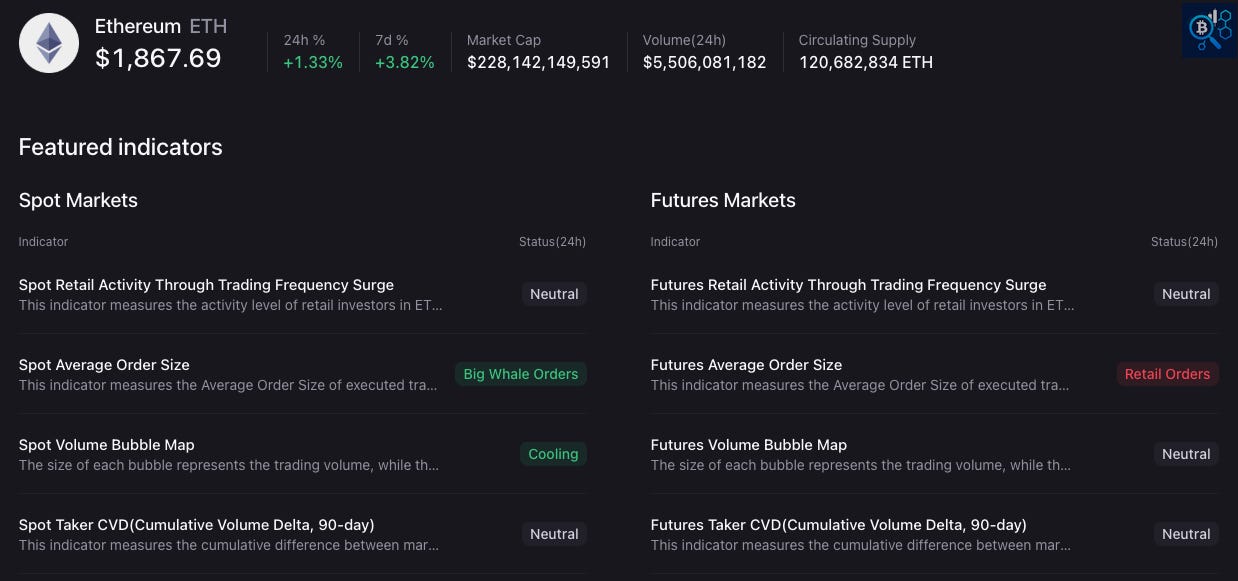
Large buyers keep showing up in spot books, but futures activity tells a different story.
Current state
Bitcoin ($64,525.37, +1.17% 7D): spot order flow whale-sized, spot volume cooling, futures order size normal, taker CVD neutral on both books (90-day)
Ethereum ($1,867.69, +3.82% 7D): spot order flow also whale-sized and cooling, futures order size reads retail, taker CVD neutral on both books (90-day)
💬 Comment
The gap between spot and futures order size stands out this week. Whale-sized buyers keep showing up in both Bitcoin and Ethereum spot books, while futures stay retail-sized, most visible in Ethereum where futures orders read outright retail against Bitcoin’s more neutral print. Taker CVD holds neutral across all four books over the past 90 days, so neither side is forcing net aggressive buying or selling. Whale spot demand paired with cooling volume is consistent with quiet accumulation, not a chase. Sector performance is next, in Section 5. Quiet accumulation remains the most likely interpretation until that spot buying shows up in higher volume too.
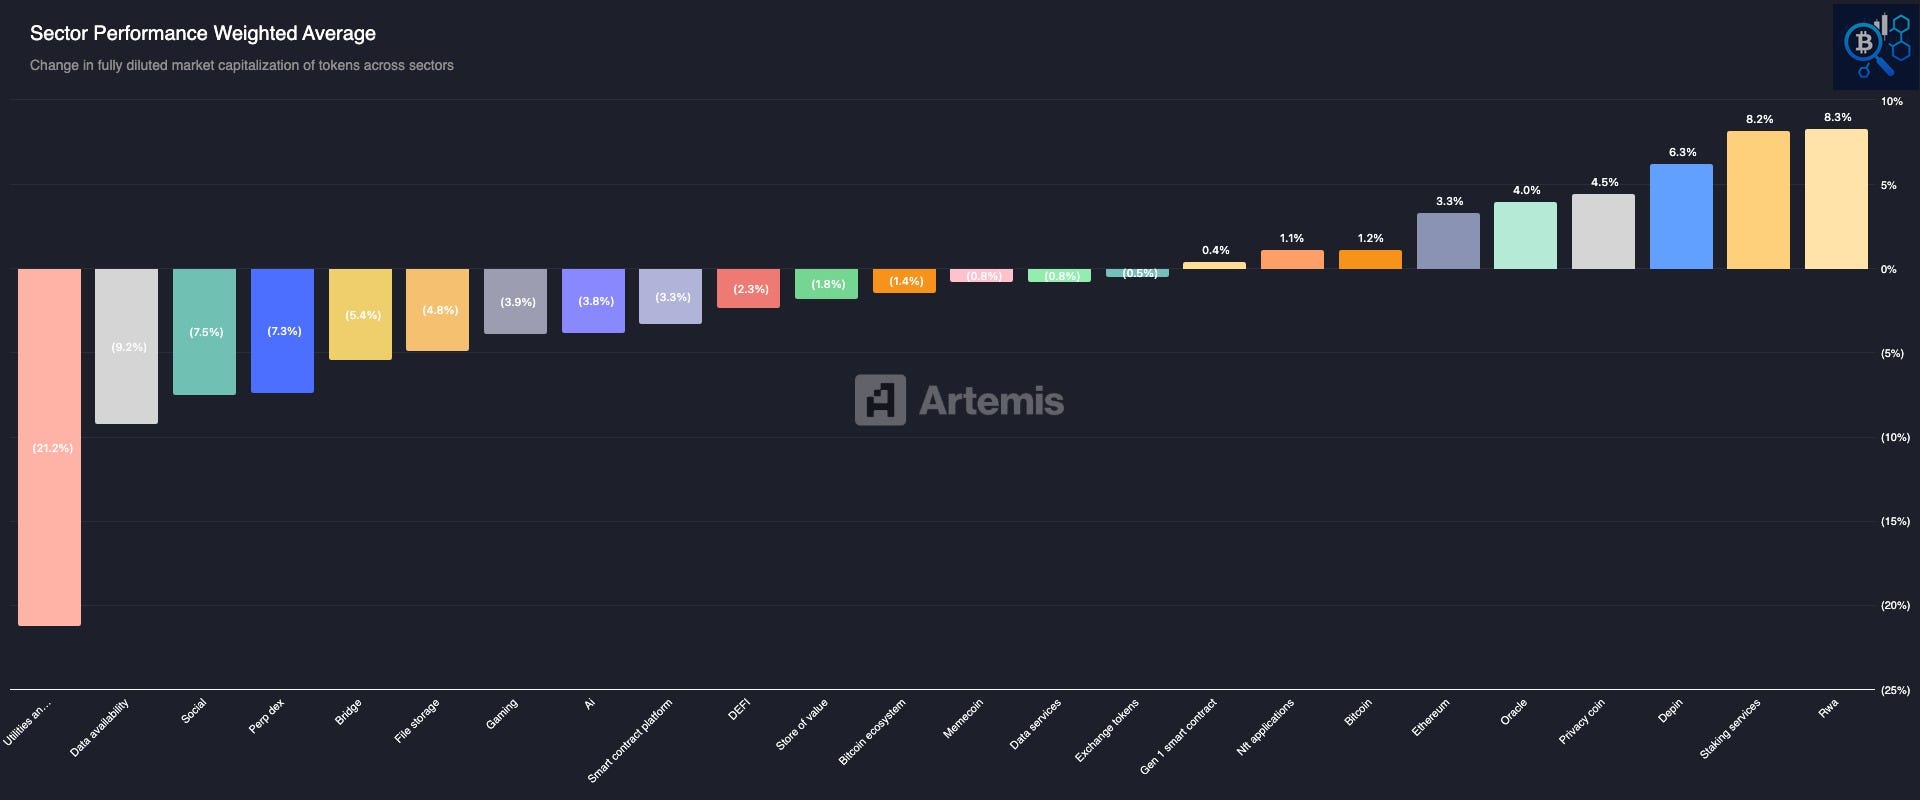
Sector Performance – Weighted Average, last 7 days
(Change in fully diluted market cap by sector, weighted by token size)
Only 9 of 24 Sectors Green as Utilities Craters 21%. Breadth flipped sharply weaker this week, with one sector doing most of the damage.
Current state
Positive (9 of 24): RWA +8.32%, Staking services +8.21%, DePIN +6.28%, Privacy coin +4.45%, Oracle +4.00%, Ethereum +3.35%, Bitcoin +1.15%, NFT applications +1.12%, Gen 1 smart contract +0.41%
Negative (15 of 24): Utilities and services -21.20%, Data availability -9.19%, Social -7.46%, Perp dex -7.33%, Bridge -5.40%, File storage -4.85%, Gaming -3.85%, AI -3.76%, Smart contract platform -3.27%, DeFi -2.29%, Store of value -1.75%, Bitcoin ecosystem -1.43%, Memecoin -0.76%, Data services -0.75%, Exchange tokens -0.45%
Weighted average across all 24 sectors: -1.52%, still -0.66% even excluding the Utilities outlier
💬 Comment
This is the opposite of healthy market breadth. 15 of 24 sectors closed lower, and even setting aside the Utilities and services sector’s 21% drop, the average sector move stays negative. RWA and Staking services top the board, but neither is large enough to offset broad-based weakness elsewhere, and Perp dex’s second straight rough week alongside slipping Bitcoin ecosystem tokens shows the retreat isn’t confined to one corner of the market. This tracks with the OTHERS weakness in Section 3 and the retail pullback further down in this issue. What follows moves into the premium section, starting with cost basis levels. A third of the sectors green in the same week would change that read. We’re not there.
🔐 Premium Insights
🧠 The free section shows what happened. The premium section shows whether it means anything.
If you're only reading the free section, you're seeing the bounce. Premium explains why nothing behind it has confirmed it yet: retail demand, US spot flow, and short-term holder behavior, all in one place.
Premium is where price action gets context.
Comments
Nothing yet. Say the first thing.
Sign in to join the conversation.