
Bitcoin clawed back from $57.7K to the $62K-$64K range this week, and on the surface, it looked like a real recovery. Equities agreed; the Dow closed above 53,000 for the first time. But scratch the surface, and the story changes. Dominance held flat instead of breaking out. The heatmap showed green almost exclusively in Bitcoin and Ethereum.
Legacy and speculative sectors fell hard while only the core assets held up. Price still sits below where short-term holders and ETF buyers built their positions, a condition running six months deep, not a fresh crack. Futures demand turned positive after a brutal June trough, but spot demand and the Coinbase premium stayed negative. ETF flows finally turned positive too, after nine straight weeks of outflows, but barely.
This isn't a confirmed turn. It's a market recovering in a narrow lane, and this issue walks through exactly why. Welcome to the 185th issue of On-chain Insights by IT Tech.
This Week in On-Chain:
Bitcoin remains below both the short-term holder ($70.5K) and ETF ($71.8K) cost basis, a condition persisting for roughly six months rather than a fresh cross
The broader on-chain indicator dashboard leans bearish, with eleven of fifteen readings negative, and technical indicators sweeping bearish entirely
Futures demand turned positive after a deep June trough, but 30-day spot demand growth remains negative, pointing to a leverage-led rather than spot-led bounce
The Coinbase premium stayed negative for both BTC and ETH, showing no confirmed US-based spot buying pressure
Bitcoin ETF flows turned positive for the first time in nine weeks, though the inflow is small against nearly $8.7B in prior outflows
Stablecoin supply grew week over week but remains down on a monthly basis and below its all-time high
🎥 YouTube: Onchain_Insights - English | IT Tech PL - Polish | Hub: btc-analysis.com
I share structured trade ideas for Bitcoin and Ethereum aligned with the on-chain framework used in this report. Access is free via one of the partner exchanges. Both exchanges are regulated in the European Union.
Bybit.eu 🇪🇺 EU users (EEA) - claim up to 40 USD 🎁 in BTC
OKX.com - MiCA and MiFID II licenses - Spot and derivatives trading in the EU 🇪🇺
*Disclaimer: Educational content only. Not investment advice. Past performance does not guarantee future results.
A resilient week across risk assets, with Bitcoin rebounding and equities hitting new records, even as softer labor data and geopolitical friction kept the inflation outlook complicated.
Bitcoin rallied roughly 10% from early-month lows near $57.7K to trade in the $62K-$64K range by mid-week, supported by improving sentiment and ETF inflows.
Ethereum and altcoins were mixed. ETH held $1,700-$1,800 with some institutional buying (SharpLink resumed purchases), while ADA, Bitcoin Cash, and select meme coins posted strong weekly gains as total market cap stabilized near $2.2T.
Institutional and regulatory news added to sentiment: Morgan Stanley entering spot crypto ETFs, Crypto.com partnering with Stripe on payments, PwC expanding crypto services, and continued progress on the CLARITY Act.
The Dow Jones closed above 53,000 for the first time on July 6 (+0.3% to ~53,056), the S&P 500 rose ~0.7% to ~7,537, and the Nasdaq advanced ~1.1% to ~26,121, led by an AI/semiconductor rebound.
Tech and AI names carried the week’s gains despite light holiday-shortened volume; SpaceX was added to the Nasdaq-100, and broader indexes posted 1.3%-1.8% weekly gains in some recaps.
Sector rotation continued, with tech optimism balanced by renewed interest in “old economy” names like Caterpillar, ahead of upcoming bank earnings.
June US nonfarm payrolls came in at just +57K, well below the ~110K-115K expected, with downward revisions to prior months. Unemployment ticked up to 4.2%, partly on lower labor force participation.
The IMF’s July 2026 World Economic Outlook projected 3.0% global growth for 2026 and 3.4% for 2027, citing tech/AI resilience but flagging war-related shocks and stalled disinflation as risks.
The Fed’s July 10 Monetary Policy Report described inflation as still elevated above target due to tariffs, Middle East-driven energy costs, and AI-related chip prices, while holding rates steady at 3.5%-3.75%.
Middle East tensions, particularly around the Strait of Hormuz, kept oil and energy prices volatile, adding upside risk to inflation forecasts even as AI-driven growth optimism persisted.
💬 Comment:
The week’s data paints two stories running in parallel. Equities pushed to record highs on AI-led sector strength, and Bitcoin staged a sharp recovery back above $62K on improving sentiment and ETF demand, yet the macro backdrop underneath both moves got messier, not cleaner. A payroll miss of this size (+57K against 110K+ expected) usually reads as a green light for rate cuts, but it’s landing next to a Fed report that still describes inflation as elevated, with tariffs, Middle East energy costs, and AI-driven chip prices all pushing the other way. That combination- growth resilience per the IMF, a cooling labor market, and sticky inflation- is the kind of setup where risk assets can rally on liquidity hopes even as the underlying data doesn’t fully support it. Section 3 picks up where this leaves the BTC price structure. Until the jobs-versus-inflation tension resolves one way or the other, this kind of two-sided market remains the base case.
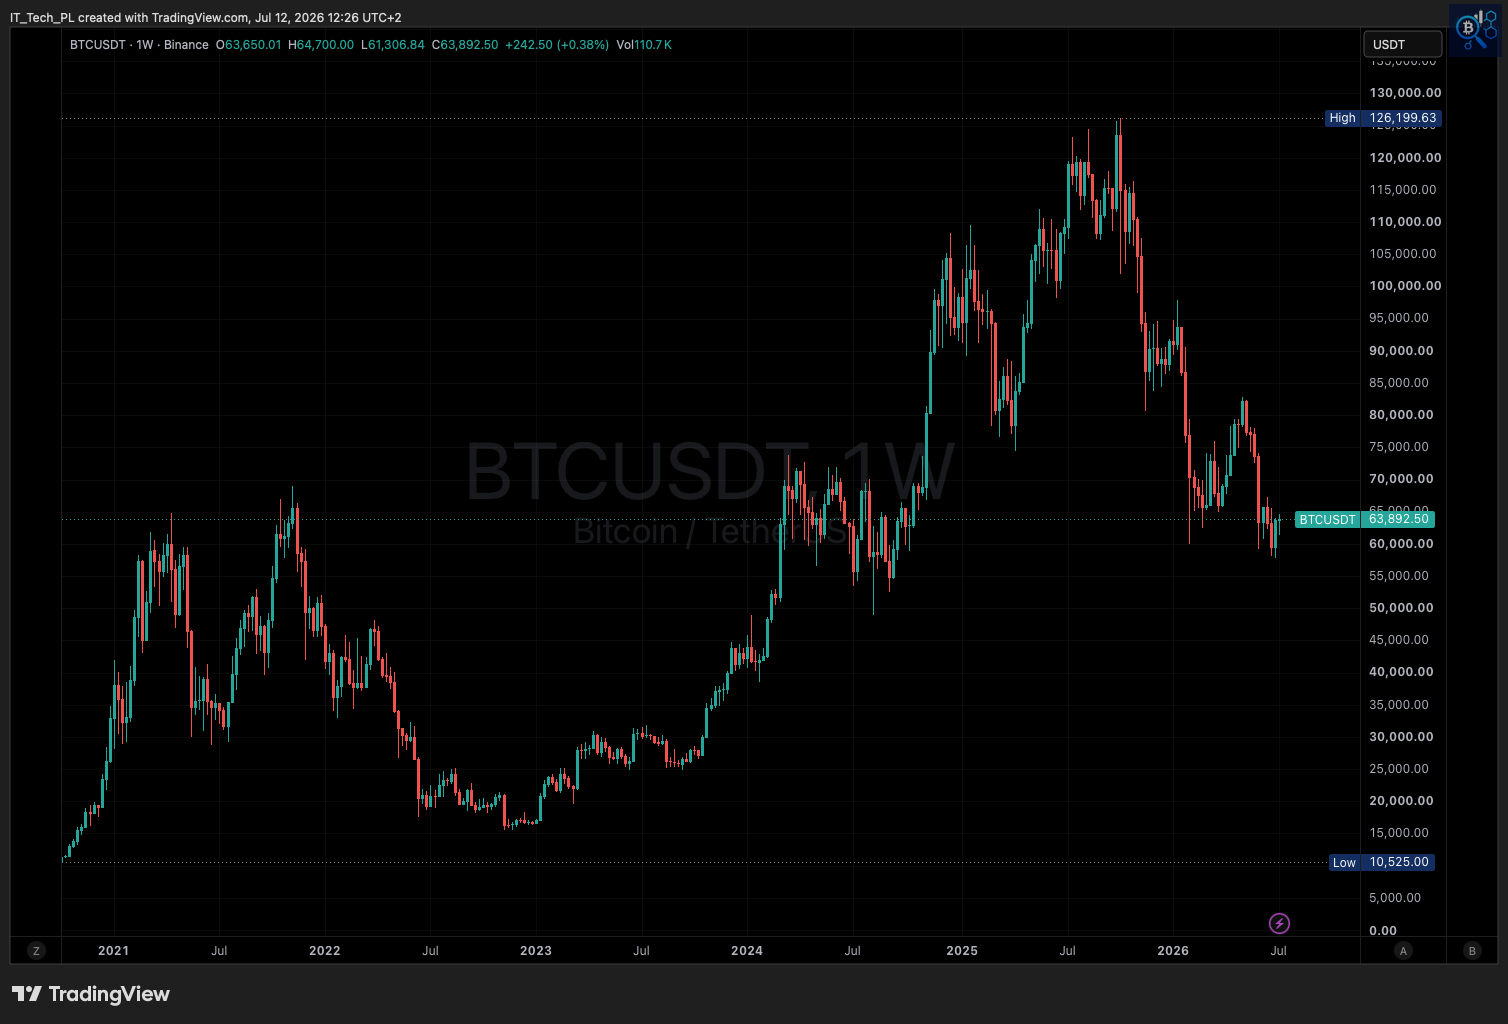
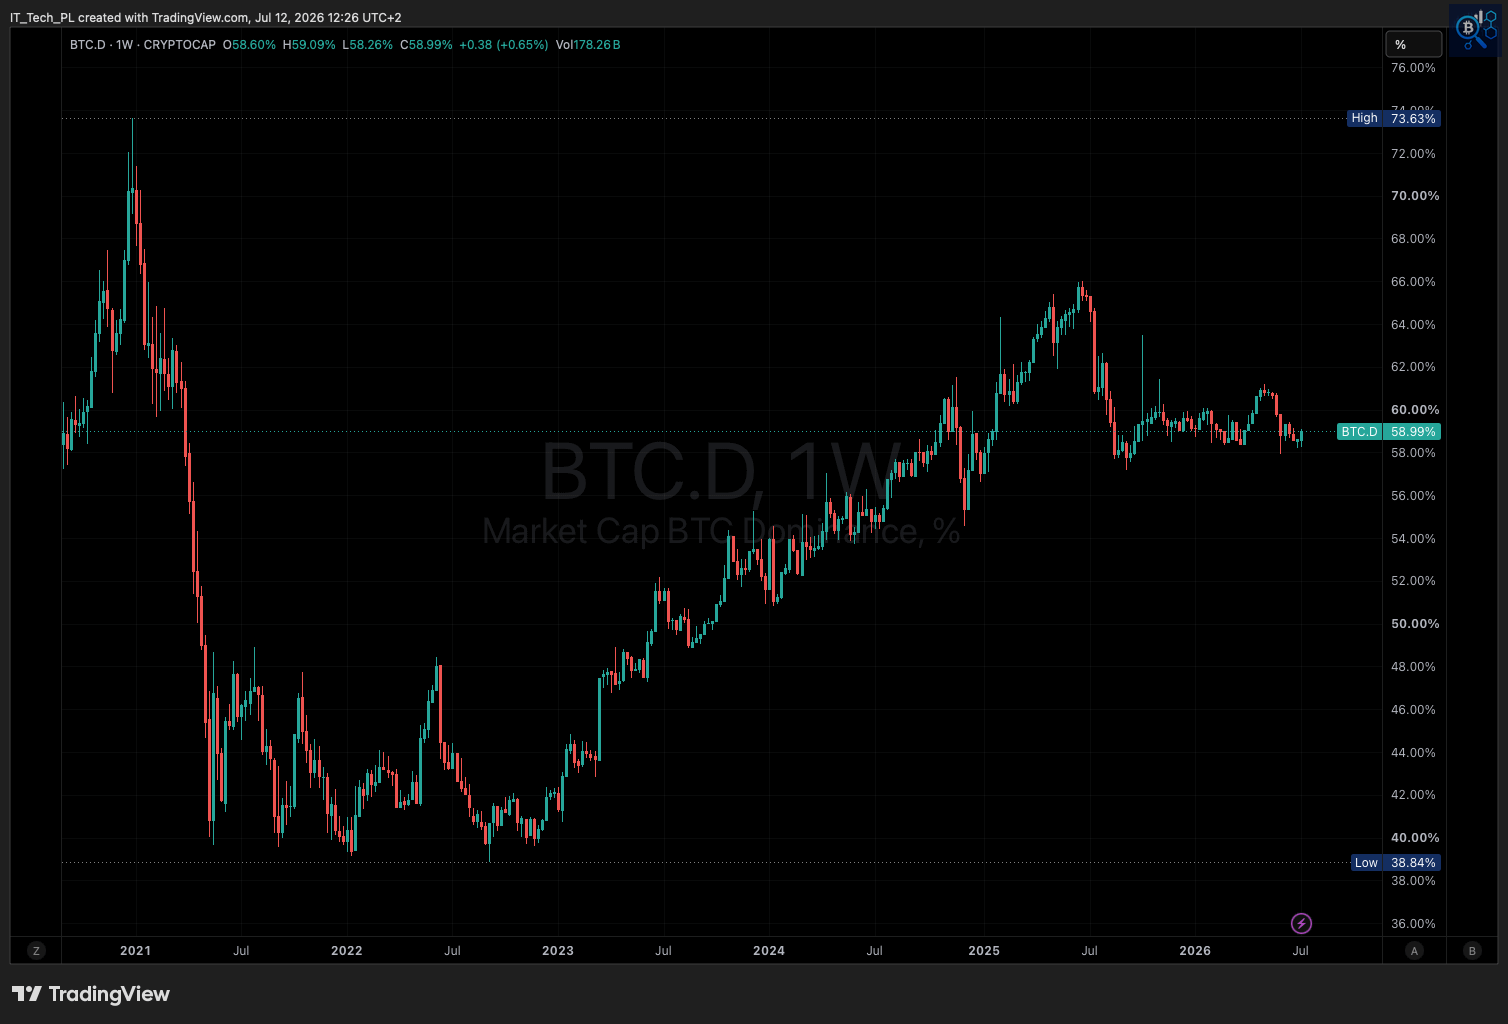
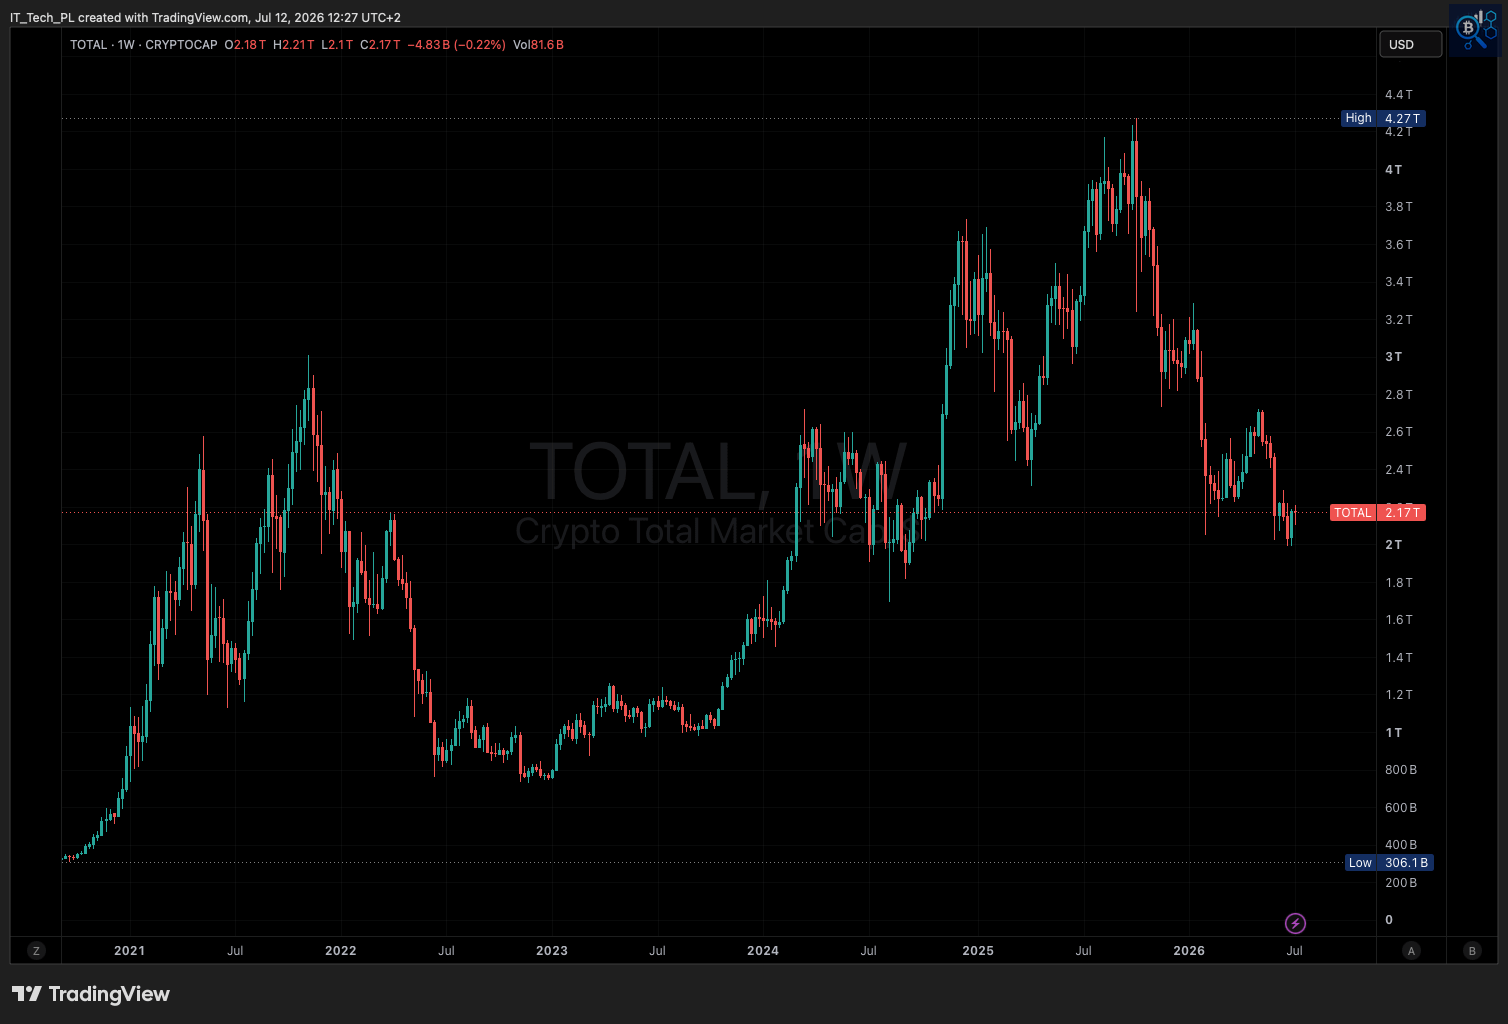
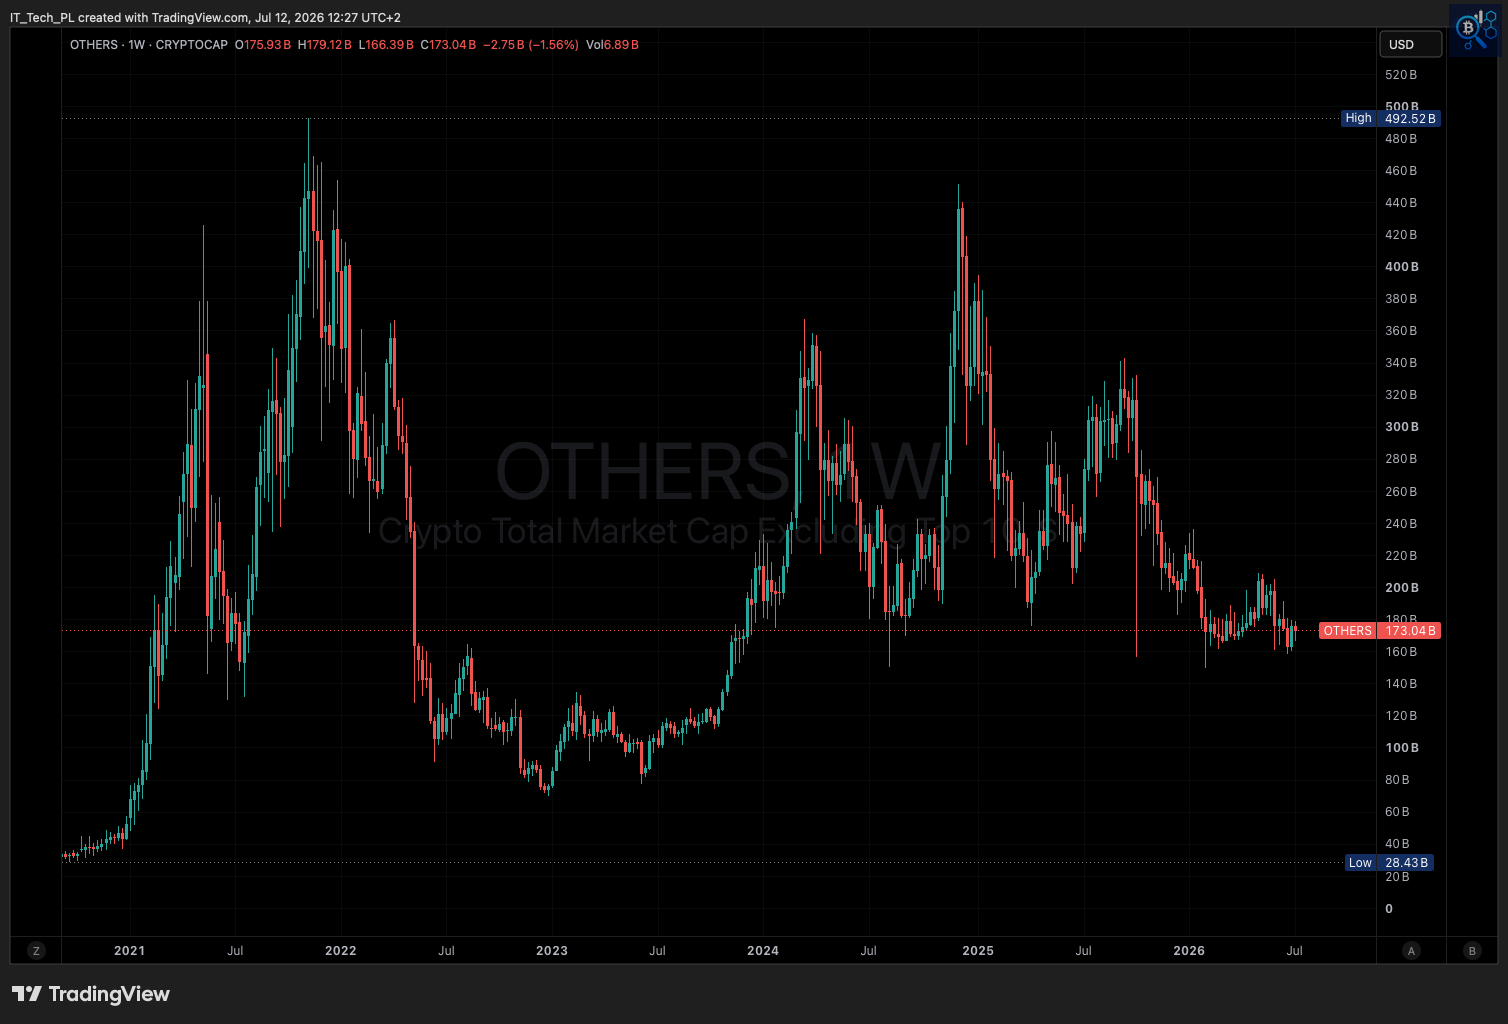
Bitcoin holds the $62K-$64K range this week after the early-July bounce, while dominance and the broader altcoin market stay range-bound below their prior highs. Weekly candle still open at the time of writing (Sunday).
Current state:
BTC: trading at $63,892.50 (+0.38%), weekly range $61,306.84-$64,700, holding above the $62K-$64K zone flagged in this week’s news recovery.
BTC.D: 58.99% (+0.65%), consolidating in the 58%-60% band that has held since early 2026, well below the 2021 high of 73.63%.
TOTAL market cap: $2.17T (-0.22%), roughly half of the 2025 all-time high of $4.27T.
OTHERS (altcoin market ex-top 10): $173.04B (-1.56%), also well off its 2025 high of $492.52B and near the lower half of its multi-year range.
Key levels:
BTC resistance: prior all-time high near $126,200, a distant reference; the more immediate test is reclaiming the $64K-$65K zone, the top of this week’s weekly range.
BTC support: the early-July low near $57.7K-$58K referenced in this week’s news, which also lines up with the bottom of the current weekly range.
BTC.D: 58%-60% remains the operative range; a break above 60% would mark a shift toward renewed BTC dominance, a drop below 58% would favor altcoins.
TOTAL/OTHERS: both sit in the lower half of their 2024-2025 ranges, with no confirmed reversal structure yet on the weekly chart.
💬 Comment:
Price action this week matches the tone from the news flow: Bitcoin recovering, altcoins mixed, no clean breakout in either direction. BTC's bounce from the low $57Ks back to the $62K-$64K zone is a genuine recovery in percentage terms, but dominance sitting flat at 58.99% inside a range it has held for months tells a more cautious story than the price move alone. If this were a broad risk-on rotation, dominance would typically be falling as capital moved into altcoins, not holding steady. TOTAL and OTHERS both remaining near the lower half of their multi-year ranges, well under their 2025 highs, reinforce that this looks more like a corrective bounce within a larger consolidation than the start of a new expansion phase. Section 4 turns to spot and futures structure next, where order flow data will help confirm whether this bounce is backed by real demand or driven mostly by short covering. Until dominance breaks decisively out of the 58%-60% band, a two-sided, range-bound market remains the base case.
Crypto Heatmap TOP 300 Coins (7D).
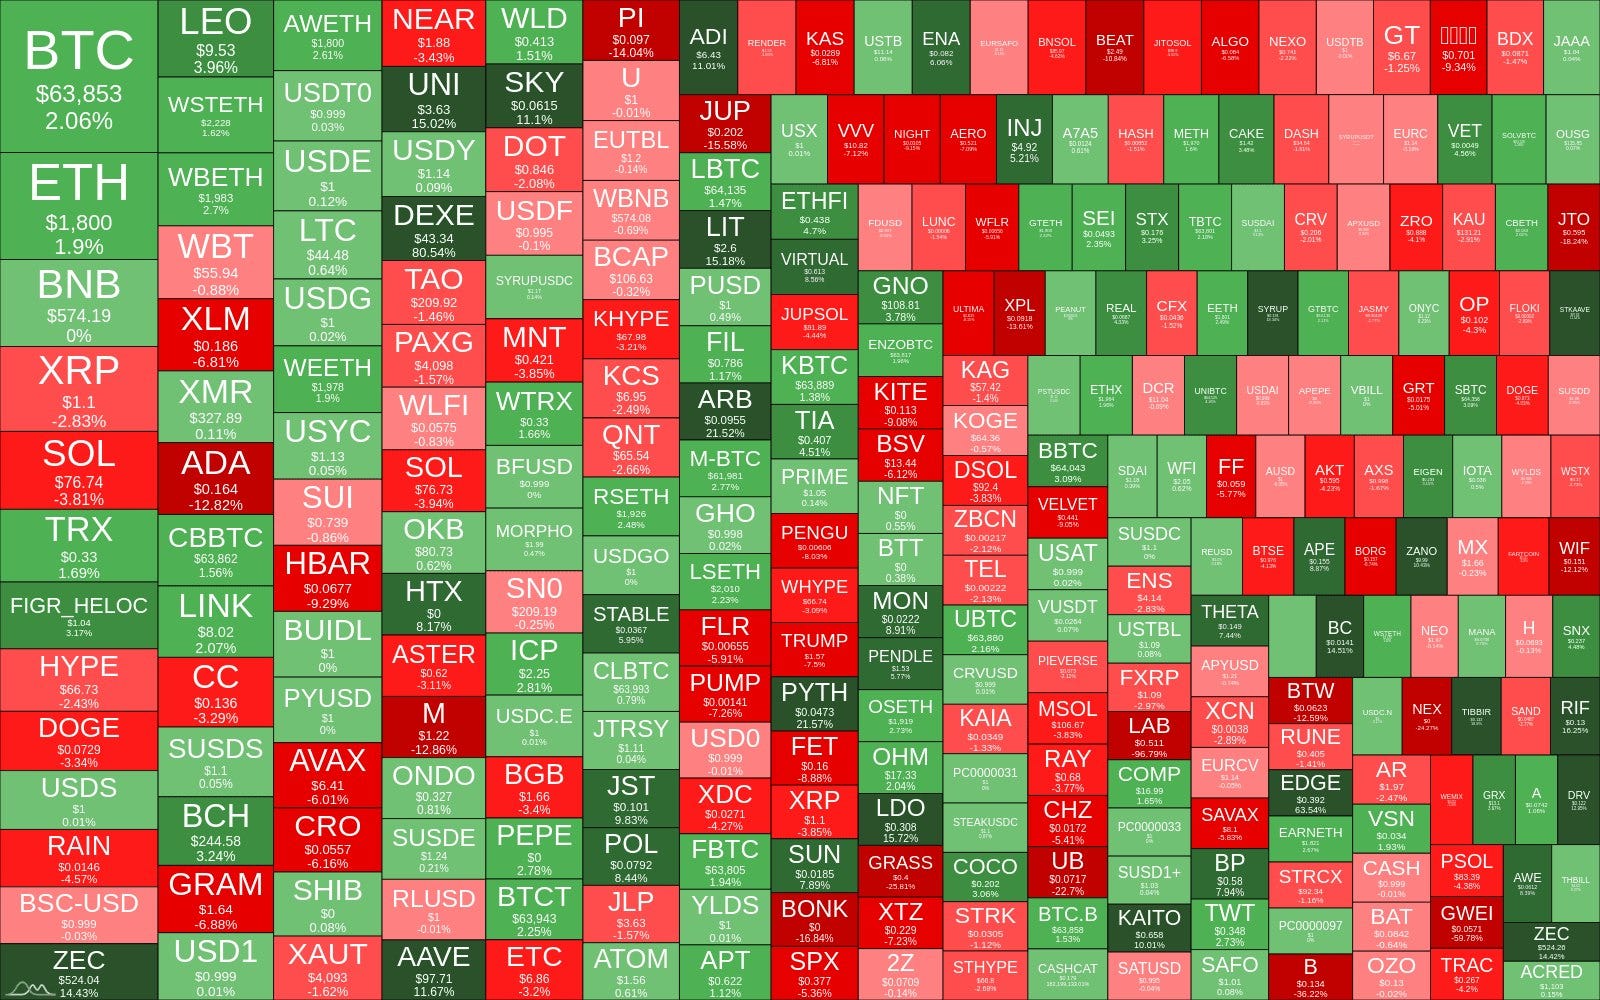
Majors led the tape while most of the broader altcoin field stayed red, keeping breadth narrow rather than broad-based.
Current state:
BTC: $63,853 (+2.06%) | ETH: $1,800 (+1.9%) - both green, leading the board
Majors mixed to weak: SOL -3.81%, XRP -2.83%, ADA -12.82%, AVAX -6.01%, HBAR -9.29%
Notable green outliers: ZEC +14.43%, BCH +3.24%, LINK +2.07%, TRX +1.69% - scattered, no sector clustering
Broader alt field skews red, with several double-digit decliners (ADA -12.82%, HBAR -9.29%, KITE -9.08%)
💬 Comment:
Breadth stayed narrow this week, the opposite of a broad recovery. BTC and ETH carried the green while most of the mid- and large-cap alt field traded red, and the handful of standout gainers (ZEC, BCH, LINK) look idiosyncratic rather than sector-wide. That matches the dominance picture from earlier in this section, BTC.D holding its range rather than breaking down. Until green spreads beyond BTC and ETH into the broader alt field, this remains a majors-led market rather than an altcoin one.
I built a free on-chain dashboard on CryptoQuant. Bitcoin macro metrics, NUPL, SOPR, STH cost basis, exchange flows, and much more - all in one place. No noise. Just the data I actually track.
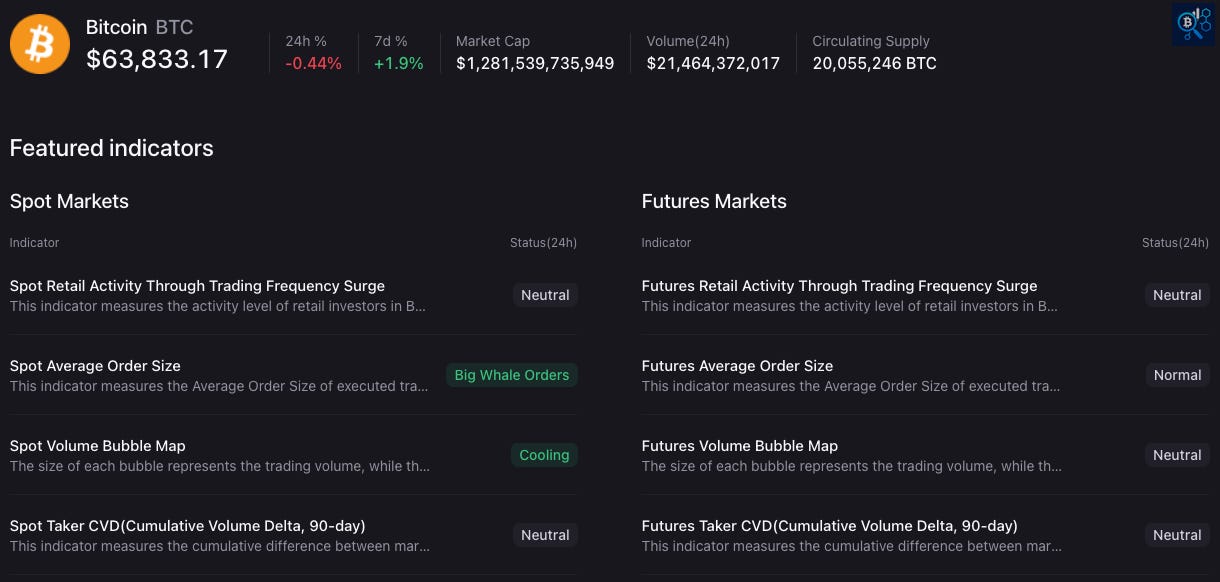
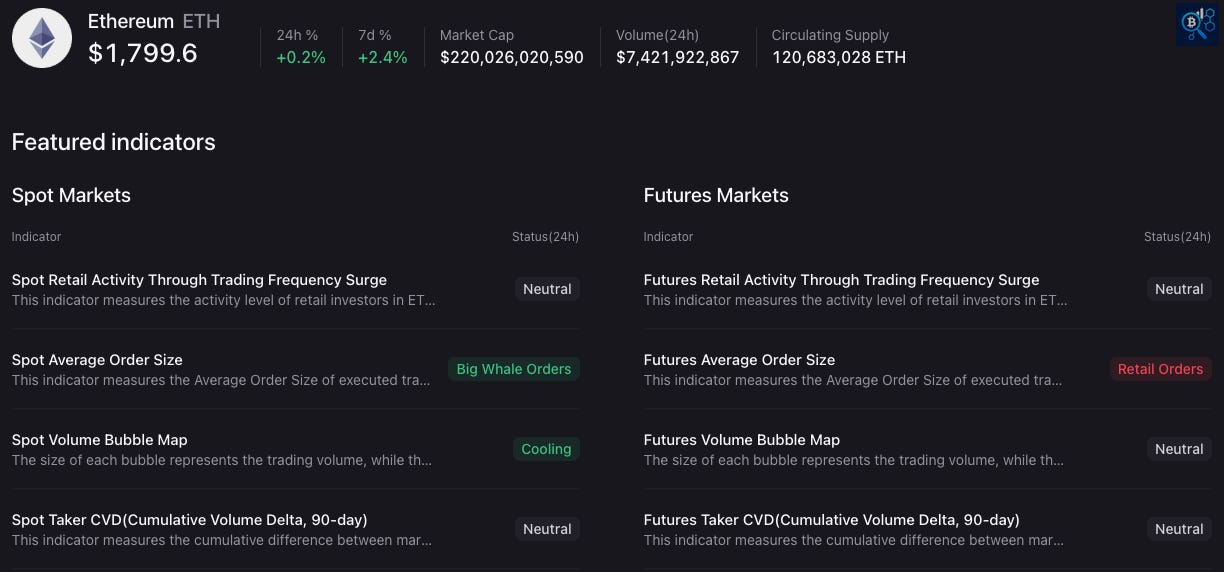
Order flow shows spot markets dominated by large orders while futures positioning stays mostly neutral to retail, a structure that leans toward organic accumulation rather than leveraged speculation.
Current state:
BTC: $63,833.17 (24h -0.44%, 7d +1.9%), market cap $1.28T, 24h volume $21.46B
BTC spot: average order size flagged as Big Whale Orders, volume bubble map Cooling, retail activity and taker CVD both Neutral
BTC futures: average order size Normal, retail activity, volume bubble map, and taker CVD all Neutral
ETH: $1,799.60 (24h +0.2%, 7d +2.4%), market cap $220.03B, 24h volume $7.42B
ETH spot: average order size, also Big Whale Orders, volume bubble map, cooling, retail activity, and taker CVD Neutral
ETH futures: average order size flagged as Retail Orders, retail activity, volume bubble map, and taker CVD Neutral
💬 Comment:
Both BTC and ETH show the same spot-side pattern this week, larger, whale-sized orders driving spot execution while volume itself is cooling. That combination usually points to accumulation at lower conviction volume rather than a chase, fewer but bigger tickets doing the buying. The futures side is where BTC and ETH diverge: Bitcoin’s futures order size stays Normal, but Ethereum’s futures activity is flagged as Retail Orders, suggesting ETH’s 7-day outperformance (+2.4% versus BTC’s +1.9%) is getting more retail-driven leverage support underneath it than Bitcoin’s move. Neither market shows elevated taker CVD or retail surge readings, so there’s no sign of aggressive one-sided pressure in either direction yet. Section 5 looks at sector performance next, where this whale-versus-retail split can be checked against broader capital rotation. Until spot order size or futures positioning shifts more decisively, this reads as a controlled, whale-led recovery rather than a retail-driven one.
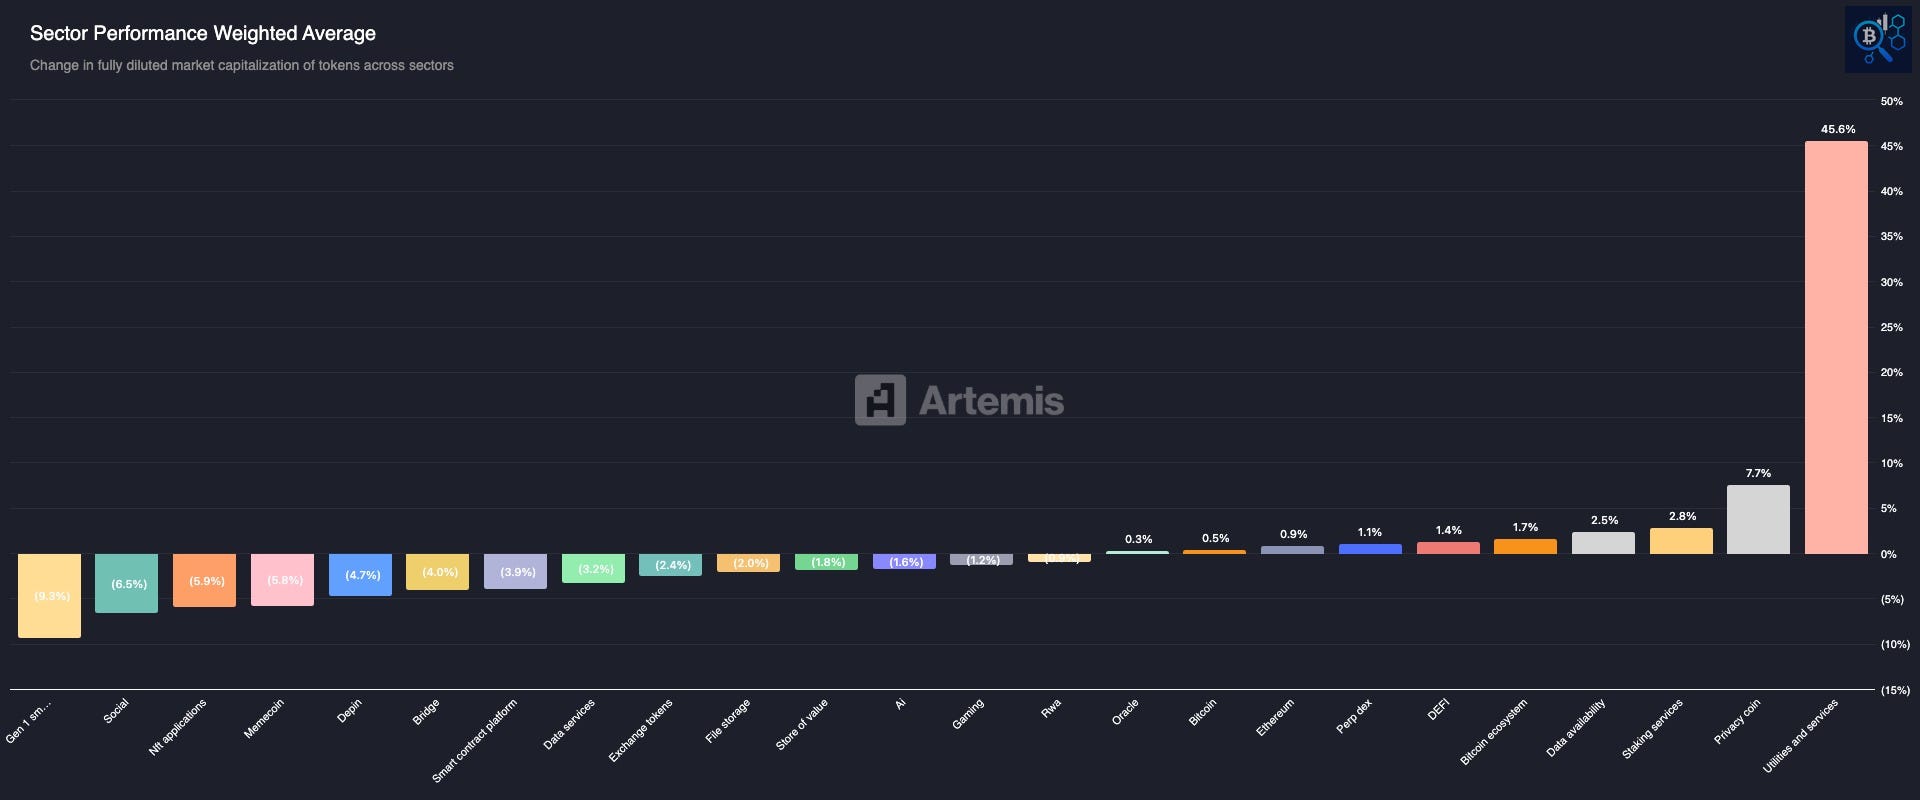
Sector Performance – Weighted Average, last 7 days
(Change in fully diluted market cap by sector, weighted by token size)
Sector-level data shows a lopsided week: the bulk of categories fell while a handful of smaller segments posted outsized gains.
Positive sectors (10): Oracle +0.3%, Bitcoin +0.48%, Ethereum +0.93%, Perp DEX +1.1%, DeFi +1.36%, Bitcoin ecosystem +1.71%, Data availability +2.48%, Staking services +2.83%, Privacy coin +7.66%, Utilities and services +45.6%
Negative sectors (14): Gen 1 smart contract -9.32%, Social -6.51%, NFT applications -5.89%, Memecoin -5.77%, DePIN -4.65%, Bridge -4.0%, Smart contract platform -3.89%, Data services -3.23%, Exchange tokens -2.39%, File storage -1.98%, Store of value -1.76%, AI -1.61%, Gaming -1.2%, RWA -0.87%
💬 Comment:
Fourteen of twenty-four sectors were negative this week, and the worst performers are the legacy and speculative categories: Gen 1 smart contract platforms, social tokens, NFT applications, and memecoins all fell more than 5%. Meanwhile, Bitcoin, Ethereum, and DeFi held modestly positive, consistent with the whale-sized spot order flow seen in Section 4; capital appears to be concentrating in core assets rather than spreading into speculative alt categories. The Utilities and services reading of +45.6% is a standout, but a single-category move of that size in a weighted average usually reflects a small basket or a concentrated outlier rather than a sector-wide trend, worth treating as noise until confirmed over multiple weeks. Privacy coin’s +7.66% is smaller but still notably ahead of the broader field. Taken together, this looks like continued rotation toward quality rather than a broad altcoin recovery.
🔐 Premium Insights
🧠 The free section shows what happened. The premium section shows whether it means anything.
This week's bounce raises a real question: is the structure changing, or is this another corrective move into resistance? The answer is in the on-chain data, Bitcoin's cost basis levels, short-term holder behavior, whale order flow, and where every demand channel (spot, futures, ETF, stablecoins) actually stands, and it's below the paywall.
Premium is where price action gets context.
Comments
Nothing yet. Say the first thing.
Sign in to join the conversation.