
Right after the India-EU trade deal last week, we now have the much awaited India-US Trade Deal locked as well. Together, the two countries accounted for $131.6 billion worth of goods trade in 2025 (calendar year), with the US as India’s largest export destination.
But there’s something critical everyone’s missing.
At InvestorSight, we created this visual to better understand the trade between the two countries and its growth in the last couple of years. (Trade data sourced from India’s Dept. Of Commerce)
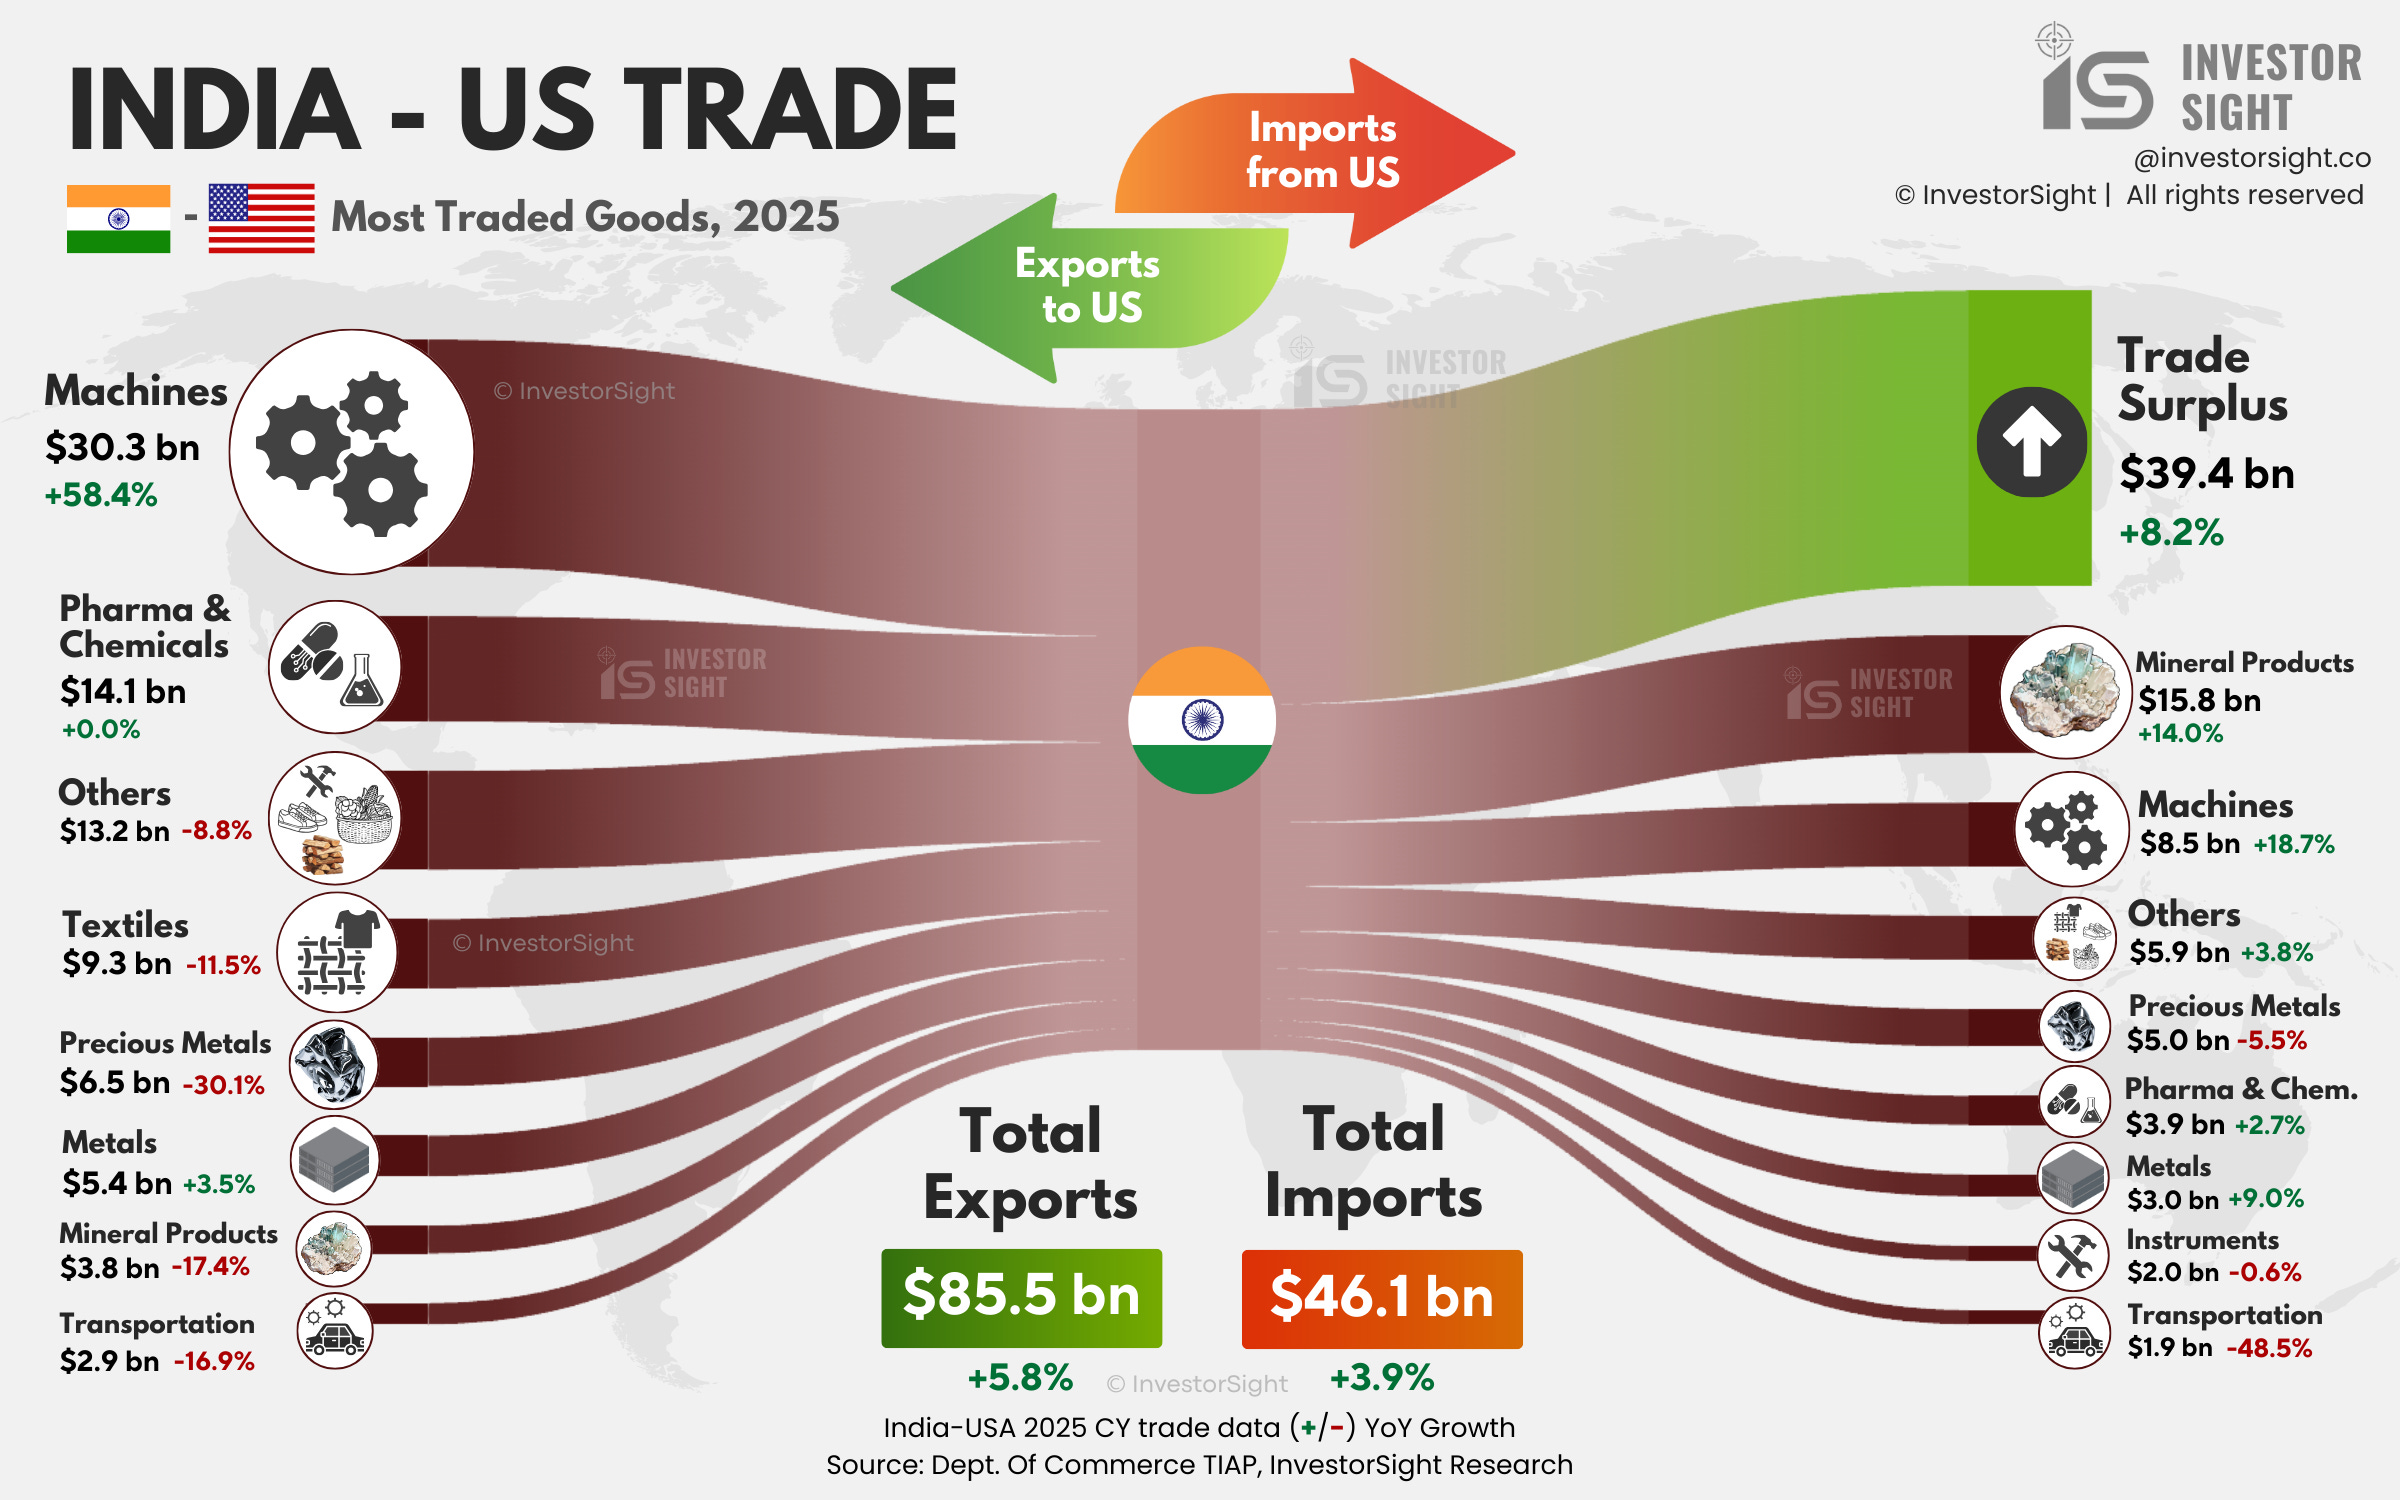
In 2025, India exported goods with $85.5 billion to US, in comparison to $46.1 billion worth of imports, reflecting a $39.4 billion trade surplus.
Just twp categories (Machines and Pharma/ Chemical Products) account for 52% of India’s exports.
Mineral products are the highest imported category at 34% of total imports.
YoY (Year on Year) trend in Exports: Machines exports have seen a 58% increase, while previous metals, mineral products, transportation and textiles have taken a big hit.
YoY trend in Imports: 2025 saw a significant rise in imports of mineral products, machines and metals, while transportation took the biggest hit at 50%.
Share this with someone that might find it interesting!
As per the new trade deal announced, India’s goods will attract an 18% tariff (down from 25%) in the United States, while the US can sell its goods at 0% tariff in India. While India has the lowest tariffs of any other asian countries, it’ll be interesting to see how the reciprocal “zero” tariff plays to India’s trade surplus.
As already known, Oil is India’s largest exported commodity (13% share), followed by Electrical Machinery (12%).
One of the agreements of this deal as announced by US President Donald Trump, is that India will “stop buying Russian oil”. This is sure to have an impact on the country’s high trade surplus, but no details have been shared yet.
The Missing Piece
A critical industry that you will not seem on this graph is agriculture. While the trade data may not reveal much about India’s agriculture industry, its systemic importance is widely known.
India’s agriculture sector employs 45% of the workforce and contributes nearly 17% to the country’s GDP, with crops accounting for 54% of that.
The US has reiterated its intention of aggressively pushing its own agriculture crops products to the world. In fact, the country’s advanced tech has led to higher crop yields and cost effectiveness that will compete against India’s crops, especially soybean, corn and pulses.
As they say, the devil is in the details. And they are yet to be revealed.
At InvestorSight, our analysis is trusted by thousands of global investors and reached millions around the world. We transform data into easy to understand visual insights by breaking down the numbers and connecting the dots to understand what’s really happening in the world of business and finance.
If you want to dive deeper into stories like this, follow and subscribe to never miss an update.
No posts
Comments
Nothing yet. Say the first thing.
Sign in to join the conversation.