
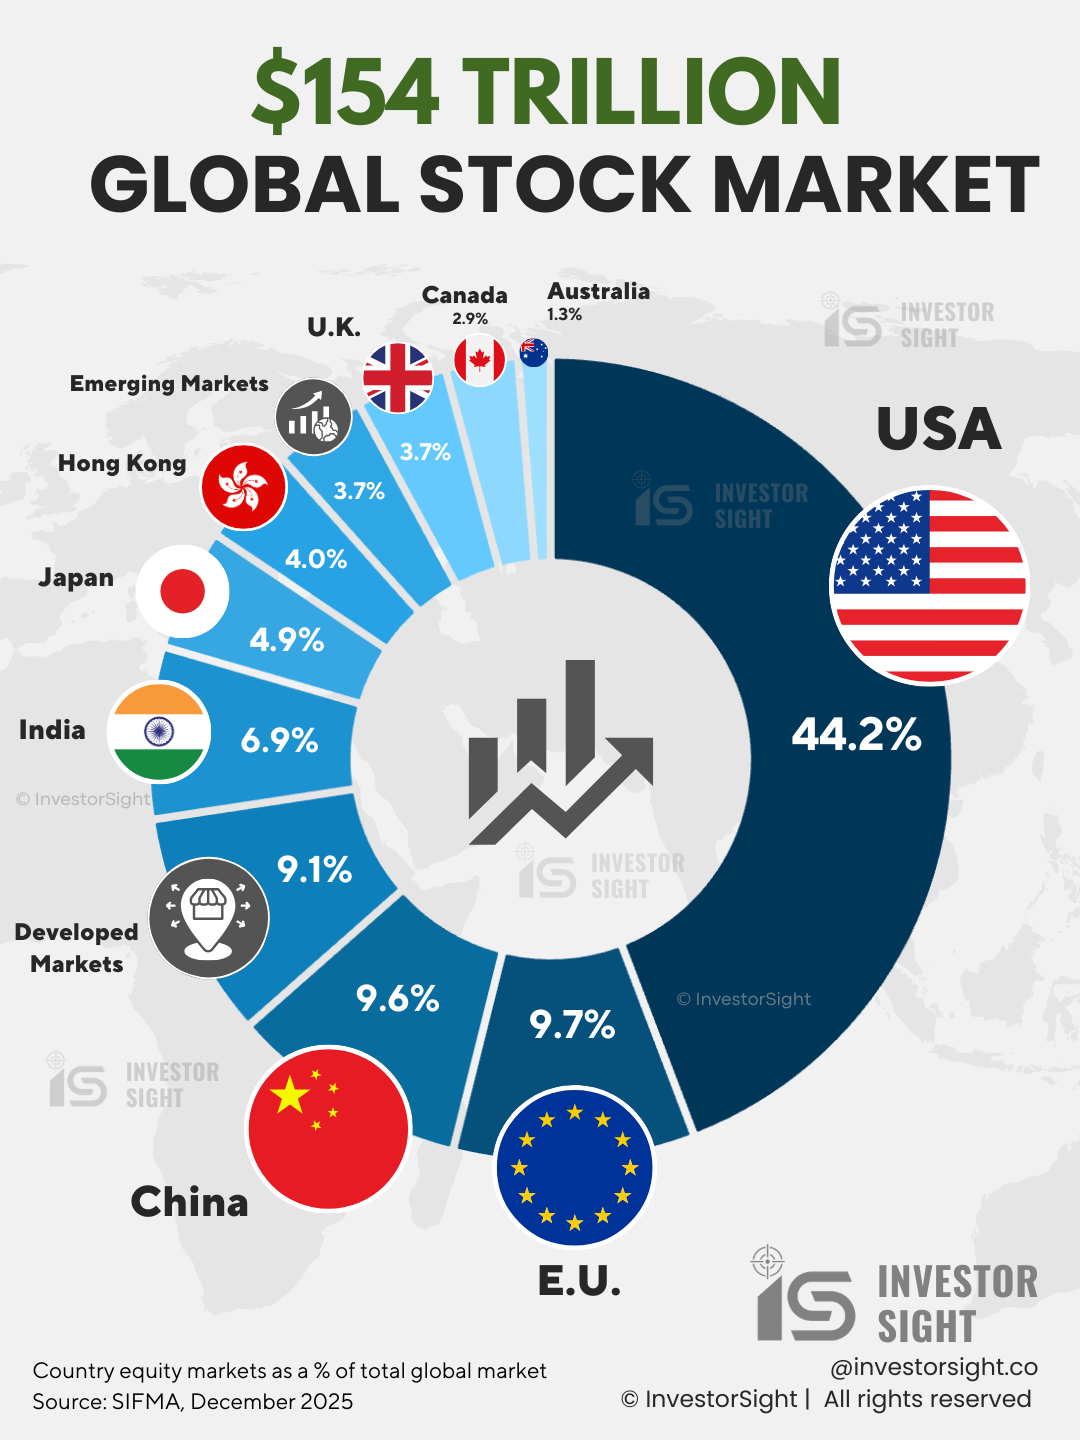
In 2025, the world’s stock market was cumulatively worth $154 trillion. The United States owns the biggest slice of that pie at 44.2% and it’s not even close.
The entire European Union (EU)? 9.7%.
And China? 9.6%.
Here’s the full picture of who holds how much.
Some Key highlights:
44% of the global share is owned by USA, while the rest of the world combined holds 56%.
China and the European Union (EU) hold similar stakes at about 9.6% each.
Individually, India is the third largest country, representing 6.9% of the global equity markets, followed by Japan at 4.9%.
Developed markets represent 9.1% cumulatively, while emerging markets hold 3.7%.
A 10 year comparison (2015 vs 2025):
Interestingly, China, EU, Hong Kong, Japan and UK have each seen a decline from their share in 2015.
On the other hand, India and USA have both witnessed an increase in their share.
Why is the US so visibly dominant? Is is the geography? Demographic? Or maybe a currency advantage?
Partly, but looking at the world’s most valuable industries gives us the answer.
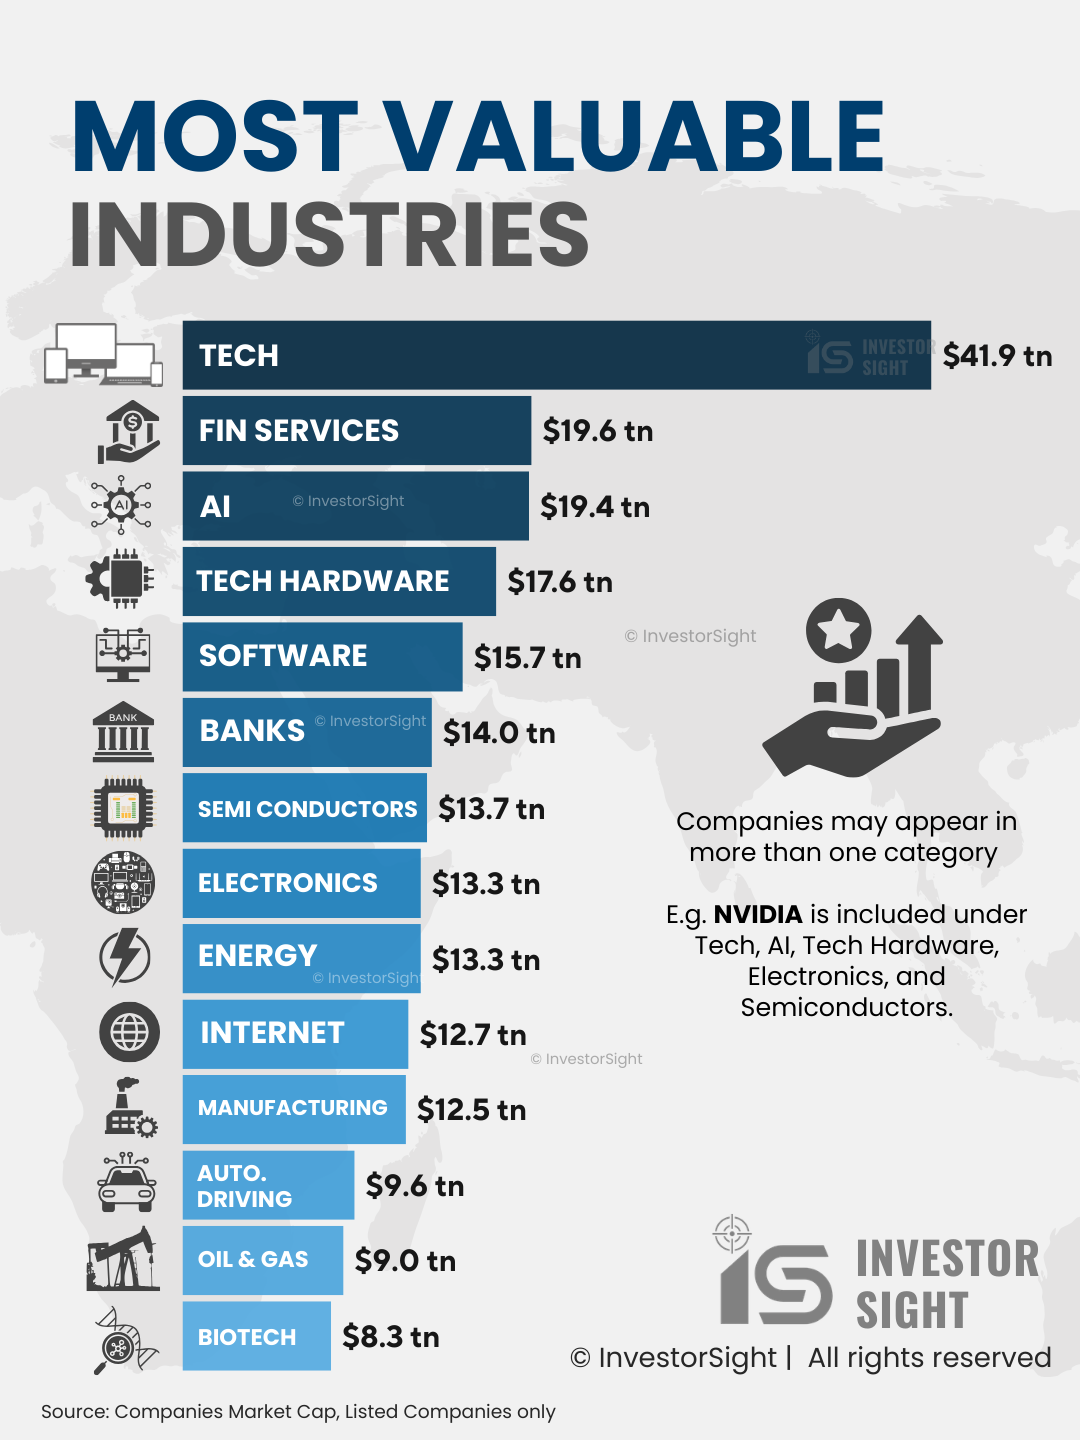
If you look at the most valuable industries in the world, the top 5 dominate significantly.
Tech: $41.9 trillion
Financial Services: $19.6 trillion
AI: $19.4 trillion
Tech Hardware: $17.6 trillion
Software: $15.7 trillion
Important Note: In the infographic above, companies and their market cap may appear in more than one category. For instance, NVIDIA is included under Tech, AI, Tech Hardware, Electronics and Semiconductors.
Share this with someone that might find it interesting!
The top 5 industries are almost entirely America’s story. The nations top companies (like Apple, Microsoft, Google, NVIDIA and Meta) act like a gravitational force pilling global capital towards US exchanges.
The listed tech industry singularly is valued at $41.9 trillion and an overwhelming majority of those companies are listed on America’s stock exchange.
While China holds 9.6% of global equity markets, its modest for the world’s second largest economy (by GDP). So what’s with the gap?
Interestingly, China’s most powerful economic engines are manufacturing, state owned enterprises and real estate. These industries don’t command premium valuations (like tech). In fact, real estate and infrastructure don’t even crack this top-14 industry list and manufacturing clocks in with $12.5 trillion at #11.
India sits at 6.9% and is the only country along with the USA (among the ones listed here) that has seen an uptick in the last decade.
The country is rapidly building out its tech, software and financial services sectors; the exact industries topping the valuation charts. Additionally, India has adopted to AI quickly across industries and has one of the largest AI user base in the world.
With a young population, increasing investments and a developing ecosystem, India may be the most interesting one to watch out in the next decade.
The world is more interconnected than ever and if you’re a global investor, here’s what the two charts are telling you.
The countries dominating global equity markets are the ones that dominate the industries that market values most.
It’s circular and intentional given that high-value industries attract capital.
Capital funds more innovation and more innovation creates market dominance.
And the US has been riding this for decades.
How do you think the next 10 years will look like?
At InvestorSight, our analysis is trusted by thousands of global investors and reaches millions around the world. We transform data into easy to understand visual insights by breaking down the numbers and connecting the dots.
If you want to dive deeper into stories like this, follow our social media and subscribe to never miss an update.
No posts
Comments
Nothing yet. Say the first thing.
Sign in to join the conversation.