
Welcome to The Long and the Short — a show where you can expect an honest take on trading, something you won’t hear elsewhere.
If you go back and read the backstory of legendary traders, you will notice something. A lot of the biggest names weren’t stock traders. They were commodity traders.
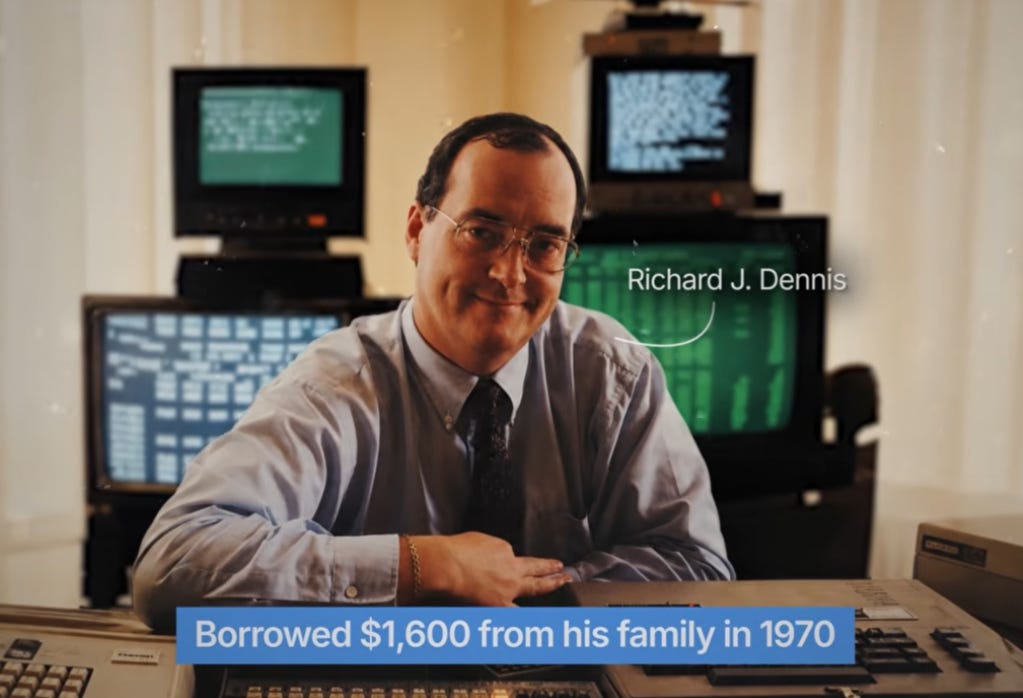
Richard Dennis borrowed $1,600 from his family in 1970, spent most of it buying a seat at the Mid-America Commodity Exchange, and traded what was left into a fortune reported to be in the hundreds of millions. Soybeans, corn, gold. They called him the Prince of the Pit.
Bruce Kovner took a $3,000 cash advance on his MasterCard in 1977 while driving a taxi in New York. A soybean shortage ran his position up to around $45,000 in six weeks. Then the market turned, and he gave back roughly half of it in a single hour.
But these were American traders operating in American markets: deep, liquid, wide, with decades of continuous data behind them.
India is a different animal. Our commodity markets exist and work, but liquidity is concentrated in a handful of contracts; outside that handful, things get thin.
So if you were to trade commodities in India, where do you start? And more importantly, are there any unique characteristics of these commodities from a trading standpoint?
In other words, do Indian commodity futures actually trend? Or do they mean-revert?
Because that one answer decides a lot downstream. Whether you’re a trend trader or a mean reversion trader. And if you’ve picked up a strategy from an American trading book, whether it really applies here.
To answer that, you need a basic sense of the products themselves. So we’ve taken the five most liquid commodity futures in India and run a baseline test on each of them to see how they behave.
Do they trend or mean-revert?
Disclaimer: The examples and ideas shared in this newsletter are strictly for educational and illustrative purposes only. Nothing discussed here should be construed as a recommendation, investment advice, or a solicitation to trade.
Trading in stocks and derivatives involves significant risk and can result in the complete loss of capital. The examples and data presented are meant to explain market behaviour, not to suggest that similar outcomes will occur in the future.
If you’re new to the concept of trend versus mean reversion, you may want to check this out before going further:
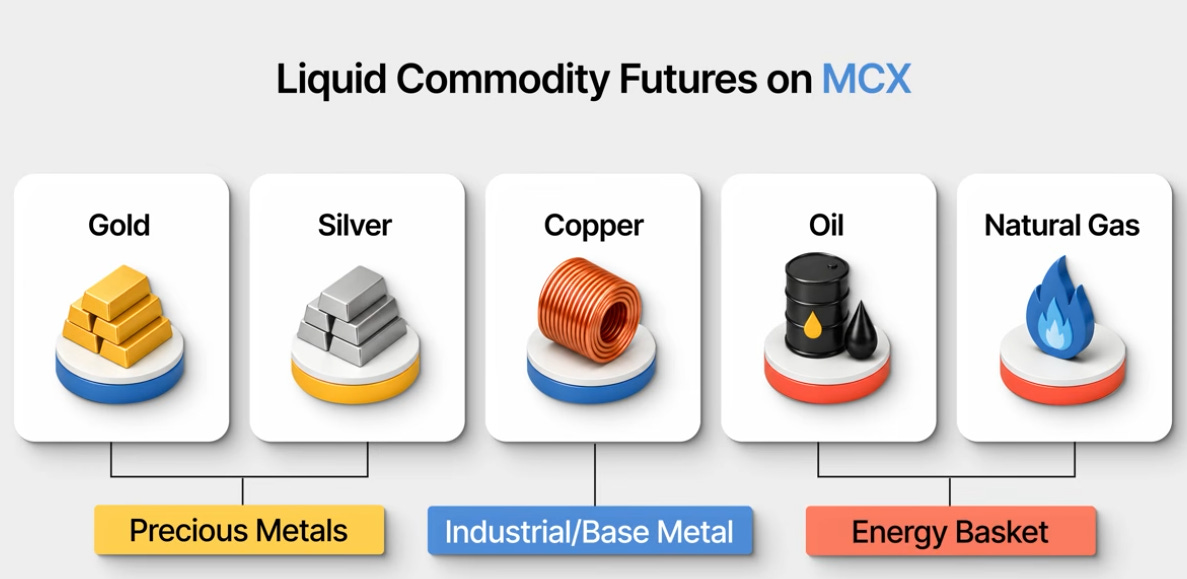
We took the five most liquid commodity futures on MCX: Gold, Silver, Copper, Crude Oil and Natural Gas. That’s two precious metals, one industrial or base metal, and two from the energy basket.
All are futures. The price series is back-adjusted, meaning a continuous series stitched across rollovers, rather than a single expiry. The backtest period is 11 years.
On each of them, we ran a very simple backtest using Supertrend as the indicator on the daily timeframe, with default 10,3 parameters applied on close.
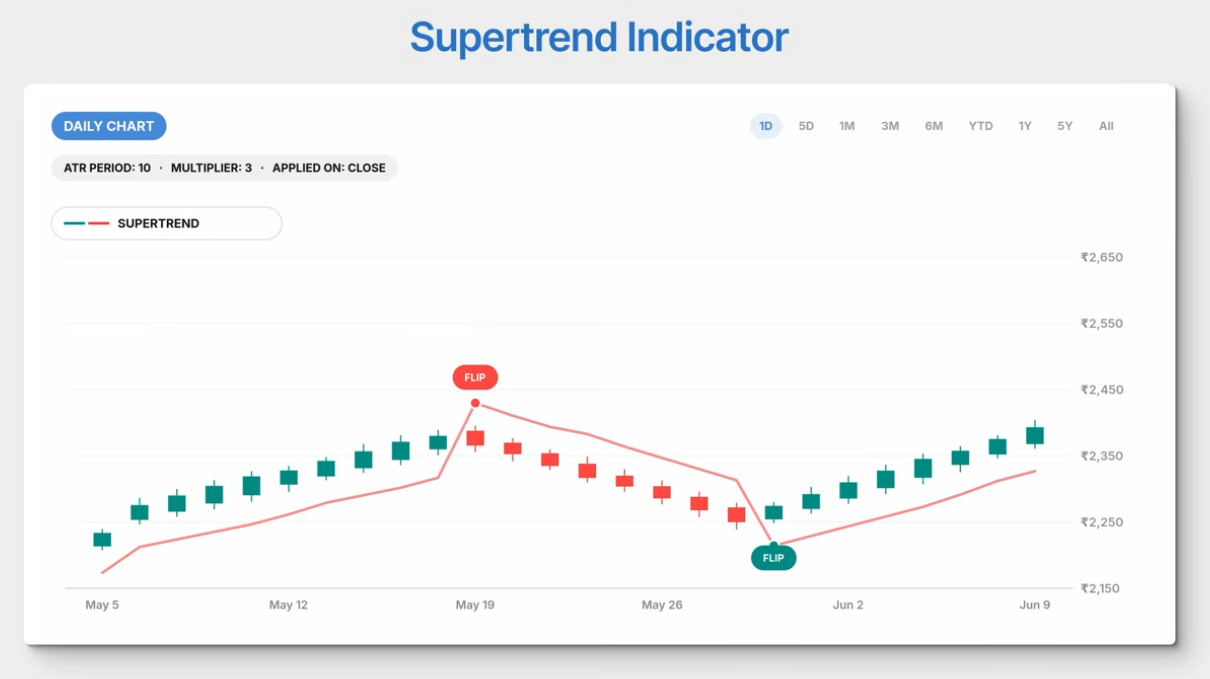
The design is a stop-and-reverse system. This means you are always in the market. When the indicator flips, you don’t just exit. You exit and take the opposite position. Long becomes short, short becomes long, and you keep flipping for 11 years.
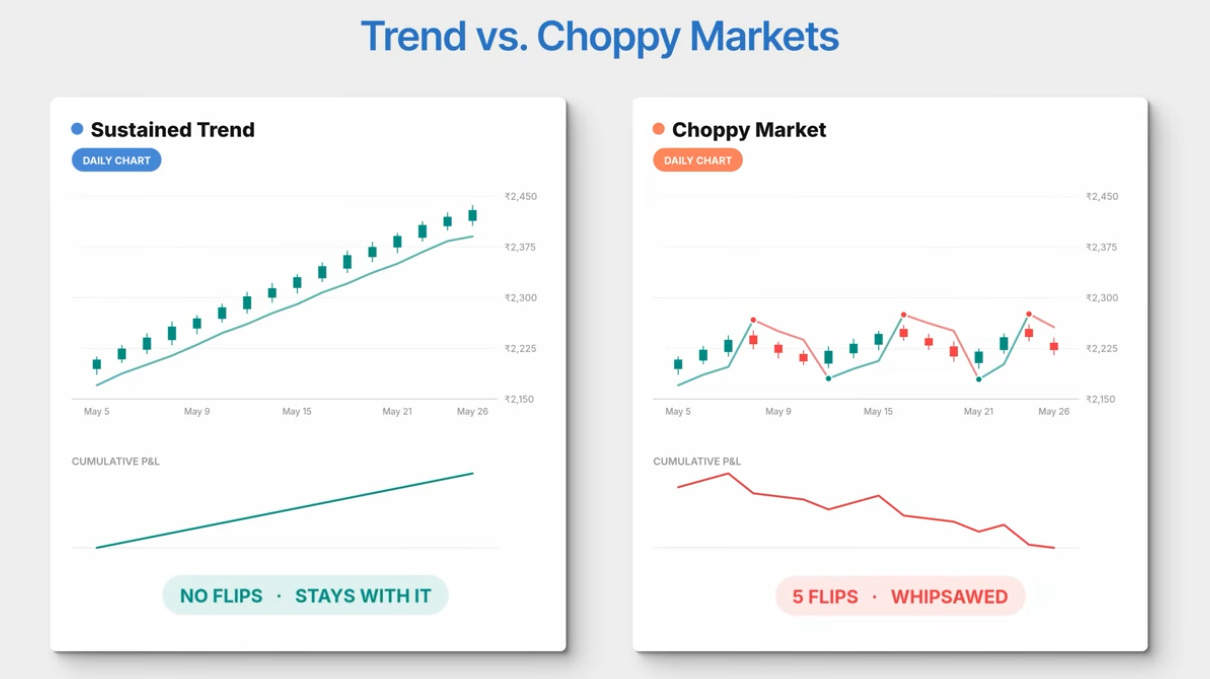
A stop-and-reverse trend system is an honest test of whether a market trends. If prices move in sustained legs, the system stays with them. If prices chop and revert, it gets whipsawed on every flip. Either way, the log will tell you.
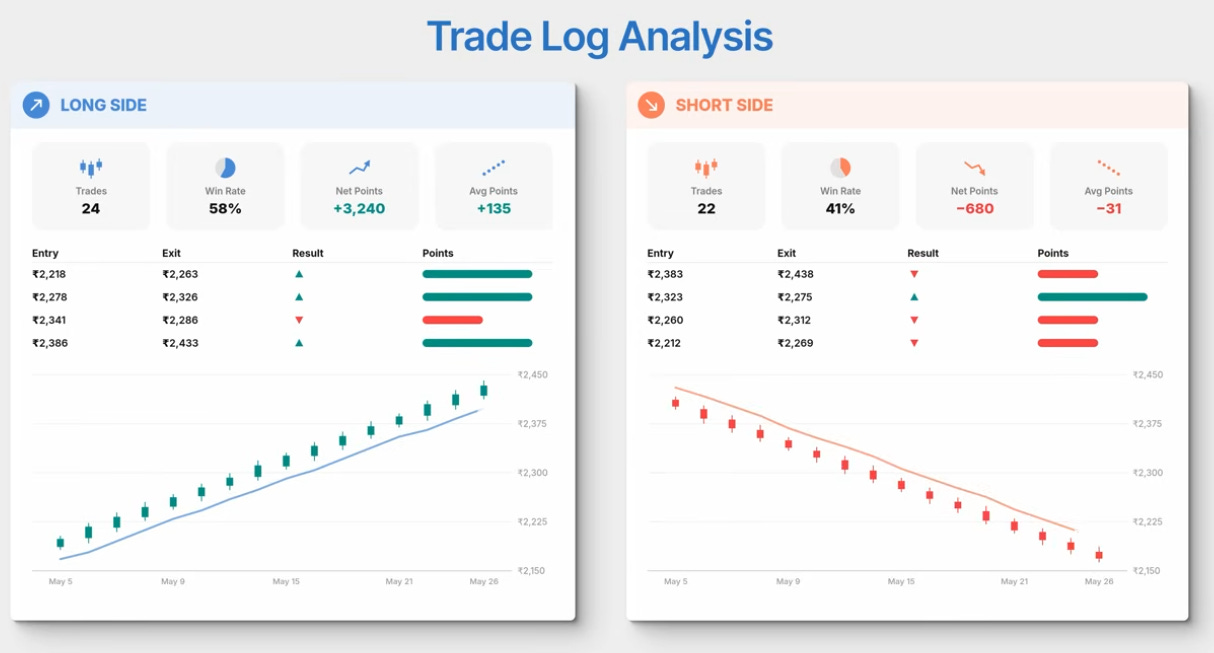
And that’s what we analyse: the trade log, with the long side and the short side looked at separately, because the two don’t always behave the same way.
One disclaimer before we go further. This is not a trading strategy, and we’re not recommending it. There are no costs, no slippage, and no rollover impact built in, and post-costs it may well not work at all.
The purpose here is very specific. It’s to get a sense of how these five products actually behave from a price perspective.
Let’s start our analysis by looking at the directional skew of the trend for each of the commodities.
To do that, we’ll ask a very simple and fundamental question: how many days do the long trends occupy, and how many days do the short trends occupy?
Backtest period: March 2015 to July 2026
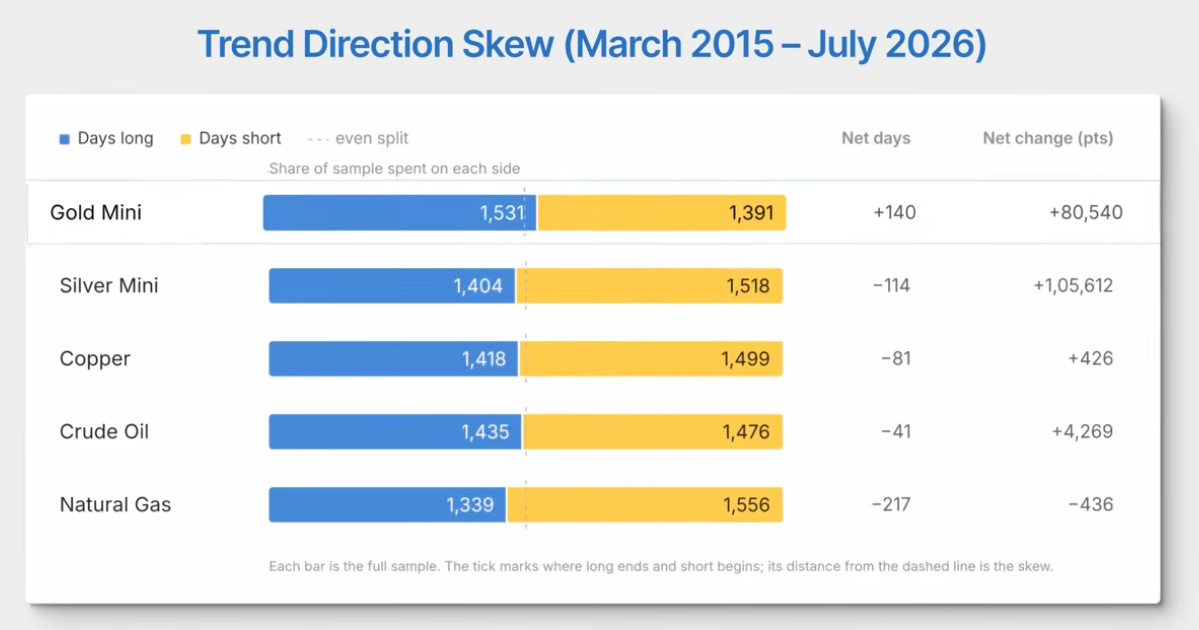
When we look at Gold, it has a slight long skew. It spends 140 days more on the long side. Silver, on the other hand, and all the others have a slightly short skew, which means they spend more time on the short side.
Crude Oil is right in the middle because it spends an equal amount of time on both sides. We’ll come back to it later, but there’s something worth observing there.
Net change points are from the start of the data set to the end. How many points did this particular series capture, sort of a buy-and-hold reference.
Next, let’s look at the number of points captured over the 11 years on each side by each of these commodities.
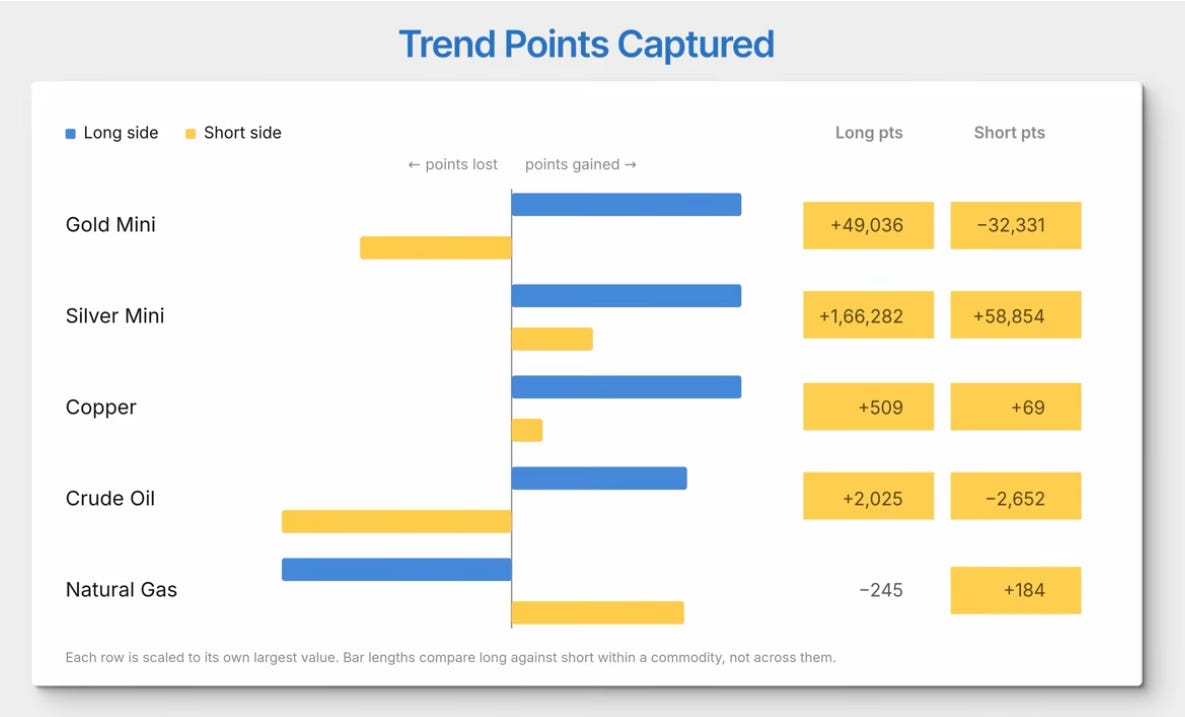
What you essentially see is that for Gold, most of it was made on the long side, while the short side lost money. For Silver, both sides worked. For Copper, again, both sides worked.
Crude seems to have an upward bias where longs worked, but shorts failed badly. Natural Gas, as you can see, only shorts worked.
So the lesson from this is that saying a commodity is “trending” doesn’t mean much. You need to ask: which side does it take?
A commodity can trend in one direction only, and the side you take matters.
So far, what we know is the directional bias in terms of trend that each product has. But let’s also look at how sustained trends are in the given direction where it succeeds.
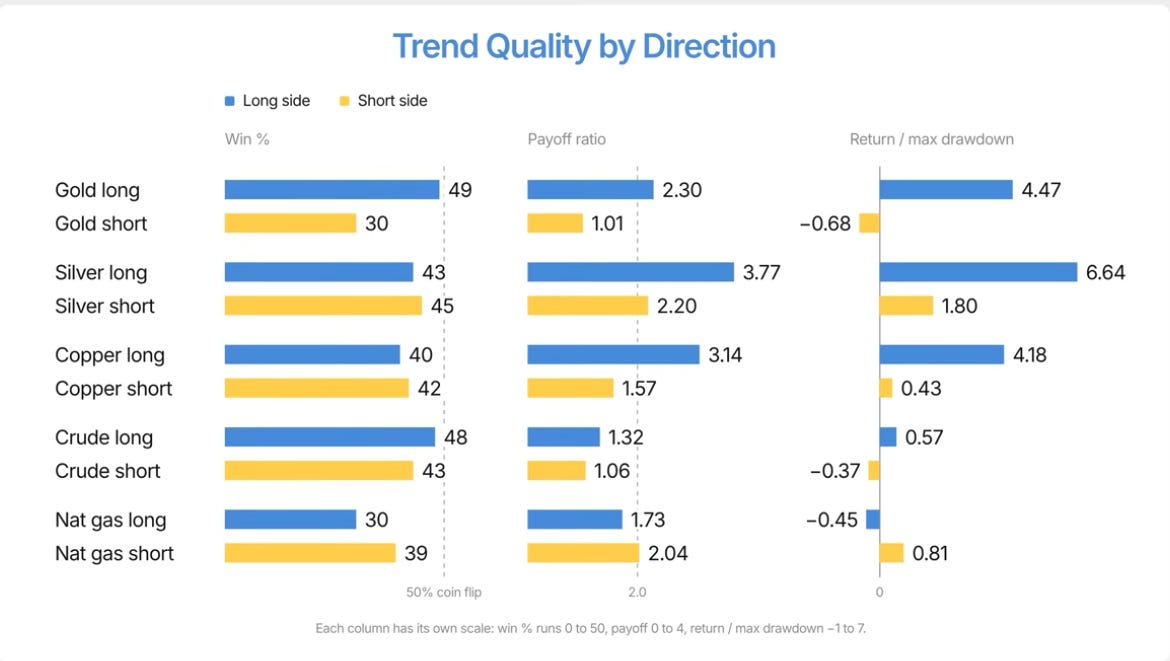
For this, we’ll look only at the winning direction. What that means is: if it’s Gold, we’ll look only at the long side. If it’s Silver, we’ll look at both sides. If it’s Copper, again we’ll look at both sides, and so on.
Let’s start with the win rate, which is one of the most intuitive parameters to understand.
Gold Long wins the most, almost 49%, followed by Crude Long, and then Silver Short, and so on.
The next is the payoff, which is average win divided by average loss in absolute terms. The higher the number, the better.
And lastly, we have return to max drawdown, which is how much return you get for the drawdown pain you experience.
Gold has a clear edge on the long side that’s quite visible, and so does Silver. Copper again has an edge on the long side.
Crude seems to be slightly long-biased, but it’s neither here nor there, kind of a thing right in the middle. Natural Gas seems to have a minor skew on the downside.
While these are skews, not everything is tradable. You really need a decent payoff and sustainable return-to-max-drawdown numbers, and we don’t have to tell you which ones have those.
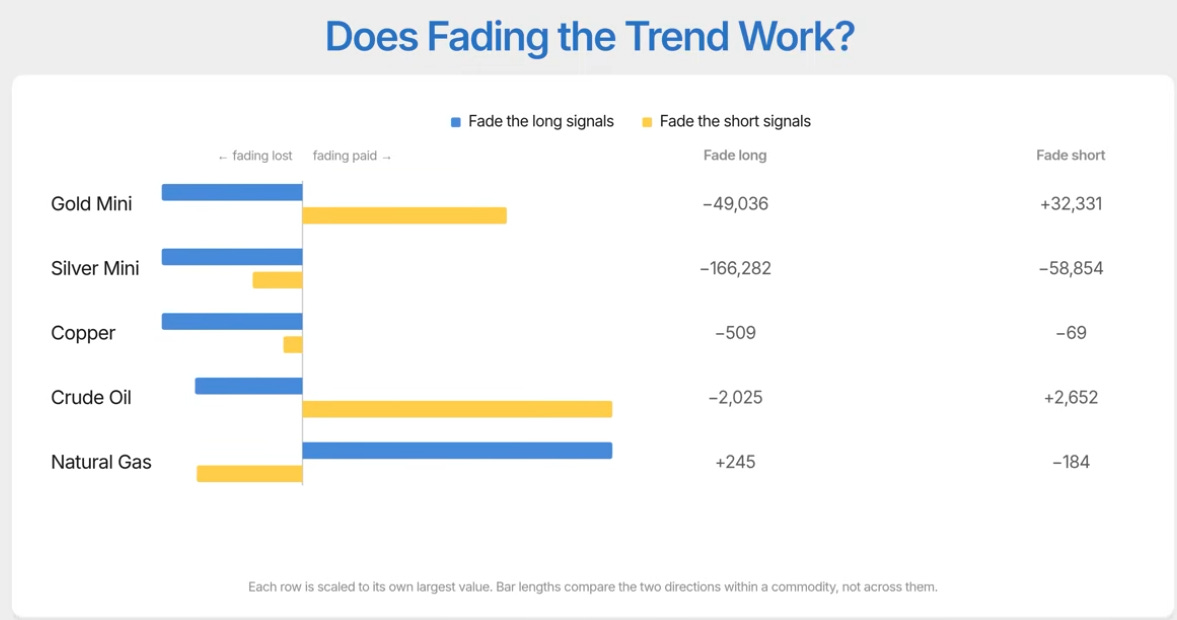
The next question is which of these products have a mean-reverting nature.
One simple way to answer that is: what if we take the opposite trade?
This asks a different question than the previous analysis. Not whether a commodity trends, but whether there was any side, in any product, where doing the exact opposite of the signal would have paid you.
Across five commodities and eleven years, there are only three.
Quantitatively speaking, this is not a perfect way to figure out if that product is more mean-reverting, but to keep things simple, we’re using this as a measure. Other statistical tests to measure the mean-reverting nature of the time series would have complicated it for many.
Let’s start with Gold.
Gold short signals, i.e., fading them, return 32,331 points, which is another way of saying that shorting Gold did not work. Forty-six short signals in eleven years, and you would have been better off taking the other side of every one.
The second is Crude’s short signals, worth 2,652 points. The third is Natural Gas’s long signals, worth 245.
Both are positive, and both are small enough that you should hear the number before you get excited about the direction.
So far, we’ve got some sense of individual trends, or the lack of them, in any given direction. Before we take any other decision, we need to understand another aspect: consistency across years.
For example, when we say Gold Long has made money, how many years out of the past 11 years has it actually made money? Likewise for other commodities and their winning directions.
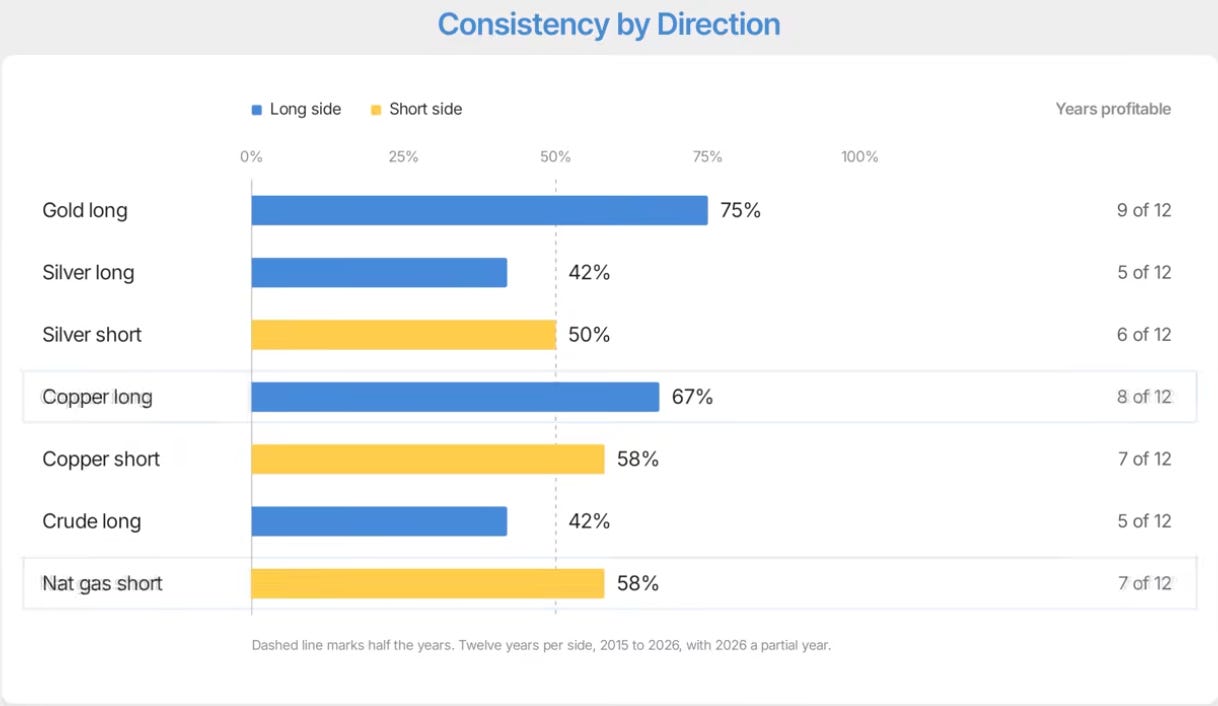
The answer is clear: Gold Long wins hands down, followed by Copper Long, while the Natural Gas Short trade comes third.
If you are looking for consistency, which we all should, we know where the answers are.
While the other numbers look good on Silver, the moment we look at it from a year-wise consistency standpoint, things don’t look good at all.
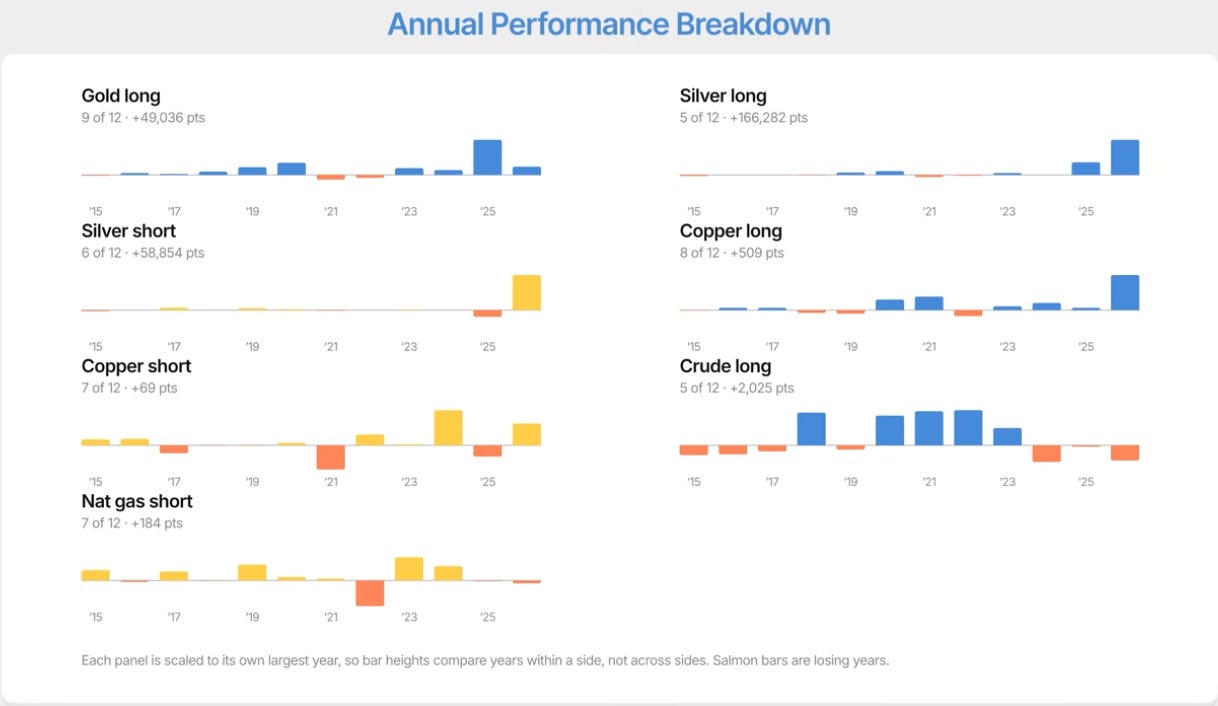
There’s one more view worth taking before you form a sense of how these commodities work, and that’s which years actually did the work.
Look at Silver’s short side. 2026 alone has paid more than the entire eleven years combined, and that’s only five months of it.
Copper’s long side is much the same, with most of it arriving this year. Is there a Copper supercycle running? Worth asking.
Crude’s long side tells a different story. It worked in 2020, 2021, 2022, and 2023, four years in a row, which looks like a macro trend at play.
This is another view you may want to include in your analysis before forming a sense of how these commodities work.
This gives us a starting point for comparing MCX commodities to see which of them trend and which of them revert.
As mentioned earlier, treat this as a starting point, a baseline test, not a strategy. It’s meant to give you a broad sense of how these products behave in India, and nothing more than that.
It also points somewhere else. The drifts you’ve seen here aren’t accidents. There are valid macro reasons why some commodities have a positive drift, others a negative one, and why some hold their direction better than others.
Those reasons are beyond the scope of this edition, but they aren’t hidden.
If you go looking at supply cycles, storage costs, and currency effects, you’ll find the patterns and reasons behind those patterns yourself.
If you have any questions, feel free to ask them in the comments — we’ll be happy to answer.
Till then — take care and trade safe.
No posts
Comments
Nothing yet. Say the first thing.
Sign in to join the conversation.