
The stock market has not moved onchain. What is emerging instead is a more credible infrastructure layer for distributing securities, recording ownership claims and settling transactions through blockchain-based systems.
RWA.xyz data shows that the value of distributed tokenized stocks nearly doubled, from $951 million in March 2026 to $1.89 billion in July. Most of that growth, however, came from a relatively small group of products and platforms.
The headline figure also brings together instruments with very different legal and economic structures. Some tokens represent issuer-sponsored common stock. Others are structured notes, tracker certificates, custodial entitlements or synthetic exposures. Even one-for-one backing and self-custody do not necessarily give the holder direct shareholder rights.
The most significant progress has come from regulated market infrastructure, particularly Nasdaq’s same-CUSIP settlement model and DTC’s planned commercial rollout. Liquidity, investor distribution and independent onchain price discovery remain limited. Tokenized Treasuries continue to show stronger product-market fit, while equity ETFs may prove easier to scale than individual stocks.
The market is therefore best understood as a divided Tier 2.5 system. Products with the strongest legal foundations tend to have limited liquidity and distribution. More actively traded wrappers generally offer weaker ownership rights.
This report updates insights4vc’s March 2026 analysis, The State of Onchain Real-World Assets, and examines what has materially changed since its publication.


At insights4vc, we pay attention to teams building the infrastructure behind emerging market categories.
Umia is developing a new operating model for token-native ventures. The platform brings fundraising, legal formation, treasury management and governance into one integrated system, enabling projects to launch with clearer structures and more accountable decision-making from day one.
To learn more about Umia, contact office@insights4.vc
The March report drew a distinction between assets that are recorded on a blockchain and those that can be transferred to external wallets. That distinction remains important. Under RWA.xyz’s framework, a represented asset stays within the issuer’s or platform’s own environment. A distributed asset can be moved outside it, although transfers may still be restricted to approved or whitelisted wallets.
Transferability alone, however, is no longer enough to judge how mature a product is.
Since March, offshore products have become easier to move across chains and use within decentralized markets. Ondo expanded to Ethereum, BNB Chain and Solana, introduced decentralized routing, and added continuous minting and redemption for a limited number of products. xStocks also broadened its distribution and collateral integrations.
At the same time, regulated U.S. infrastructure moved in a different direction. Its focus has been less on unrestricted portability and more on legal certainty, controlled wallets, regulated custody, transfer-agent records and integration with DTC.
The two approaches solve different problems. Offshore wrappers improve access and composability. Regulated infrastructure strengthens the connection between the token and the legal ownership claim.
A canonical share is an issuer-authorized form of the underlying security whose transfer is recognized by the official ownership system. It is different from a third-party instrument created only to track the price or performance of a share.
No product has yet combined all four elements at scale: canonical ownership rights, broad wallet distribution, institutional liquidity and independent onchain price discovery.
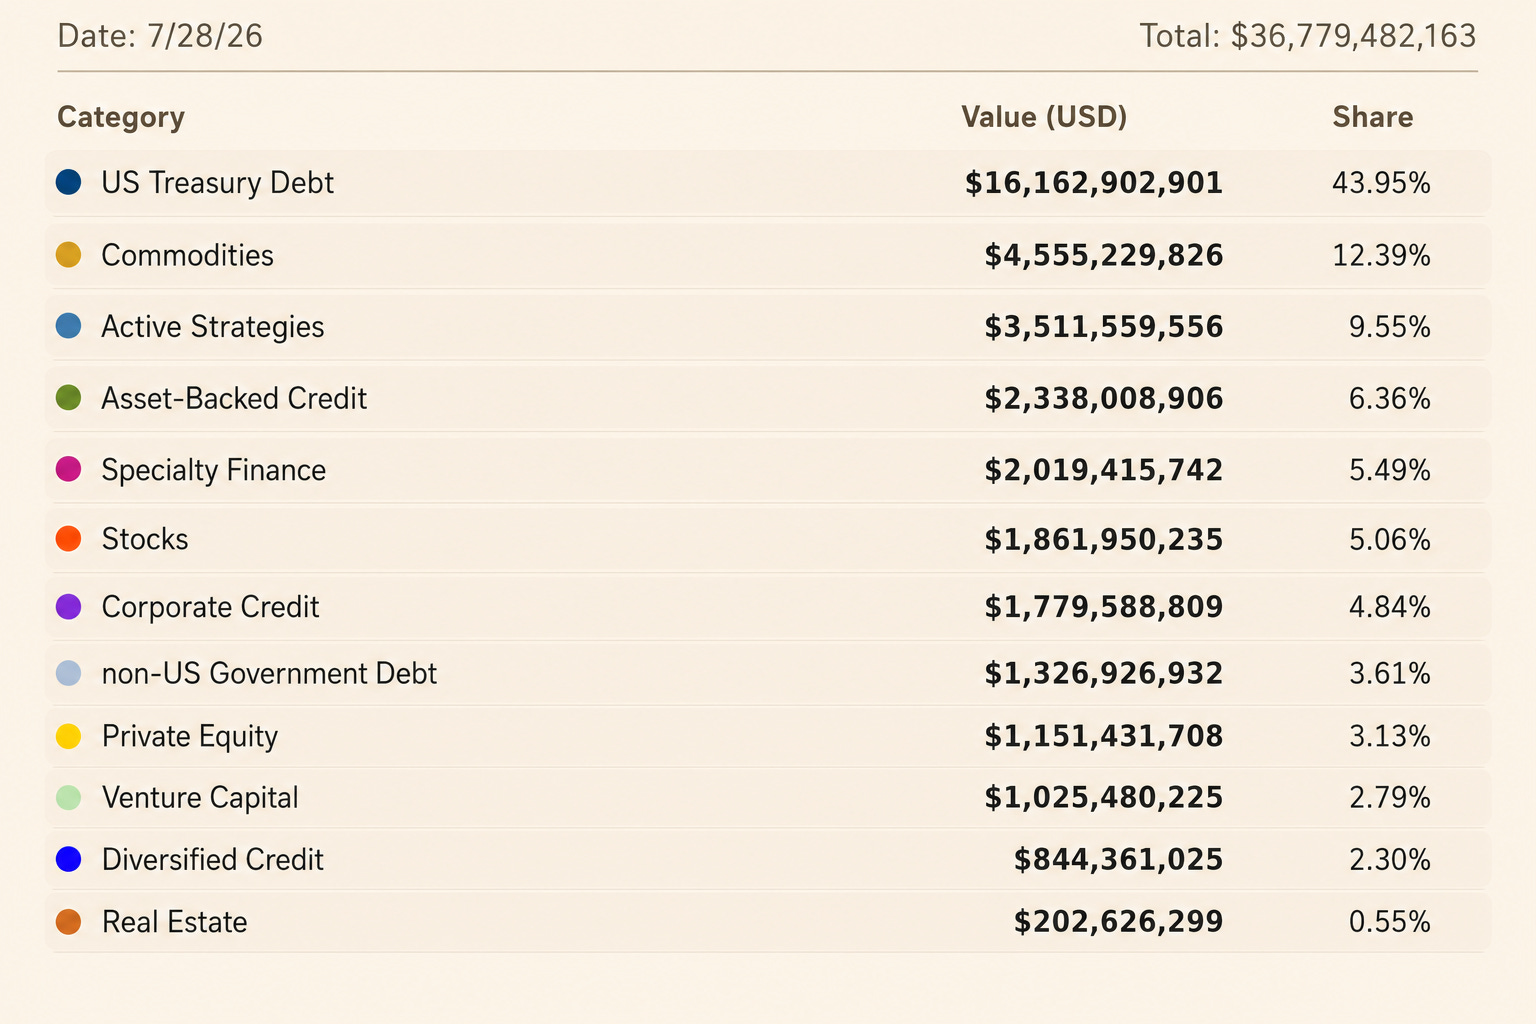
The broader RWA totals should also be interpreted carefully. RWA.xyz reported $36.81 billion of distributed value and $218.27 billion of represented value on 29 July. The apparent $124.33 billion decline in represented value should not be read as an economic outflow or a wave of redemptions. Large datasets were added, removed, reclassified or revalued between the two observation dates.
These figures describe the value of claims covered by the platform’s methodology at a given point in time. They are not a measure of investor flows.
The tokenized-stock series is more useful because the same Bridged Token Value methodology can be applied to both periods. Even here, the reported 98.5% increase cannot be separated cleanly into new issuance, price appreciation and classification changes.
FGRS provides a useful example. Figure completed an offering of 4.375 million blockchain shares at $32 per share, but the reported value later changed with the market price. Without daily data on minting, burning and net asset value for every product, it is not possible to reconstruct market-wide net issuance reliably.
RWA.xyz measures tokenized stocks using Bridged Token Value, calculated as bridged circulating supply multiplied by net asset value.
Circulating supply excludes balances identified as treasury holdings or pre-minted inventory. The bridged figure also removes tokens locked in recognized bridge contracts, helping to avoid double counting when an asset is locked on one network and issued on another.
This is a useful measure of distributed value, but it is not the same as free float. Free float refers to the portion of a security that is genuinely available for public trading after restricted, strategic and closely held positions are excluded.
The timing of the data also matters. The supplied asset-level export shows total distributed value of $1,887,902,416 on 27 July, matching the dashboard’s rounded figure of $1.888 billion. Platform and network snapshots taken on 29 July total approximately $1.872 billion.
The $15.8 million difference, equal to 0.84%, is consistent with changes in prices and token supply between the two observation dates. For that reason, instrument-level growth calculations in this report use data from 27 July, while platform and network market shares use the 29 July snapshots. The datasets are not combined within the same calculation.
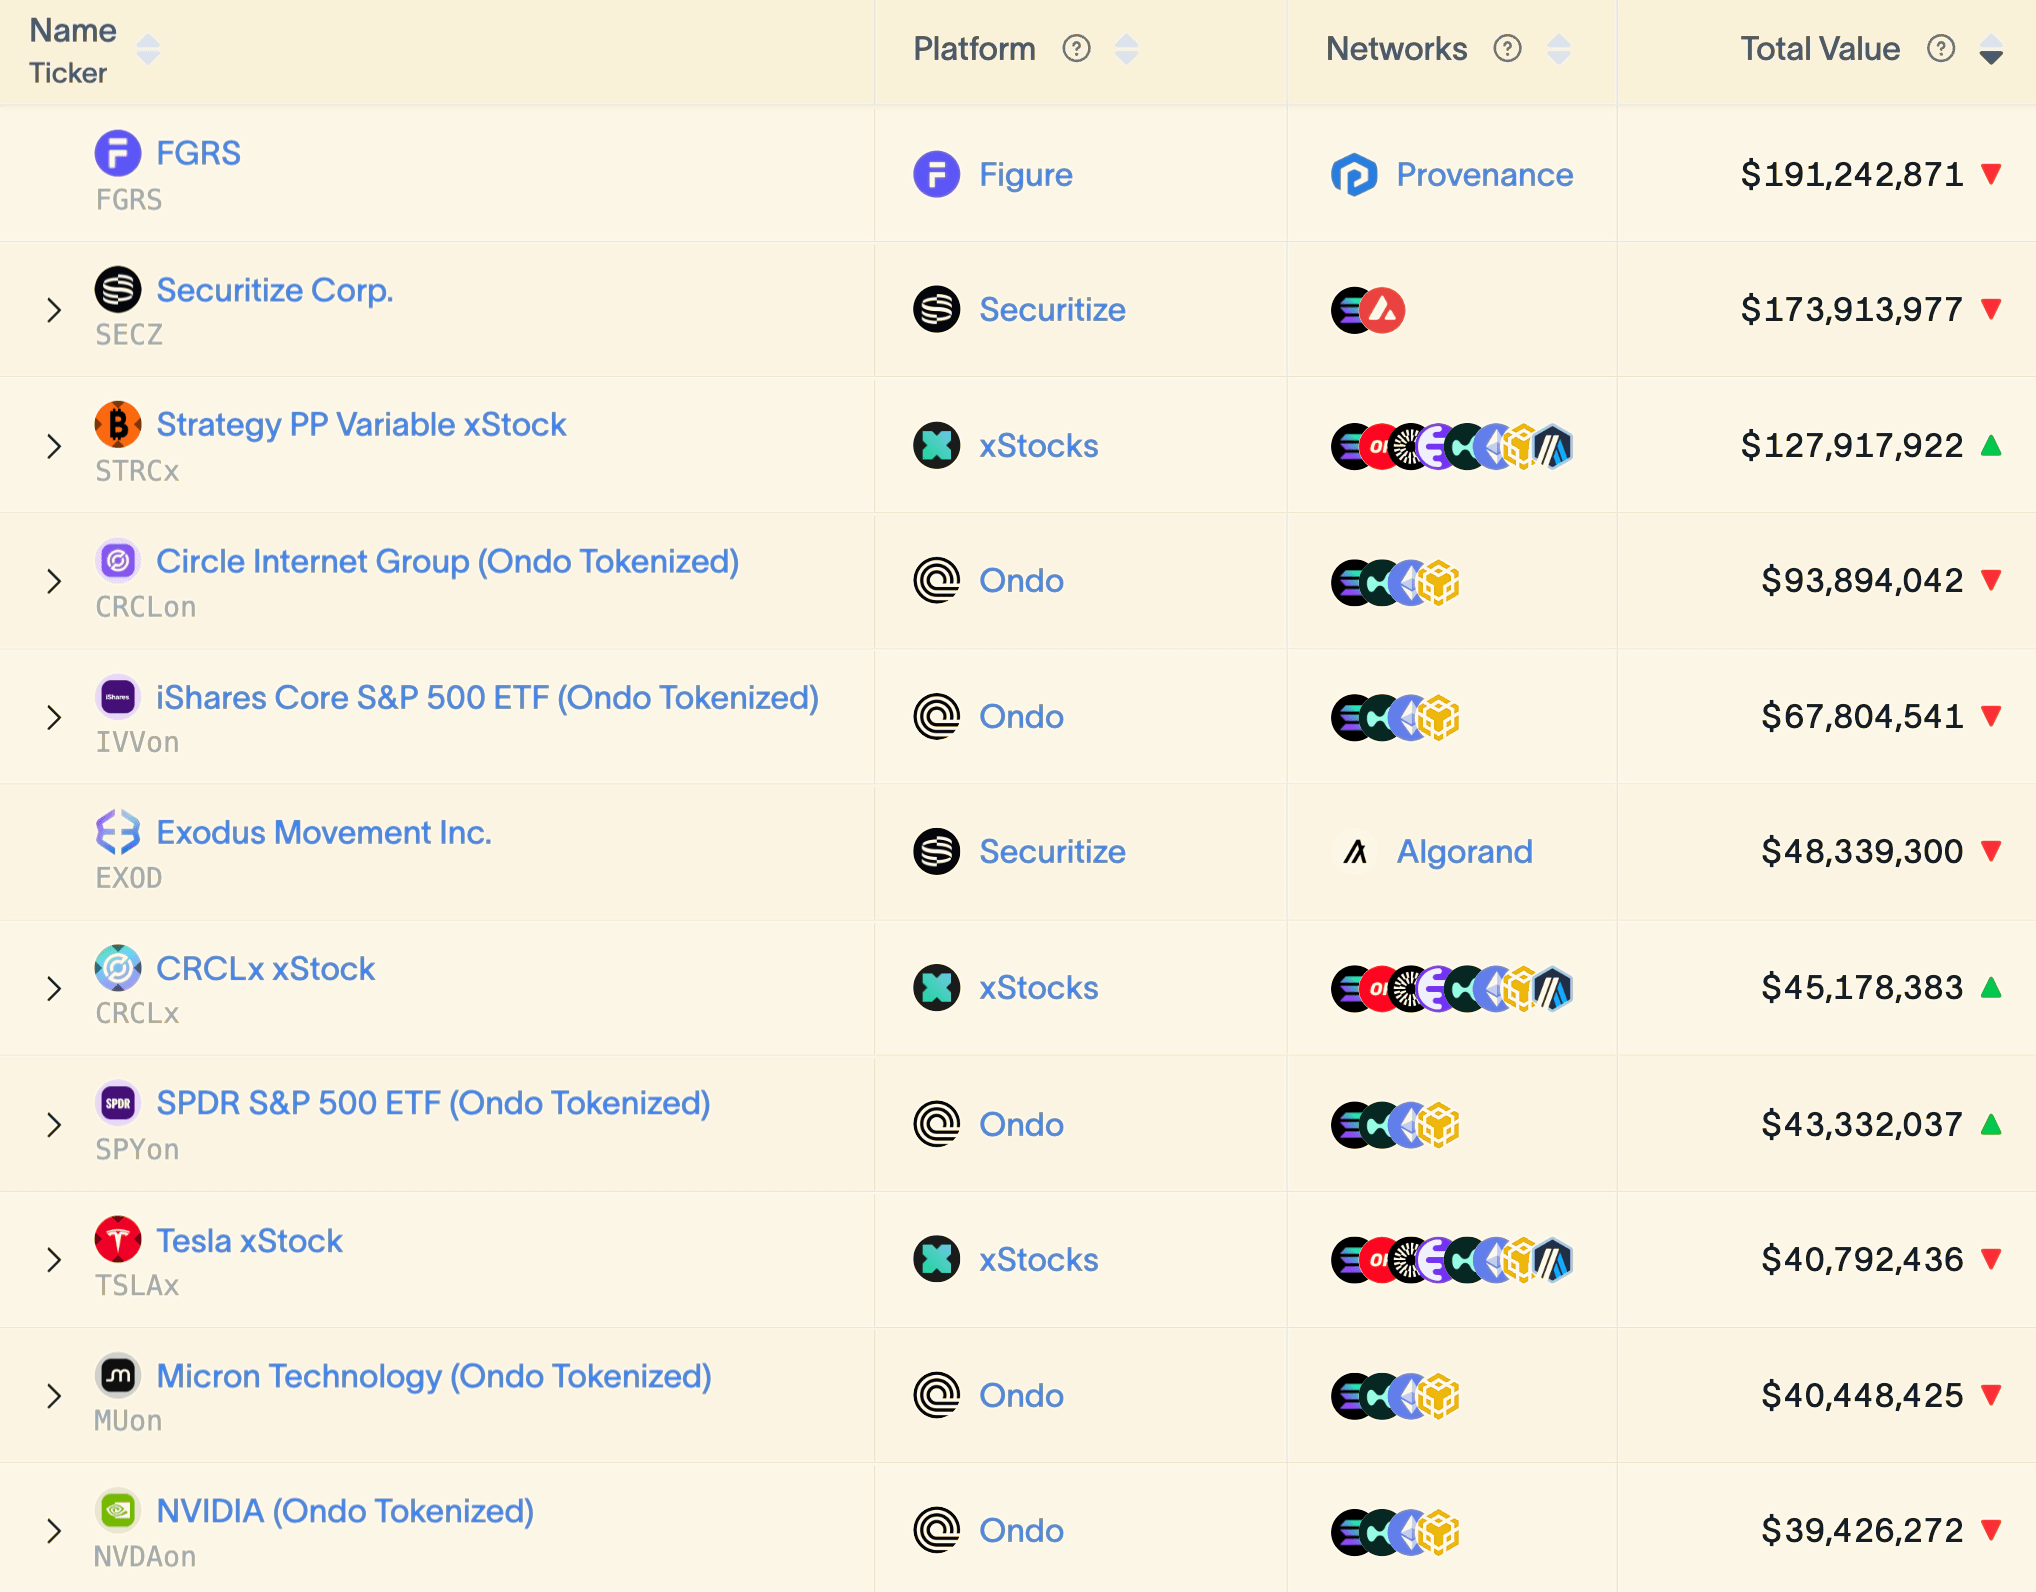
Three named instruments accounted for approximately half of the increase. SECZ added $169.0 million following its listing, FGRS increased by $162.9 million and STRCx added $126.6 million. Together, they contributed $458.6 million, or 49.0%, of the total $936.8 million increase. The aggregated long tail added a further $150.5 million, representing 16.1% of the expansion.
These figures show changes in distributed value, not investor subscriptions.
SECZ is affected by both the number of represented shares and Securitize’s NYSE share price. FGRS reflects a combination of issuance, conversion activity and changes in the market price. STRCx depends on the outstanding supply and value of a certificate linked to Strategy’s variable-rate preferred stock.
Describing all three increases as tokenized-stock inflows would combine several economically different events into a single and potentially misleading figure.
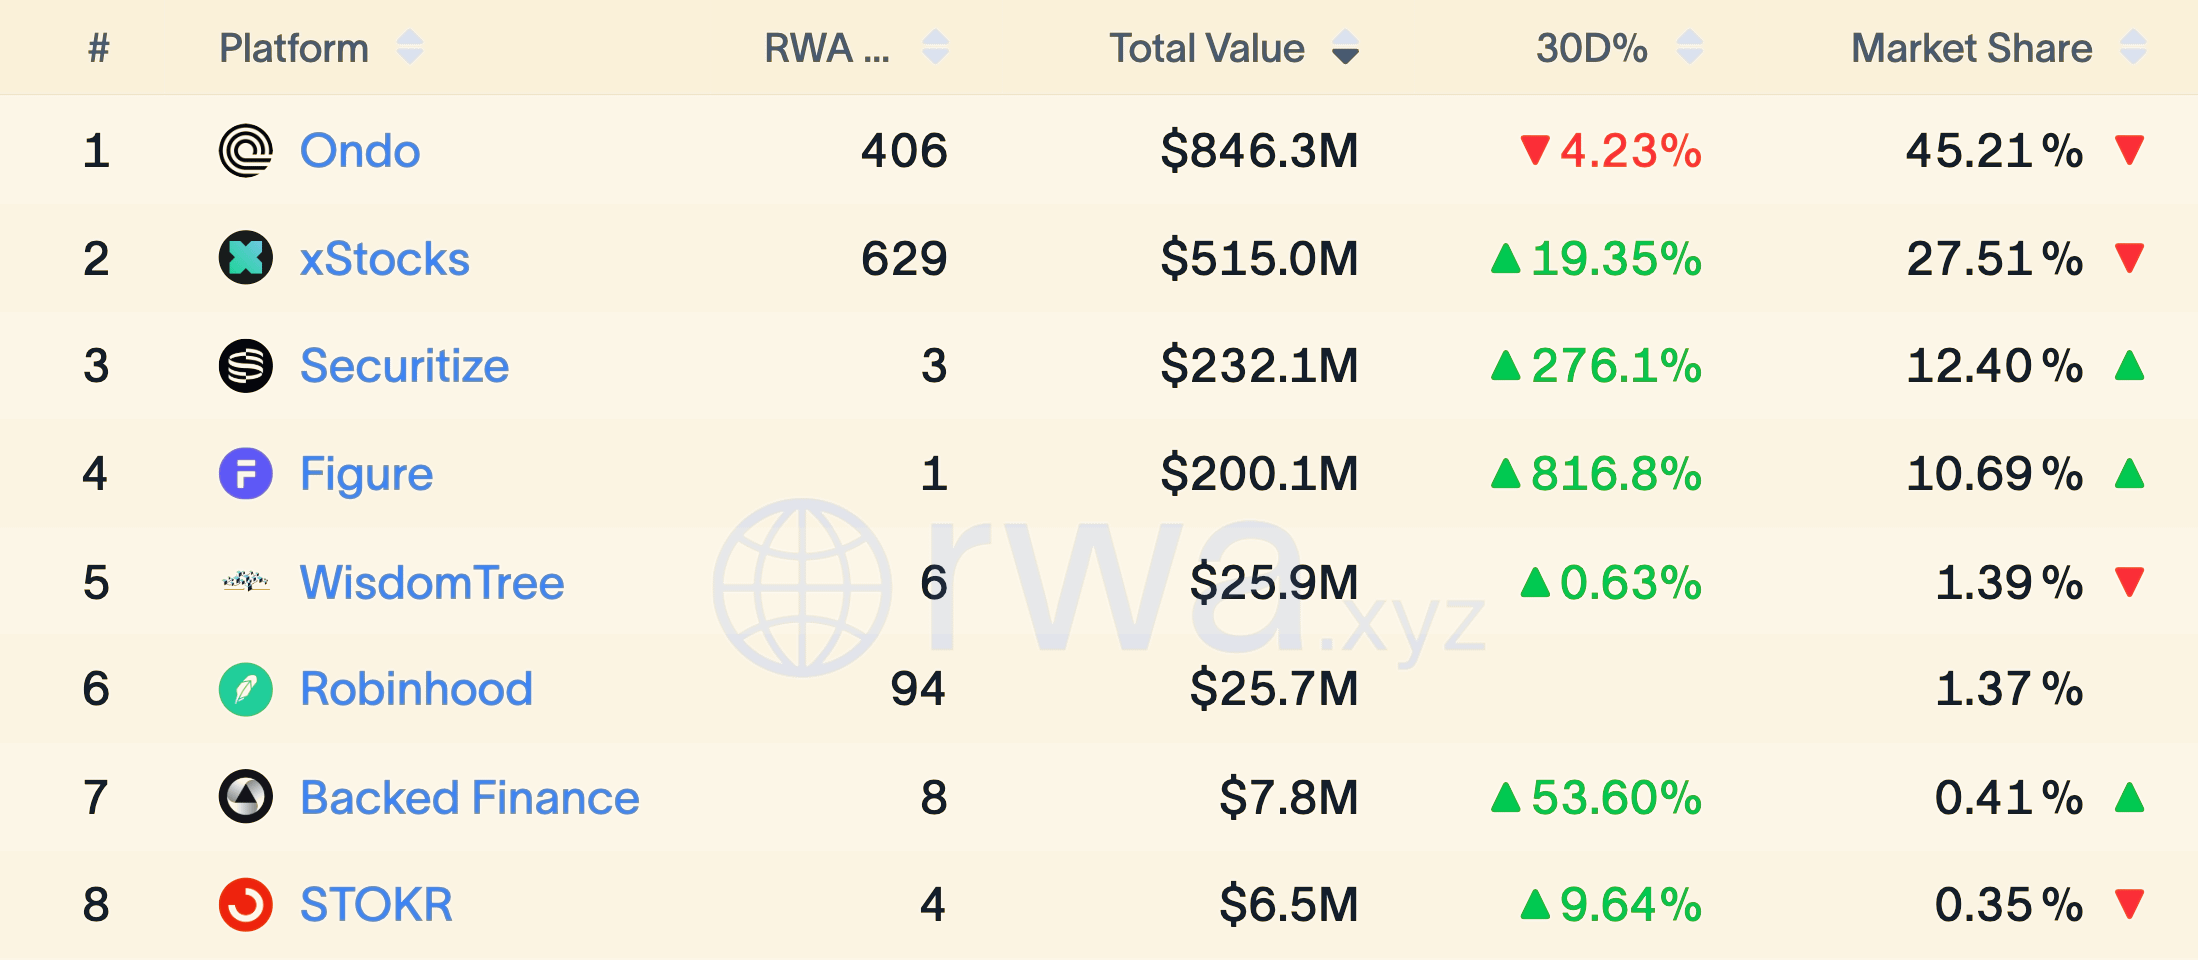
Concentration is even more visible at the platform level. Ondo and xStocks accounted for 72.7% of distributed value in the 29 July snapshot. Including Securitize increased the share held by the three largest platforms to 85.1%.
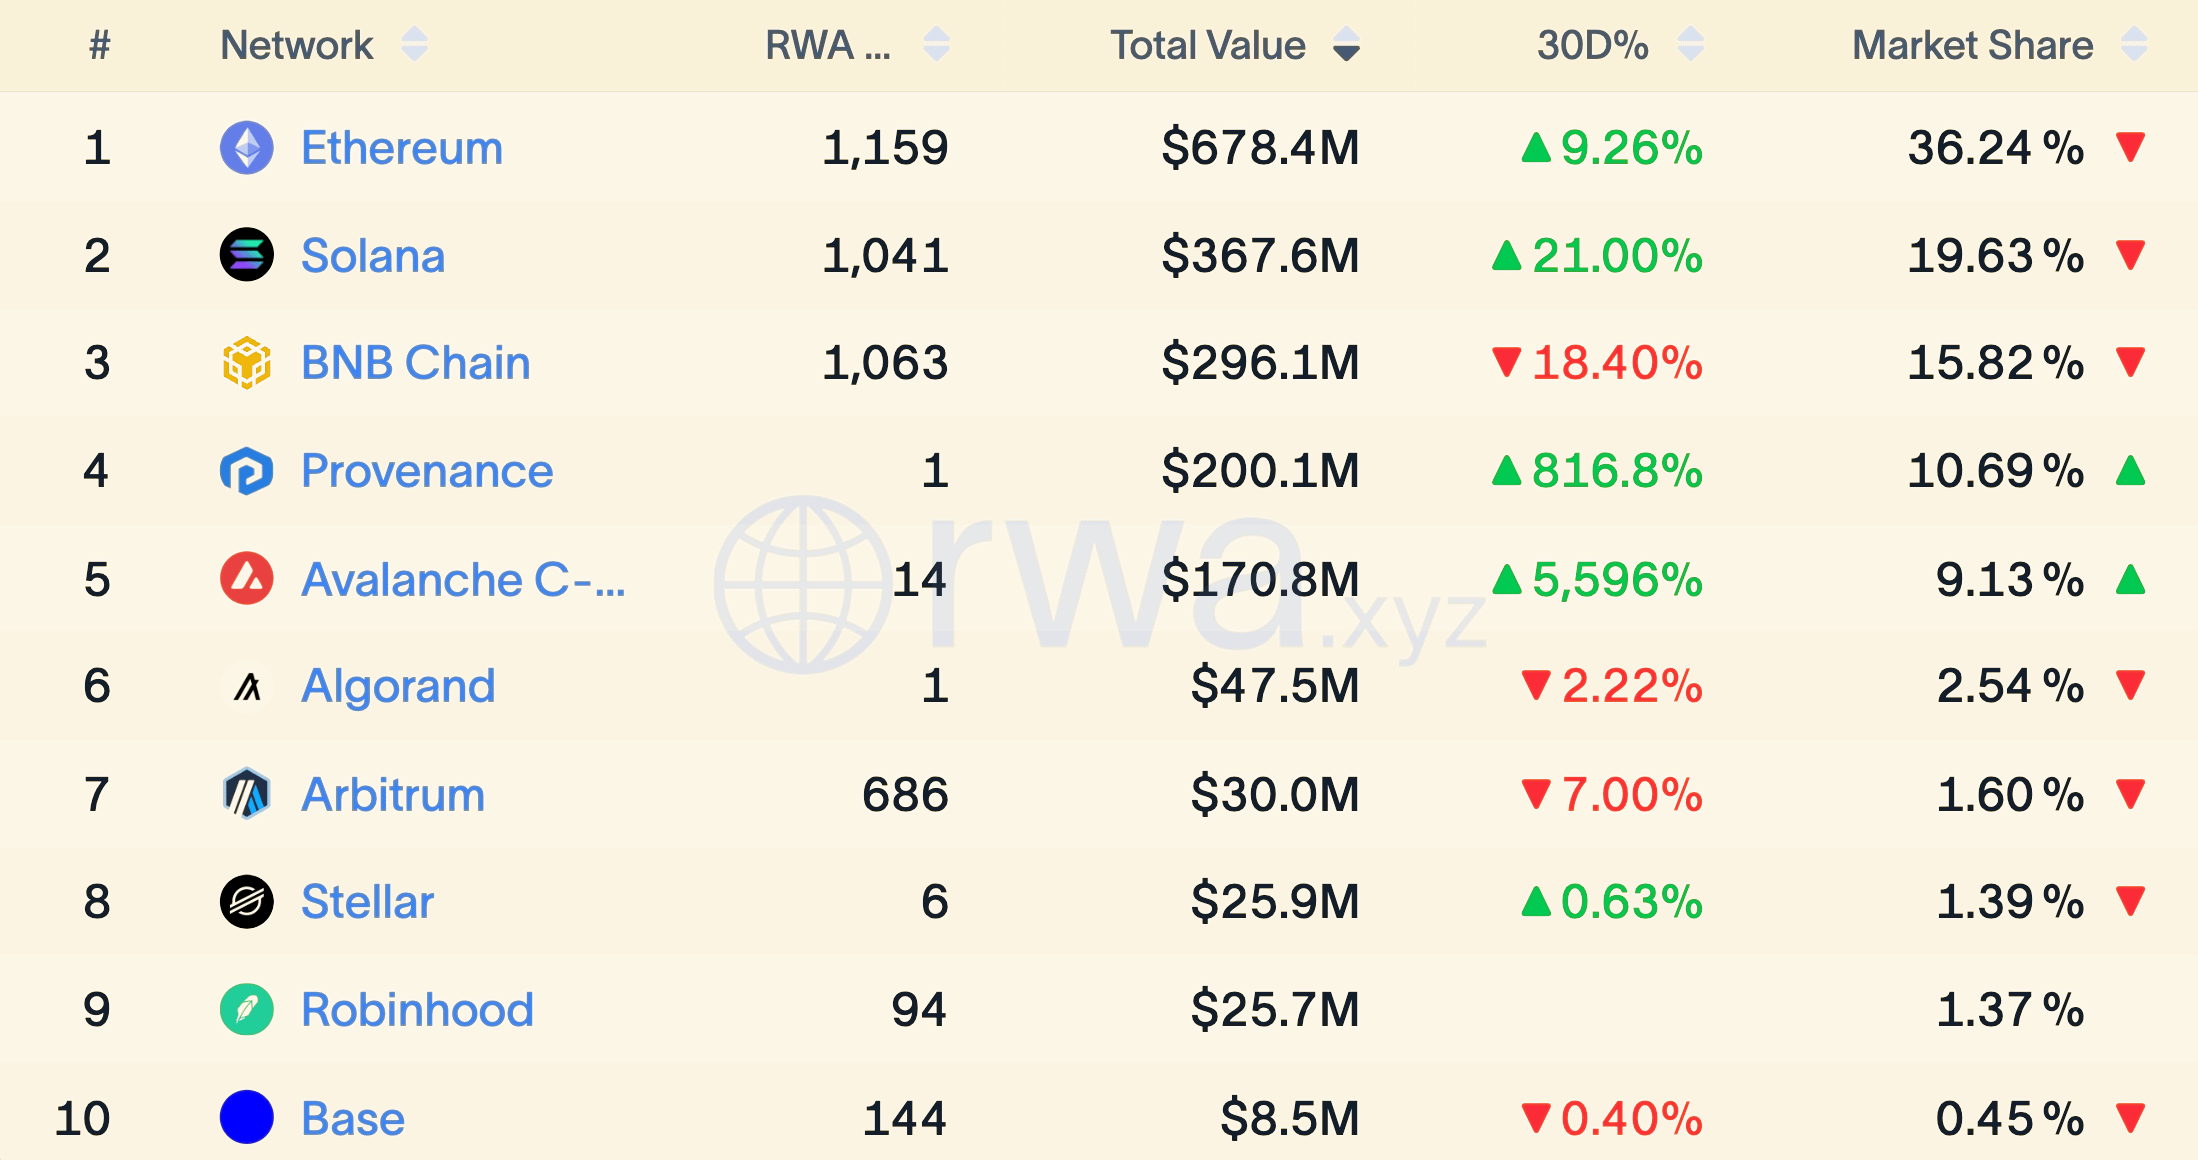
Distribution across blockchain networks is broader, but this does not eliminate common underlying dependencies. Ethereum led with 36.2% of value, followed by Solana at 19.6% and BNB Chain at 15.8%. Provenance and Avalanche were driven largely by Figure and Securitize respectively.
Products issued across different networks may still depend on the same wrapper issuer, broker, custodian, security agent or reference-price provider.
The market has become broader without becoming legally uniform. Several tokens can reference Apple shares or an S&P 500 ETF while remaining separate legal liabilities governed by different jurisdictions and dependent on different intermediaries.
Bridge adjustments can prevent the same token from being counted twice across networks. They cannot, and should not, combine products that reference similar assets but provide materially different legal claims.
All online sources were accessed on 29 July 2026 unless another date is stated.
insights4vc, The State of Onchain Real-World Assets, published 12 March 2026.
RWA.xyz market overview, data as of 29 July 2026.
RWA.xyz data catalog, live methodology.
CoinMarketCap Research, Tokenized Stocks: The Venue Landscape, published 23 June 2026.
SEC, Staff Statement on Tokenized Securities, 28 January 2026.
SEC, Order Approving Nasdaq Trading of Securities in Tokenized Form, 18 March 2026.
DTC no-action letter and operating conditions, 11 December 2025.
DTCC, Development of the Tokenization Service, 4 May 2026.
DTCC, Production Transactions Using DTC-Tokenized Assets, 15 July 2026.
DTCC, Stellar Integration, 27 May 2026.
DTCC, Collateral AppChain, 12 May 2026.
ICE, NYSE and Securitize Memorandum, 24 March 2026.
Ondo Global Markets legal structure, live terms.
xStocks legal overview, updated March 2026.
Kraken xStocks risk disclosure, live terms.
Kraken, SpaceX IPO Access Through xStocks, updated 12 June 2026.
The Wall Street Journal, SpaceX Token Allocation Shortfall, published 12 June 2026.
xStocks Kamino lending case study, 13 May 2026.
Robinhood Classic Stock Tokens FAQ, live terms.
Gemini Form 10-K, filed 30 March 2026.
Securitize, Tokenizing SECZ, 2 July 2026.
Figure blockchain-stock offering prospectus, 18 February 2026.
F/m Investments tokenized ETF share-class application, 21 January 2026.
ESMA, DLT Pilot Regime, live register.
Bank of England, Digital Securities Sandbox, updated 30 June 2026.
FINMA, First Swiss DLT Trading Facility, 18 March 2025.
Hong Kong SFC, Secondary Trading Framework, 20 April 2026.
DigiFT, SBI Japan High Dividend Equity Strategy Token, 15 July 2026.
BIS, Project Agorá, updated 27 May 2026.

The Tivoli Waterfalls
Hubert Robert, c. 1776
insights4vc provides independent research based primarily on publicly available information believed to be reliable at the time of publication. Figures may change because of market prices, token supply, reclassification and methodology updates. Legal structures, investor rights and regulatory treatment vary by product and jurisdiction.
This article does not constitute investment, legal, tax, accounting or financial advice, or an offer, solicitation or recommendation regarding any security, token, fund interest or other asset. insights4vc makes no representation regarding the completeness or accuracy of third-party data. Readers should conduct independent due diligence and consult appropriately qualified advisers before making investment or business decisions.
No posts
Comments
Nothing yet. Say the first thing.
Sign in to join the conversation.