
According to a new Civic Information Needs Census study of Chicago, 9 in 10 residents say it’s important to them to get information about local public safety, the local environment, and emergency and disaster preparedness. But fewer than 6 in 10 are satisfied with the information they can actually find.
Those 37, 36, and 35 percentage point gaps – between how important residents say information is on a topic and how satisfied they are with what they have – were the largest found in the study. But gaps existed on 12 of the 13 local topics surveyed:
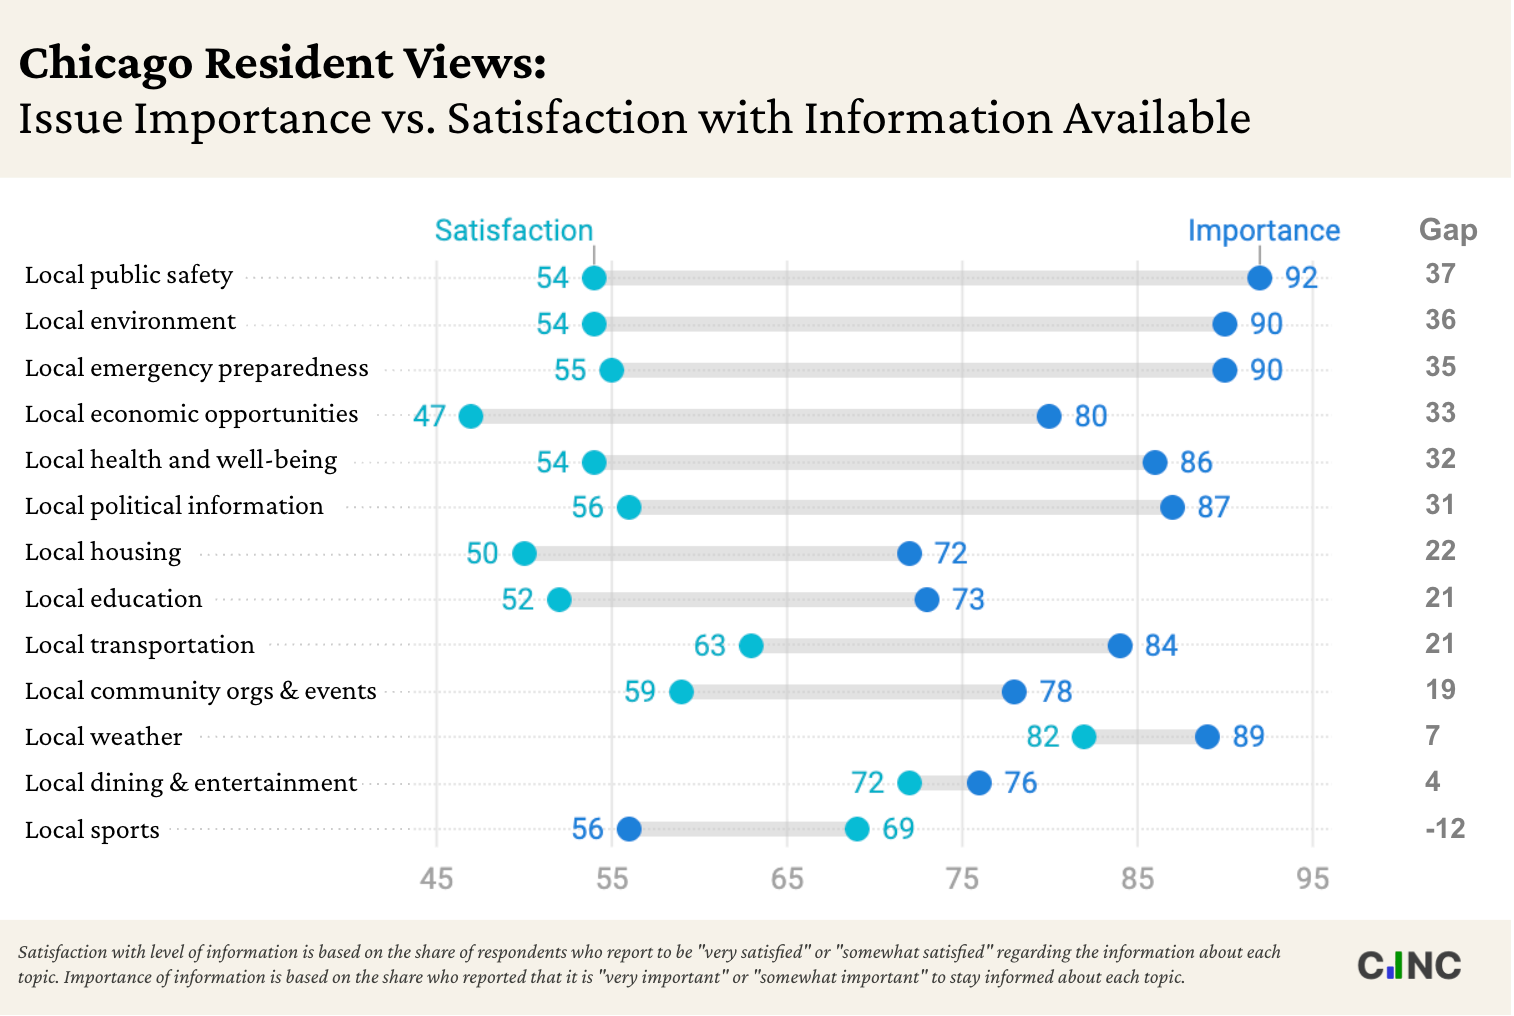
The new Chicago CINC data – based on a survey of 1,010 adults in Chicago conducted by Embold Research from May 28th to June 9th in partnership with Chicago Public Media – replicates one of the most consistent findings across all CINC studies: there is a consistent gap between how satisfied Americans are with the local news and information available to them and how important the say those issues are to their every day lives.
The full report and crosstabs for the 2026 Chicago CINC can be found here, along with past CINC studies.
The Civic Information Needs Census (CINC) is a research tool and initiative housed at Civic News Company and done in partnership with Embold Research.
It is designed to equip the civic information field – newsrooms, funders, libraries, government, and community organizations – with essential shared data on local information needs, media habits, and civic engagement. It is both a community survey and a coalition-building practice, designed to bring practitioners and funders together around a common set of facts so they can prioritize their work and track their impact over time.
CINC started in 2024 with a national baseline survey followed by pilots in Chicago and New York City. This year, we’re releasing results from four new studies done with local partners in each community: this second study of Chicago, Marin County, California, Tampa Bay, Florida, and Arkansas.
You can find the full reports and crosstabs for all studies at infocensus.org.
Last week, we shared a preview of this year’s new data by looking at the results that demonstrate the Proximity Paradox: the idea that Americans now find it easier to access news and information about the country and the world than they do about their own neighborhoods and towns or cities.
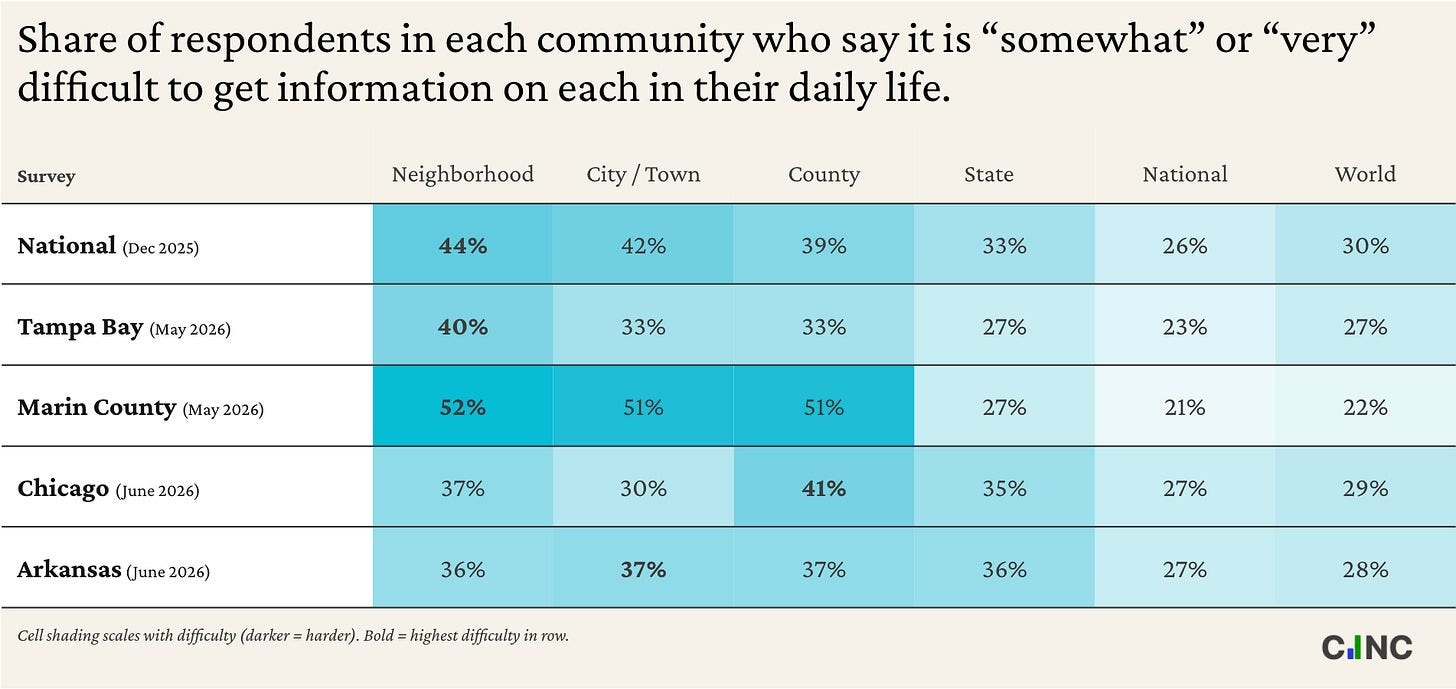
These new Chicago results broadly matched that pattern, with 37% of residents saying it is difficult to find information about their neighborhood and 41% saying it is difficult to find information about Cooks County, compared to just 27 and 29% saying the same about finding national and world news.
But one outlier worth celebrating is that just 30% of Chicago residents found it difficult to find news and information about the city of Chicago at-large, similar to the difficulty percentages for national and world news and a smaller share of respondents than in any community surveyed to date.
Is something going right in Chicago’s local news system worth learning from?
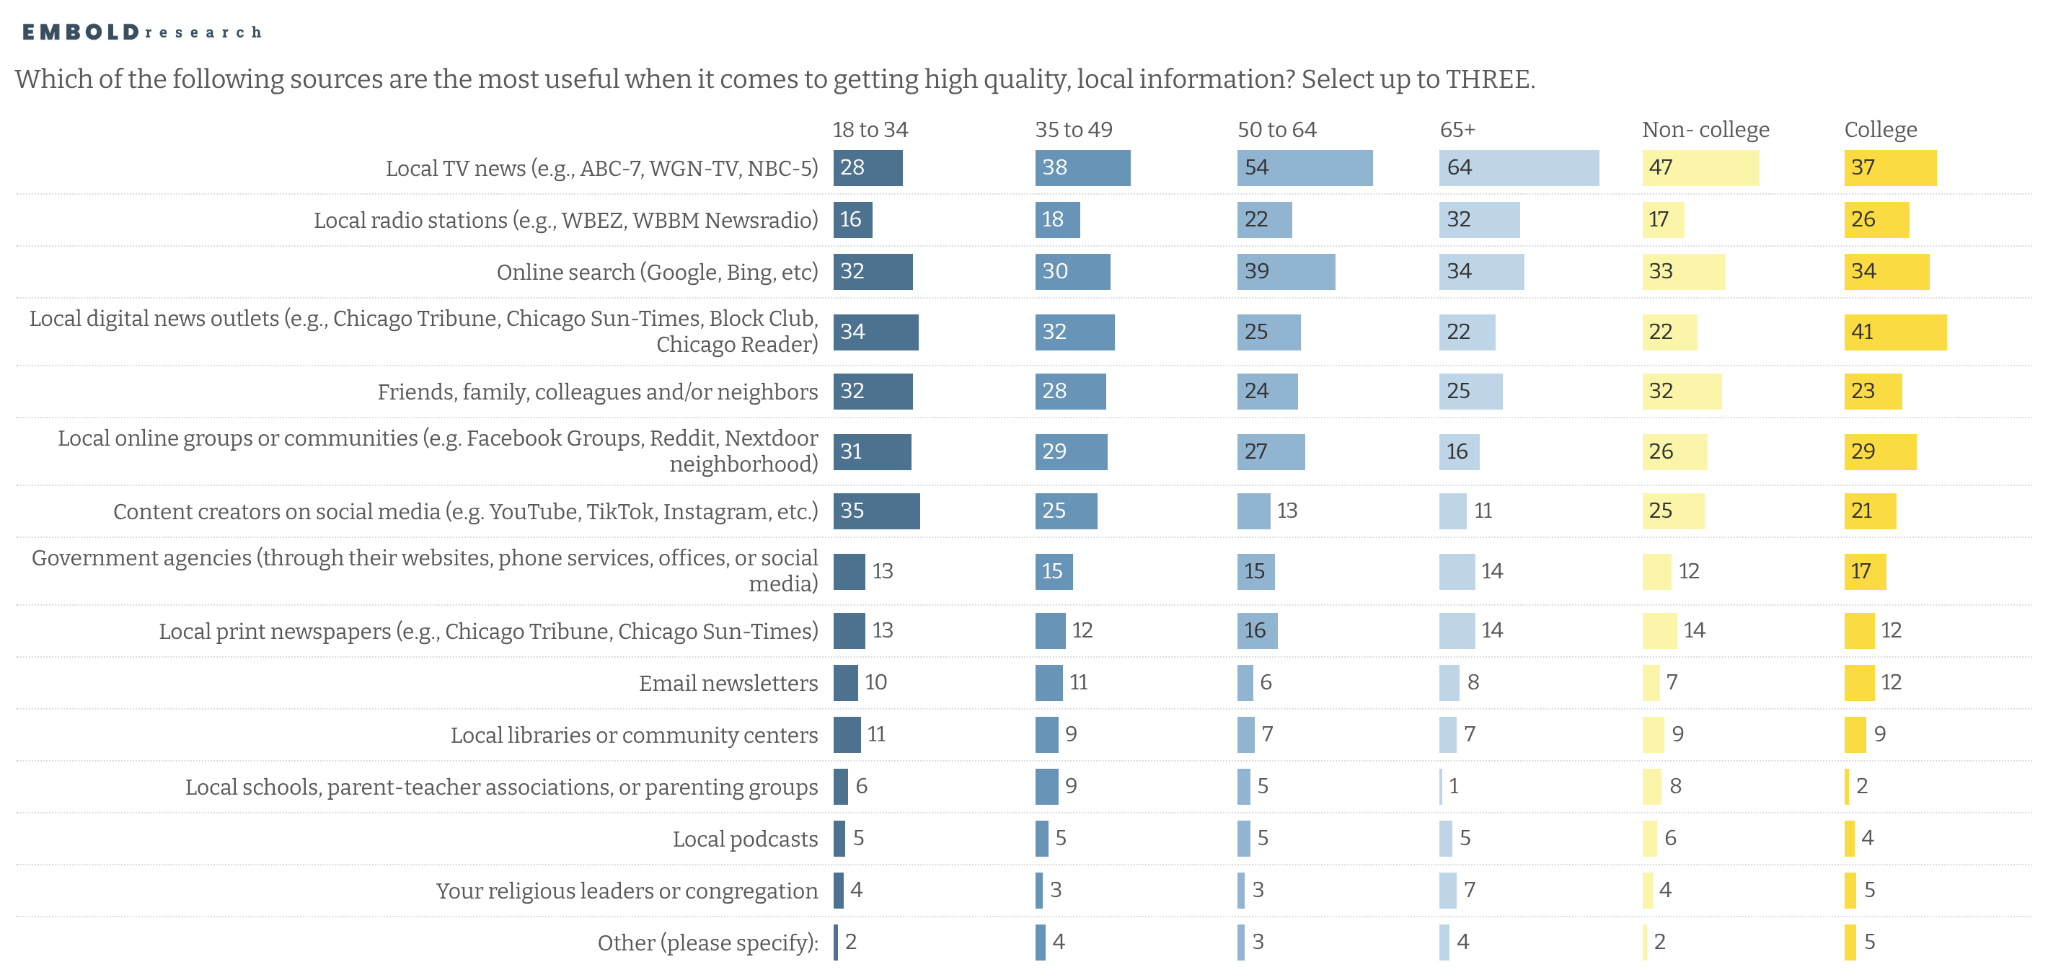
When asked to name up to three places they turn for trusted news, local TV news was the most-cited source, with 43% of residents turning to TV, 34% turning to online search, and 29% turning to local digital news outlets.
But those top-line figures mask a sharp generational divide. Among results 65 and older, nearly two-thirds (64%) cite local TV. Among residents under 35, social media content creators were the most cited (by 35% of respondents) followed by local digital outlets (34%), online search (32%), friends and family (32%), and online groups and communities (31%). For this younger group of residents, local TV was the 6th most-cited at just 28%.
More than two-thirds of Chicago residents (69%) say they’ve done at least one civic activity in the past 12 months. Contacting an elected official (36%), volunteering (30%), attending demonstrations or advocating for change (22% each) are the most common forms of participation city-wide.
But the regional breakdown reveals a persistent and significant gap. Central & North Side residents contacted an elected official at nearly twice the rate of Southwest Side residents (46% vs. 29%). The Far North & Northwest Sides also substantially outpace the South and Southwest on official contact (41% vs. 31% and 29%). Volunteering shows a tighter spread — 34% on the West Side, 25% on the South Side — with the West Side actually leading the city on that particular measure.
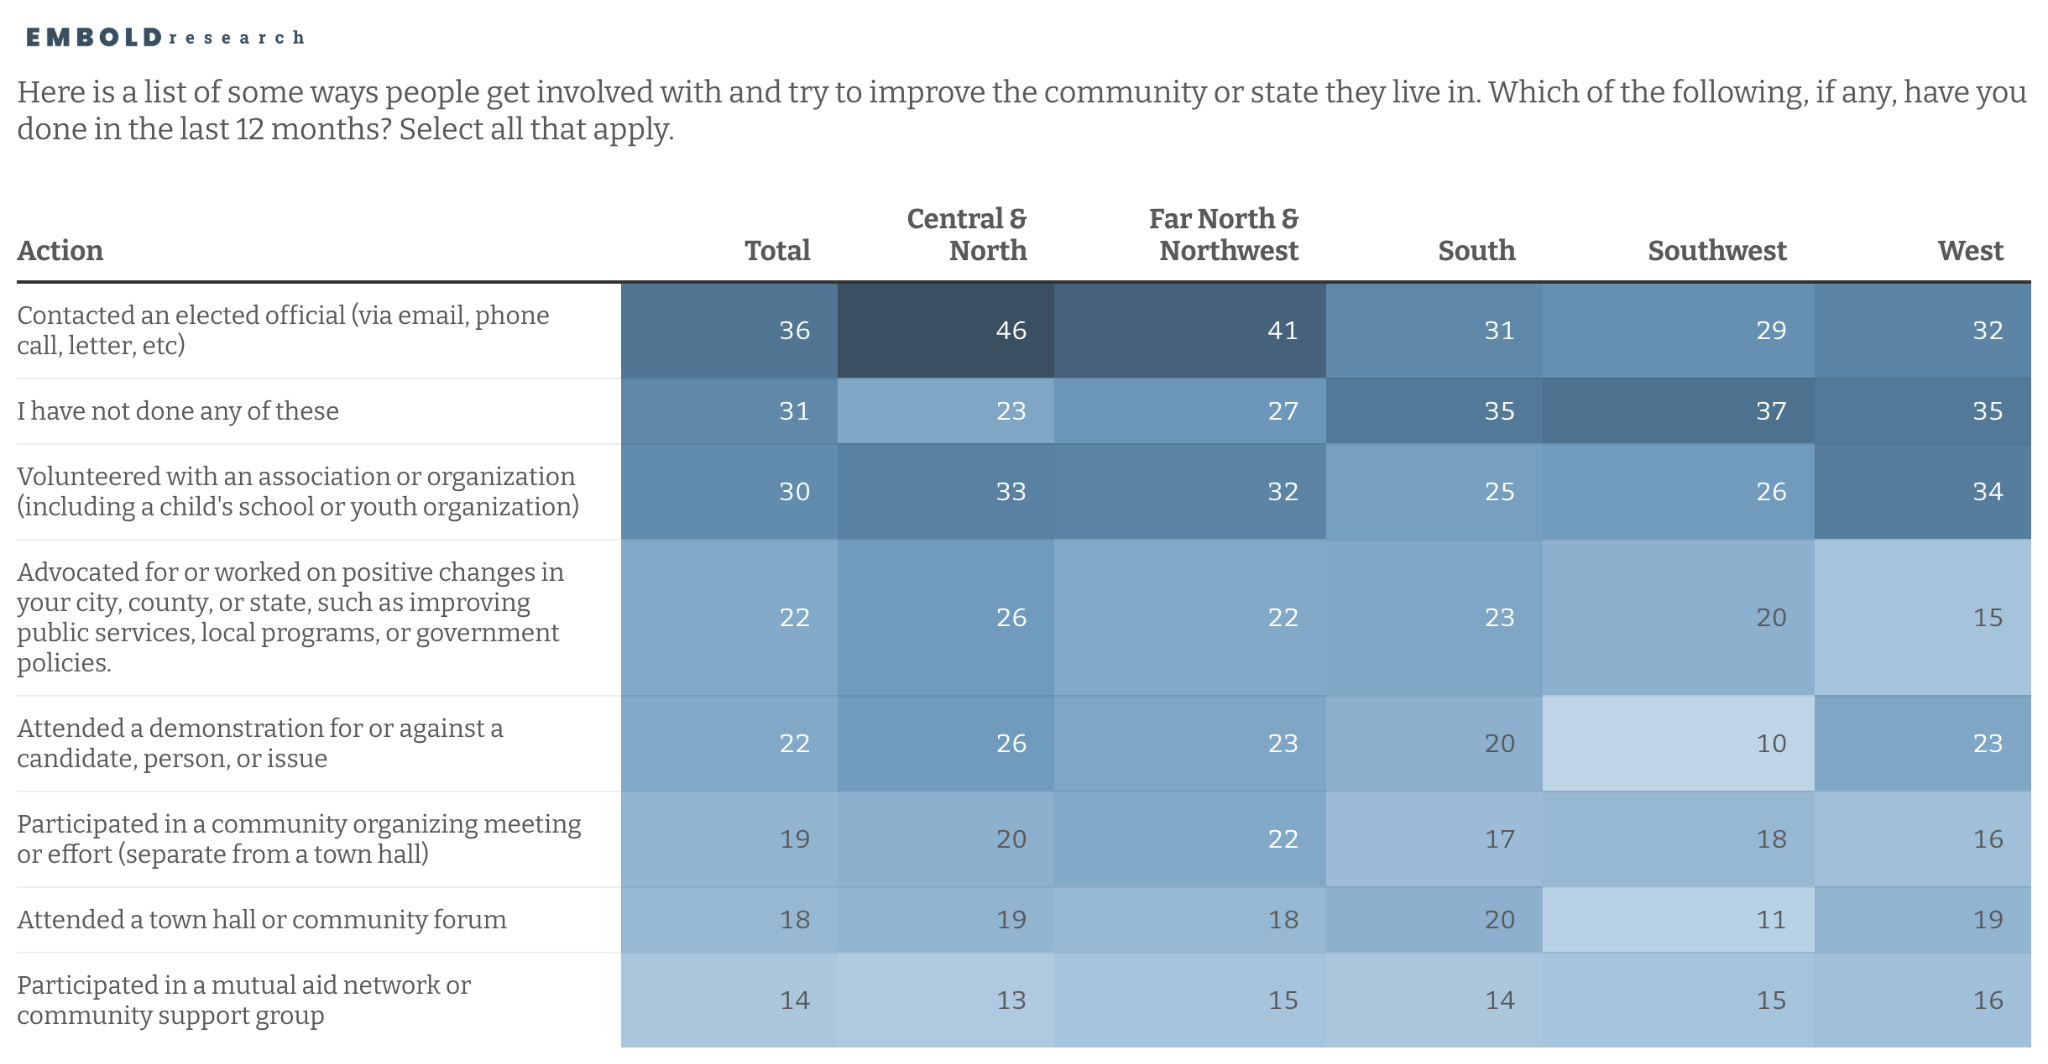
The Southwest Side shows the lowest rates for contacting officials, attending town halls, and attending a demonstration, while reporting the highest share saying they had done none of these activities (37%, vs. 23% in Central & North).
This pattern connects directly to the information access findings elsewhere in the study: South, Southwest, and West Side residents also report the most difficulty getting information at every geographic level. It is difficult to disentangle cause from effect — civic participation is driven in part by civic information, and civic information follows civic participation — but the concentration of both deficits in the same parts of the city is a signal worth tracking.
As we shared last week, Chicago is the first new CINC study of four that we’ll be sharing this summer. Still to come: the reports and crosstabs for Marin County, California, Tampa Bay, Florida, and Arkansas. Also to come: some additional analysis of key trends across the surveys, including a look at how these data compare to what we found in the pilot surveys in 2024.
Subscribe to get all that and more:
—
Figures show the share of respondents who said it is “very” or “somewhat” difficult to get information, in response to the question: “How difficult is it for you to get information about each of the following in your day-to-day life?” Surveys were conducted by the Civic Information Needs Census with Embold Research.
The national survey was conducted among registered voters nationwide, while the four community studies were conducted among adults in each community.
National (Dec 2025) — fielded December 15–21, 2025; n = 1,765 (weighted); margin of error 2.4%.
Tampa Bay (May 2026) — fielded May 15–26, 2026; n = 1,006 (weighted); margin of error 3.1%.
Marin County (May 2026) — fielded May 14–22, 2026; n = 832 (weighted); margin of error 3.6%.
Chicago (Jun 2026) — fielded May 28–June 9, 2026; n = 1,010 (weighted); margin of error 3.1%.
Arkansas (Jun 2026) — fielded June 9–18, 2026; n = 1,011 (weighted); margin of error 3.3%.
For reference, a broader December 2025–February 2026 national sample that also included non-registered-voter adults (n = 2,241; margin of error 2.1%) shows the same broad pattern with somewhat smaller gaps — for example, the gap between neighborhood and national news is +15 percentage points rather than +18.
No posts
Comments
Nothing yet. Say the first thing.
Sign in to join the conversation.