
Returning to our theme from two weeks ago, the volatility in mega-caps is weighing on the S&P 500 and masking the continued improvement in conditions beneath the surface. An ETF based on the “Magnificent Seven” mega-cap tech companies was down nearly 6% last week. These seven stocks make up 30% of the market cap of the S&P 500, so their weakness has an outsized effect on the broader index. The S&P 500 was down 2% last week and finished below its 50-day average for the first time since early April.
The average stock in the index, however, fared better than the index itself. The equal-weight S&P 500 was up more than 1% last week and the small-cap S&P 600 was up over 3% for the week. Both finished at new all-time highs. The Value Line Geometric index (which we highlighted two weeks ago) continues to climb as well and is approaching a new high of its own.
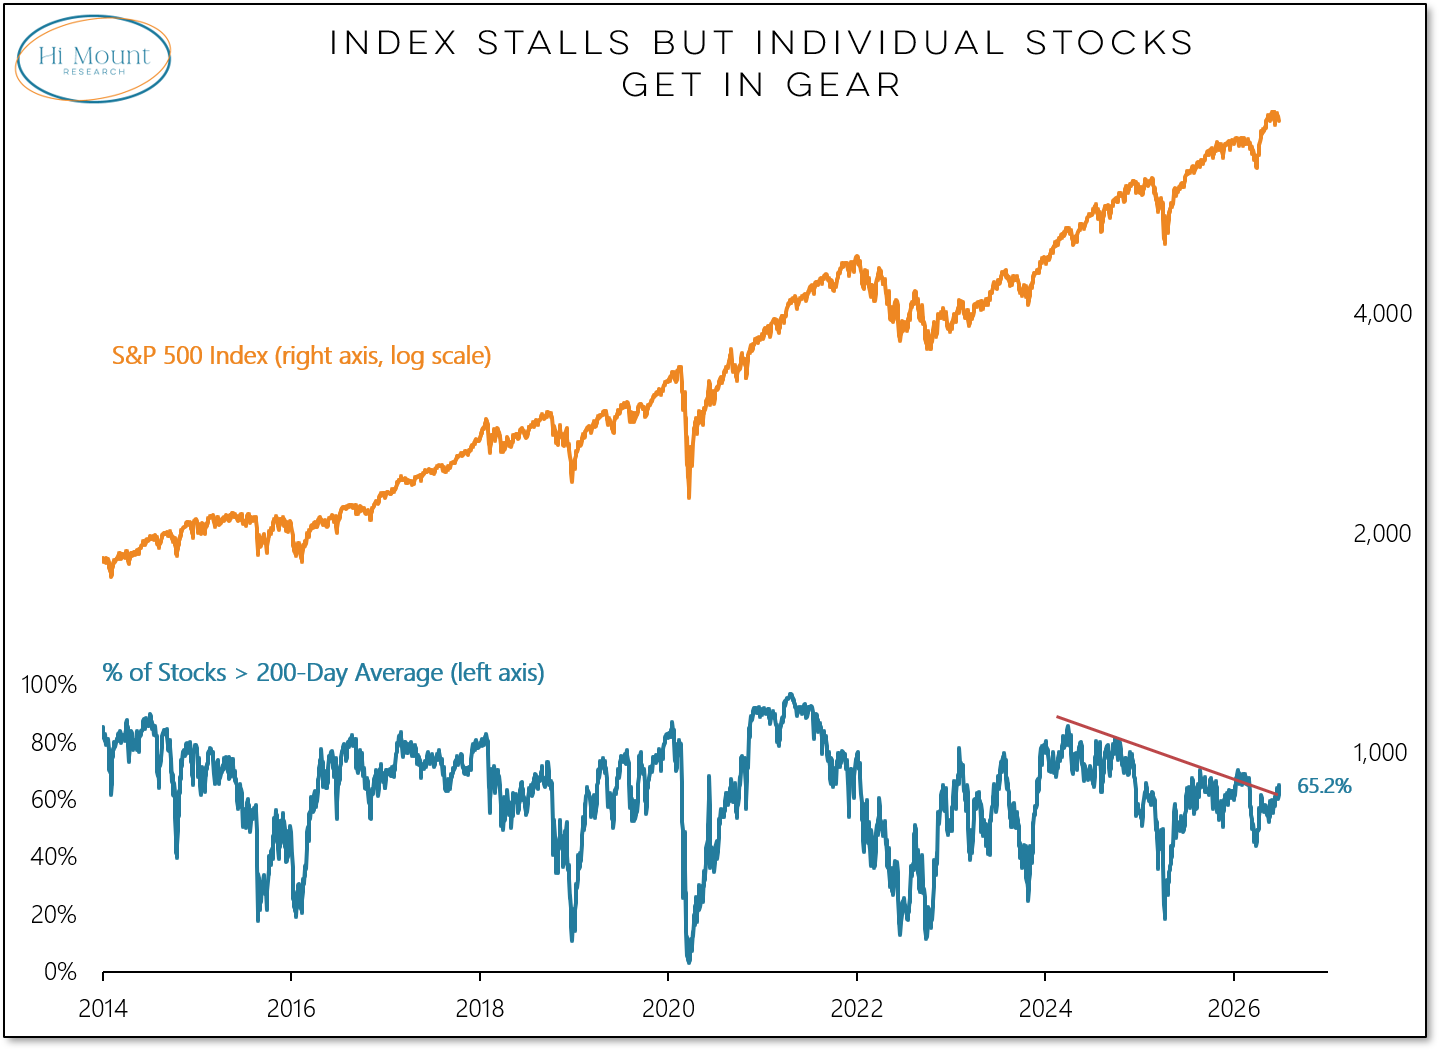
While the S&P 500 has slipped below its 50-day average, the percentage of stocks within the index that are above their 200-day averages is expanding and last week climbed to its highest level since before bombs started falling in Iran. At 65%, it is not historically high but it is heading in a favorable direction.
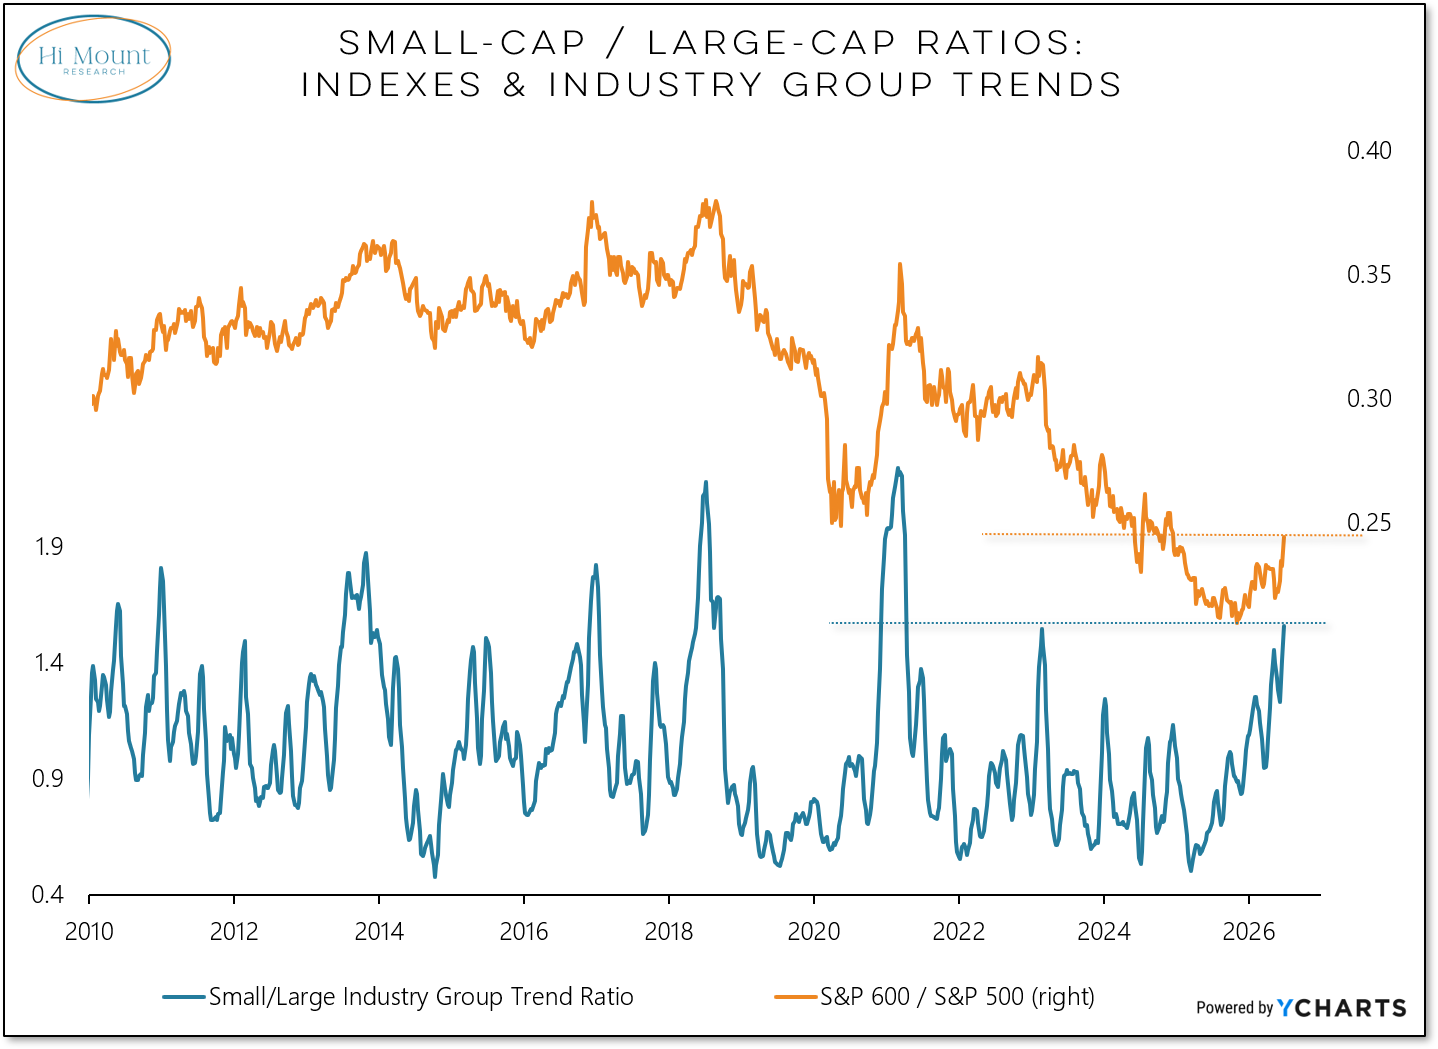
The rotation away from large-caps and toward small-caps is gaining momentum both at the index-level and beneath the surface. With the S&P 600 up 3% last week and the S&P 500 down 2%, the ratio between the indexes surged to its highest level in two years. Looked at from the perspective of industry group trends, the small-cap/large-cap ratio has climbed to a 5 year high.
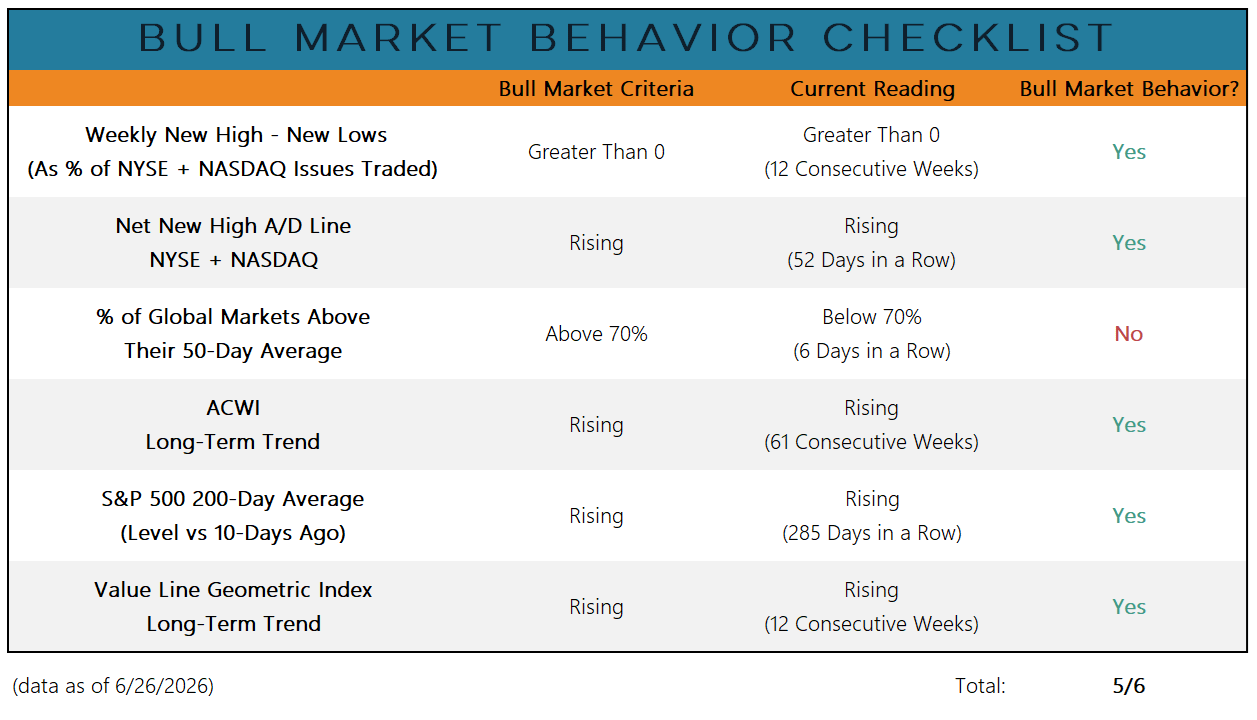
While the S&P 500 has stumbled over the last few weeks, it has not notably impacted our Bull Market Behavior Checklist. As mentioned last week, the percent of global markets above their 50-day averages has retreated (an updated chart is available here), but otherwise, bullish conditions persist. Trends are rising and more stocks are making new highs than new lows.
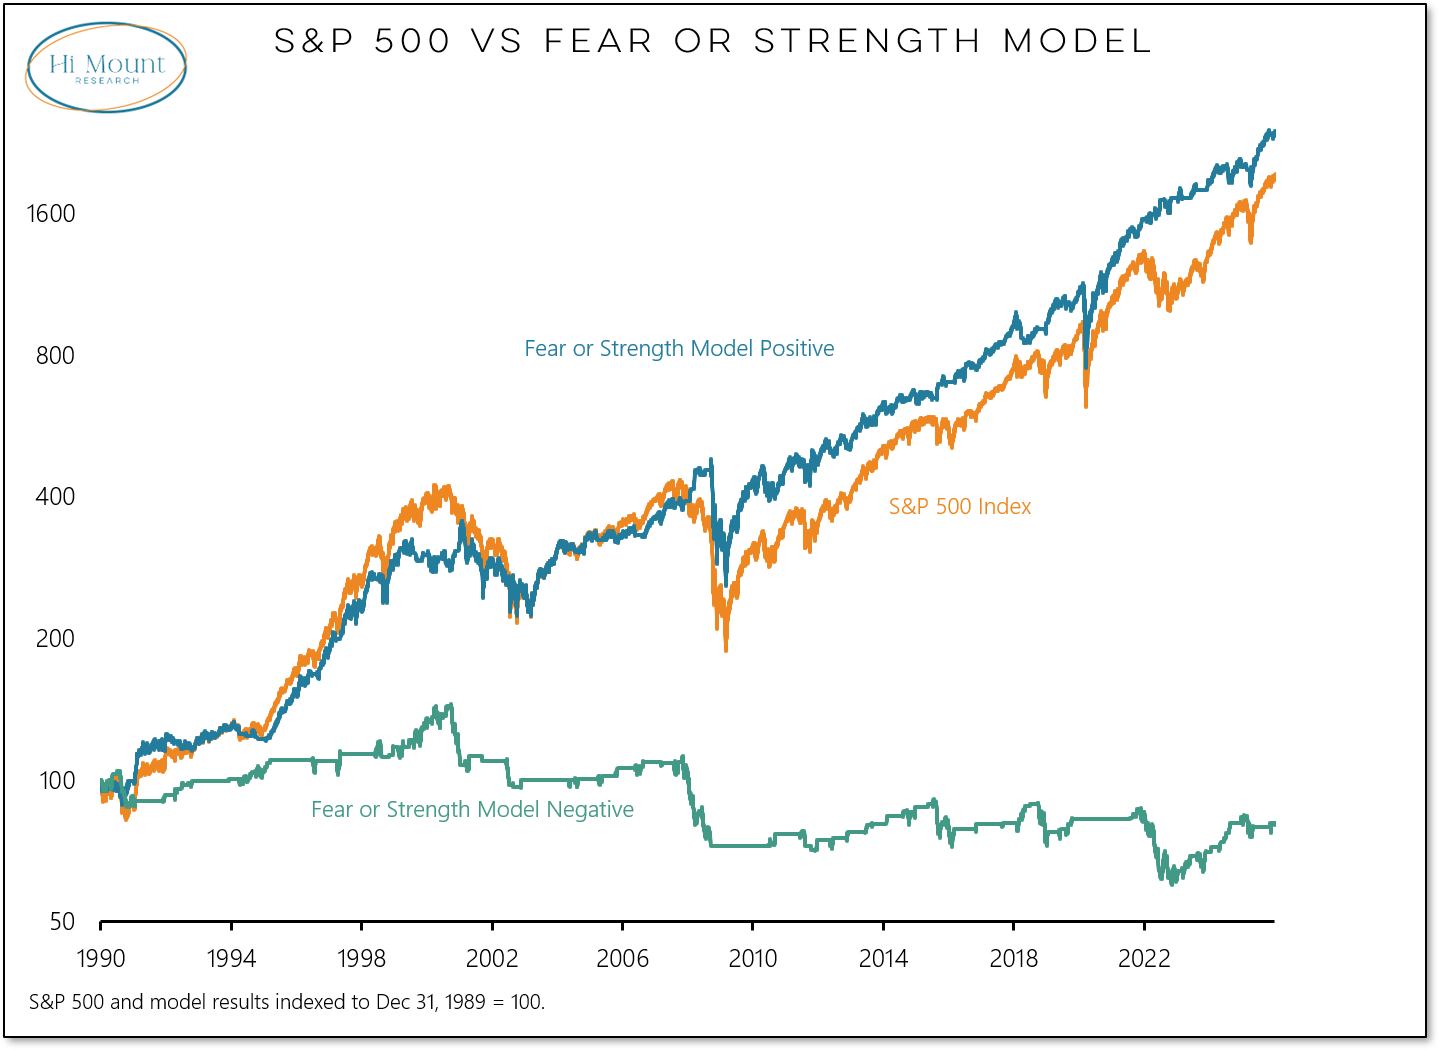
The persistence of more new highs than new lows helps keep our Fear or Strength Tactical Model on a bullish signal.
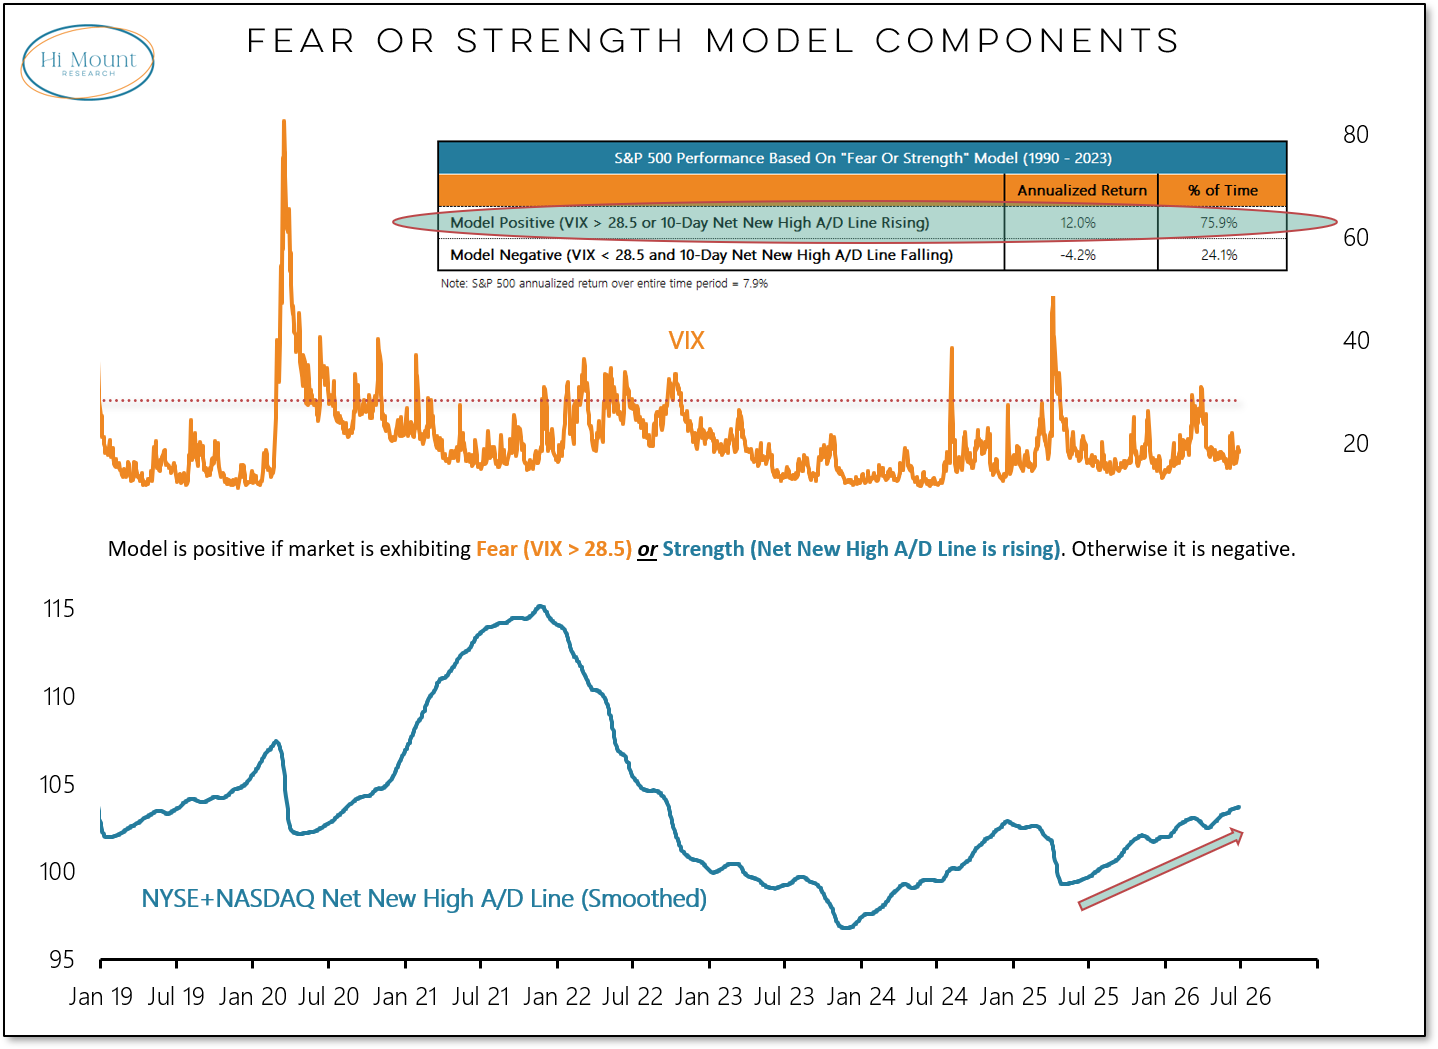
All of the net gains for the S&P 500 over the past 35+ years have come when this model has positive. Stepping aside when this model has been negative has been a great way to reduce portfolio volatility without sacrificing upside. It is not a set it and forget it approach, but if you are reading this, you probably aren’t inclined to set it and forget it anyway.
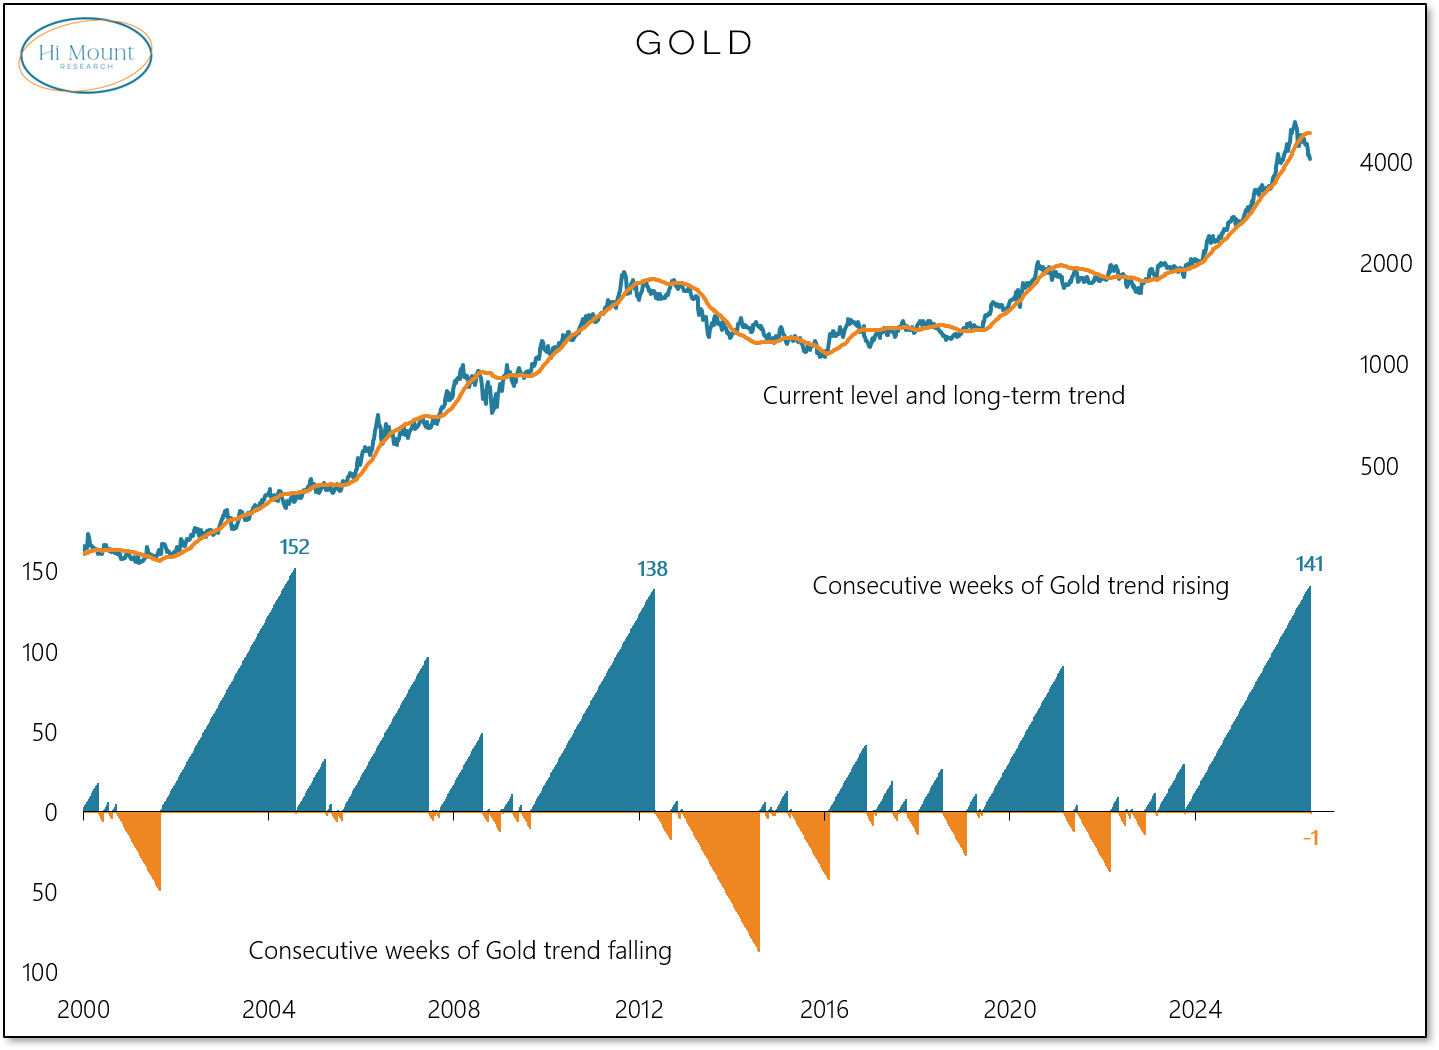
Equity market trend and breadth strength persists, but we have seen a notable shift in the trend environment elsewhere. After 141 weeks with a rising trend (the longest uninterrupted period of strength in over two decades) the long-term trend for gold turned lower last week. The trend, for now, is no longer the friend for Gold Bugs.
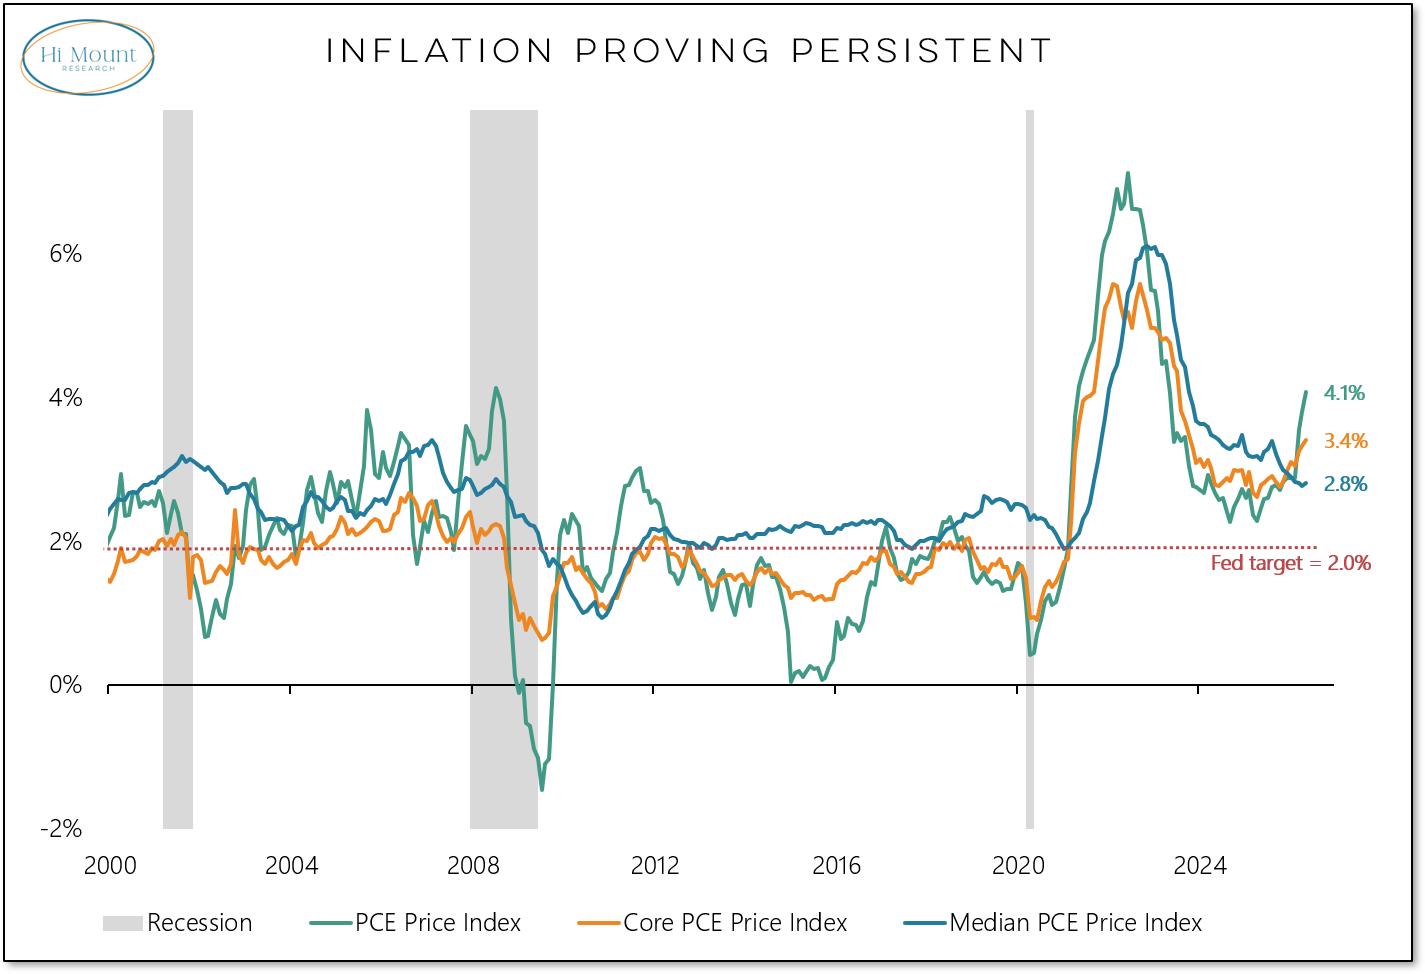
The trend is not the friend of inflation fighters either. PCE inflation data (which gets around the fixed-basket distortions of the CPI) showed a spike in headline inflation, with both the core and median indexes also pushing higher. It has been a long-time since inflation was anywhere near the Fed’s target of 2%. Median PCE inflation has been running over 2% for over a decade and all three of these indexes have been above 2% for 5 years and counting. New Fed Chair Kevin Warsh is right to focus on fighting inflation, but he clearly has his work cut out for him.
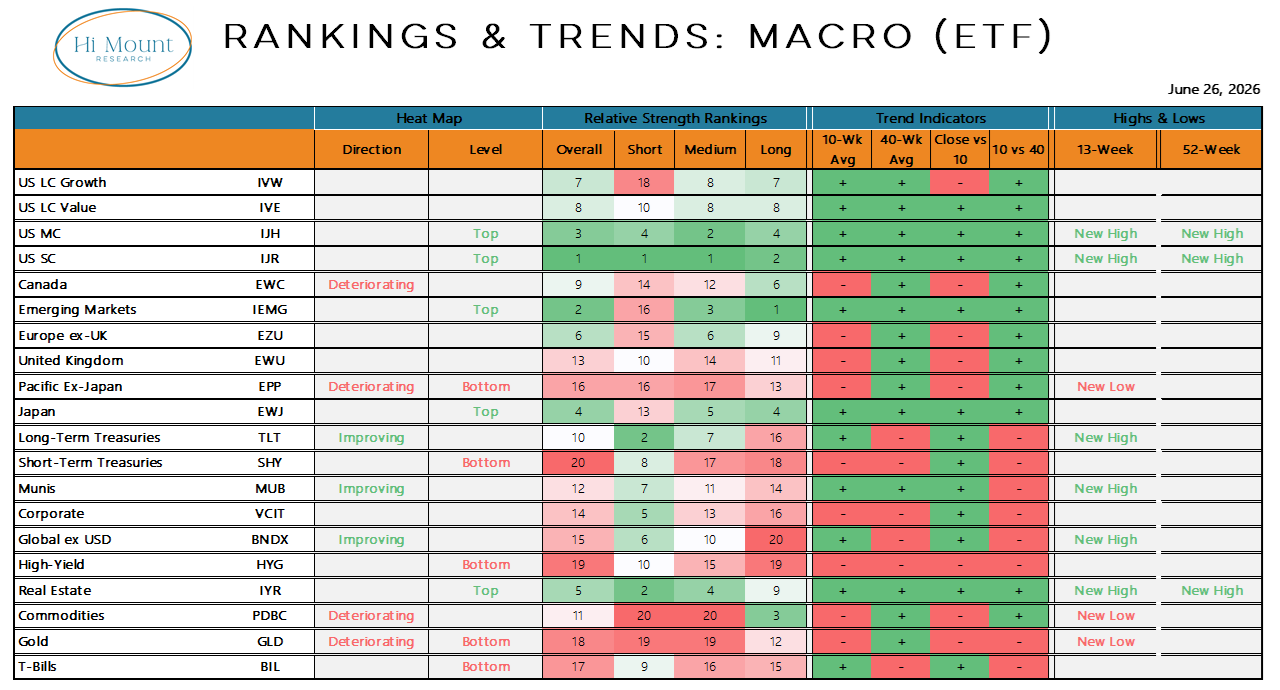
Bringing it back to the markets, and the question of what to do in the current environment, the answer is usually the same: avoid weakness and lean into strength. From a global macro perspective right now, that means focusing on US mid-caps and small-caps and Emerging Markets and maybe sprinkling in some Japan and Real Estate. Our Weekly Relative Strength Rankings Report takes a closer look at US sector and international rankings.
That’s all for this week. Thanks for reading! -Willie
Comments
Nothing yet. Say the first thing.
Sign in to join the conversation.