
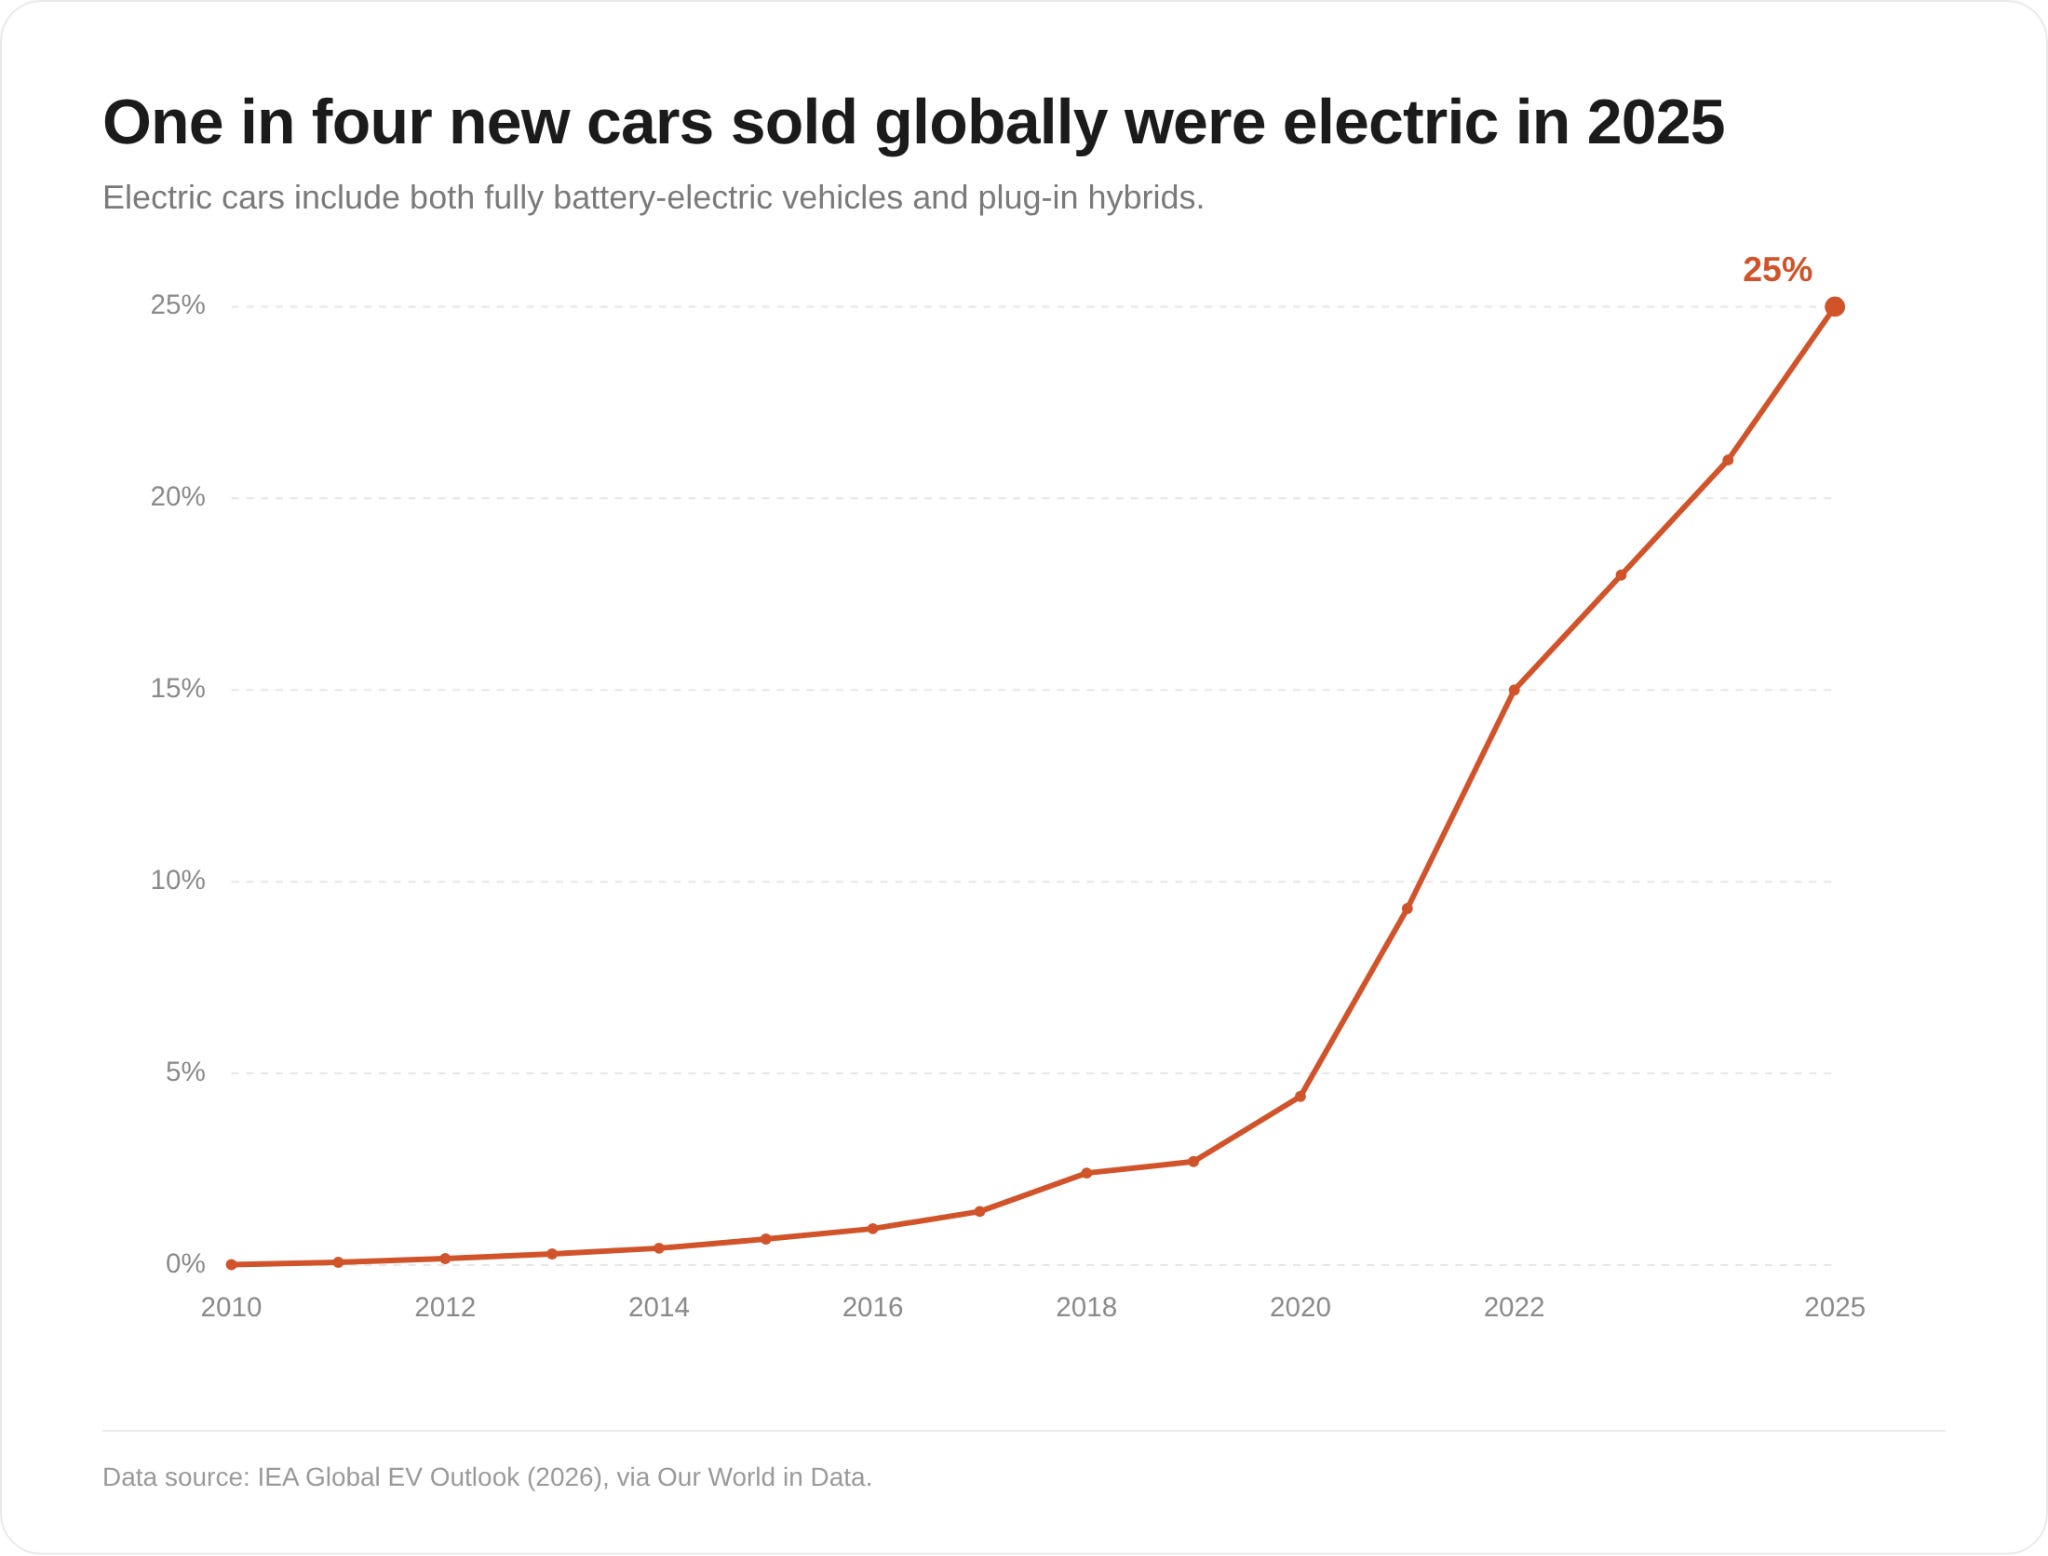
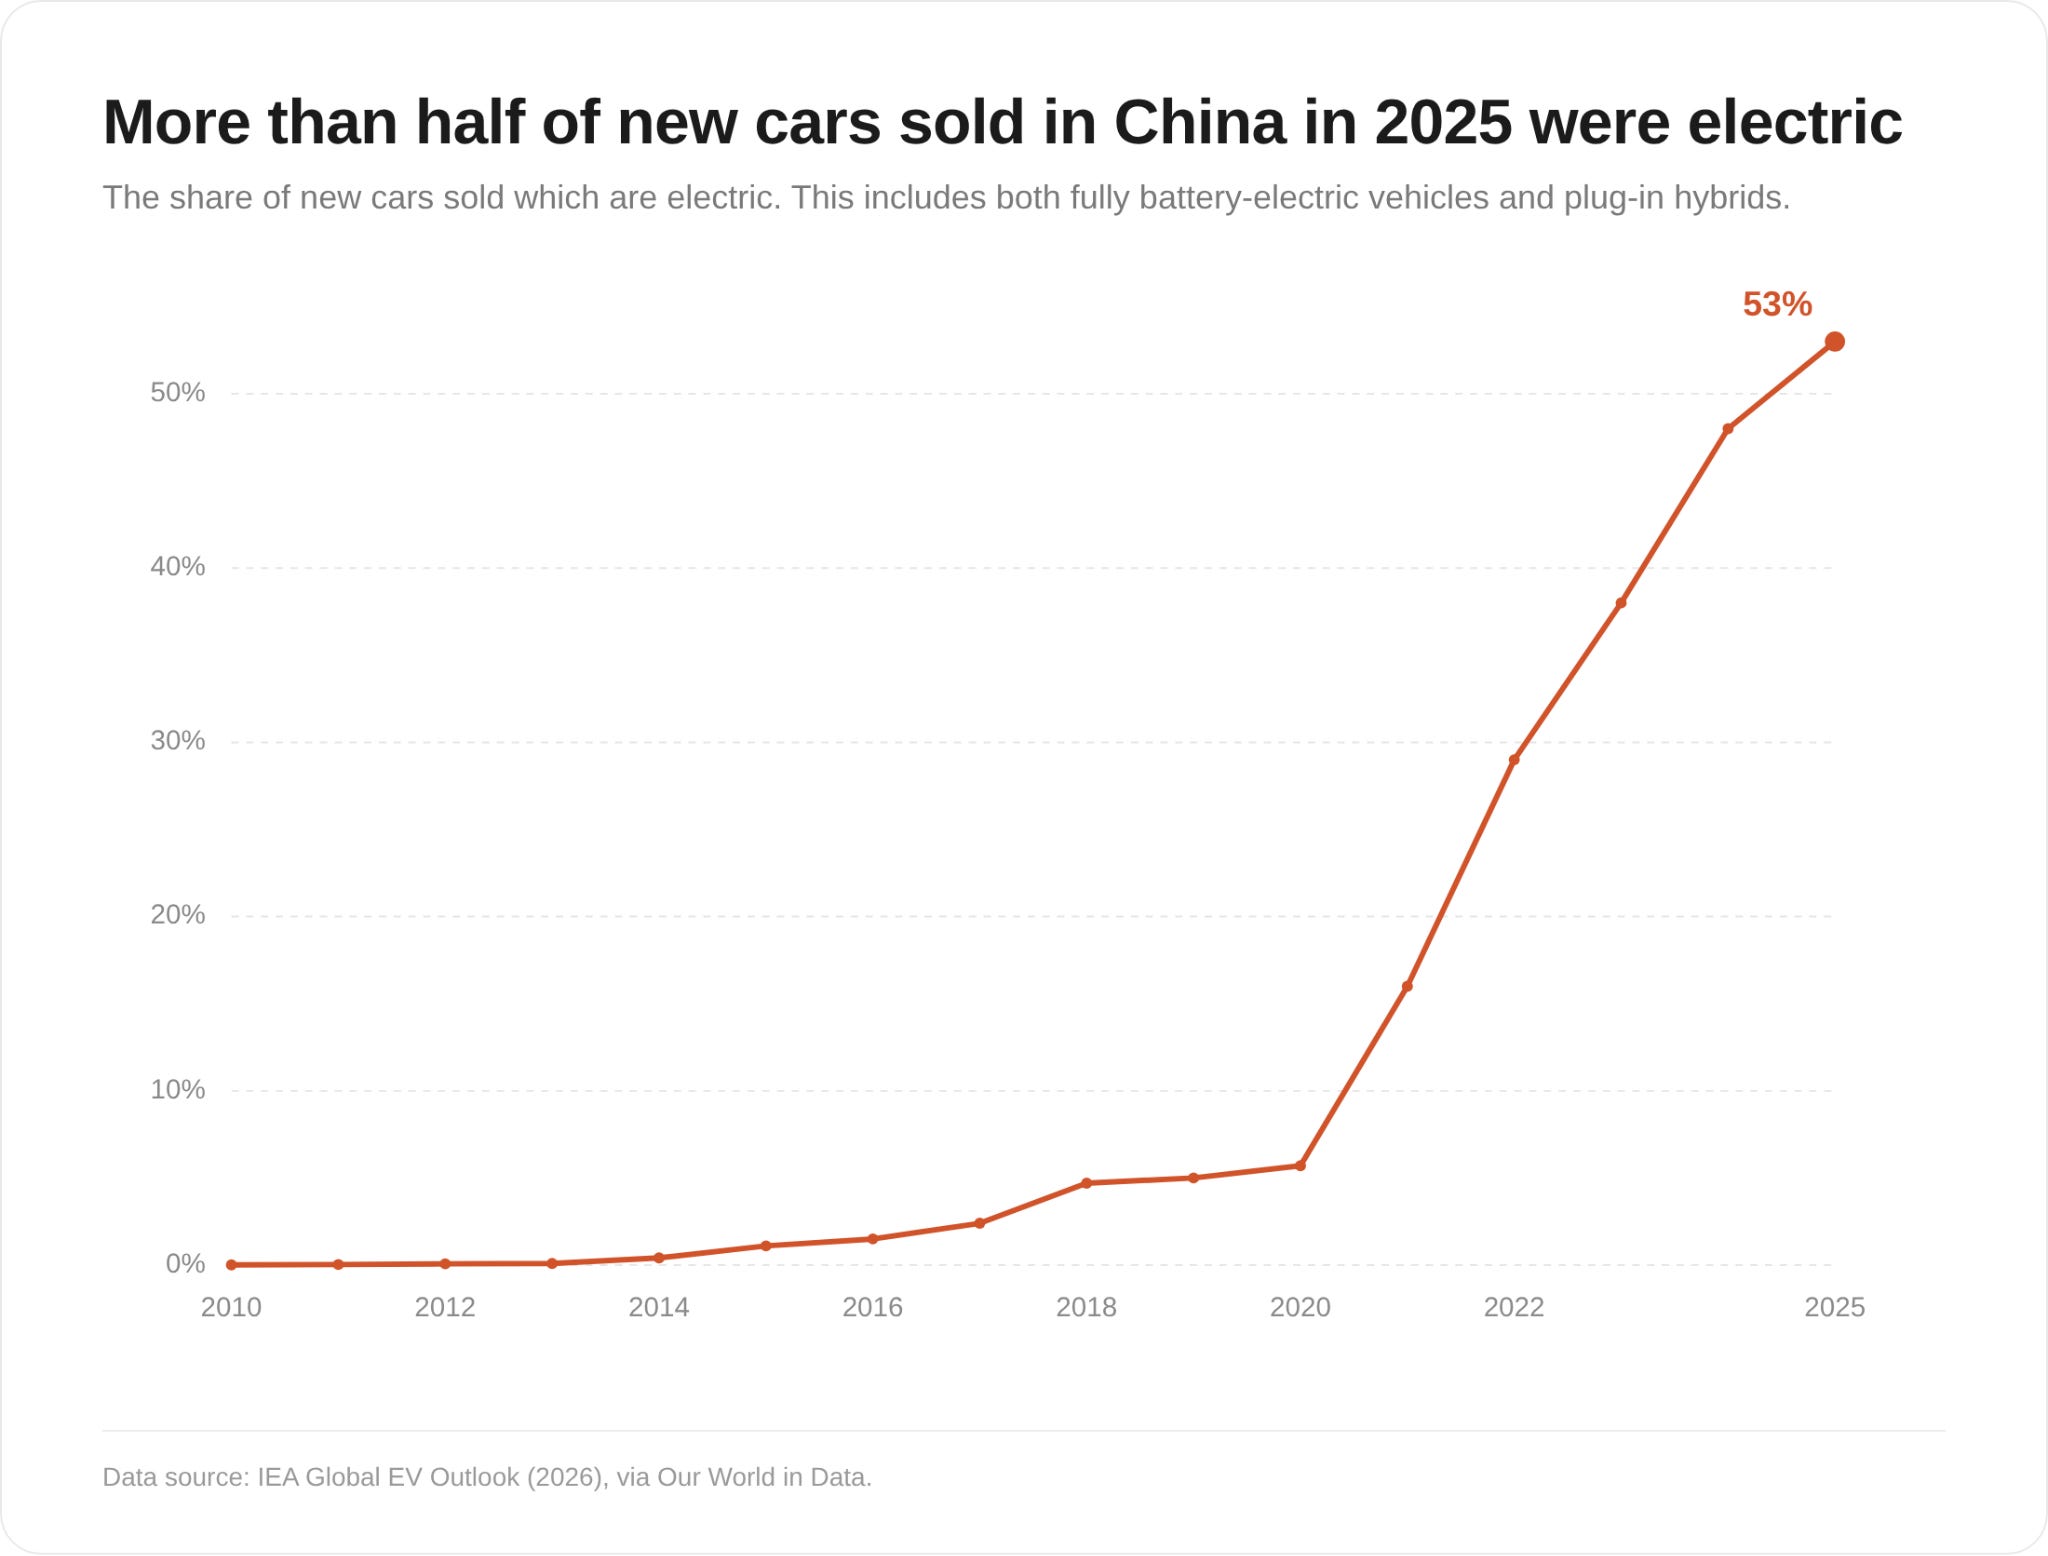
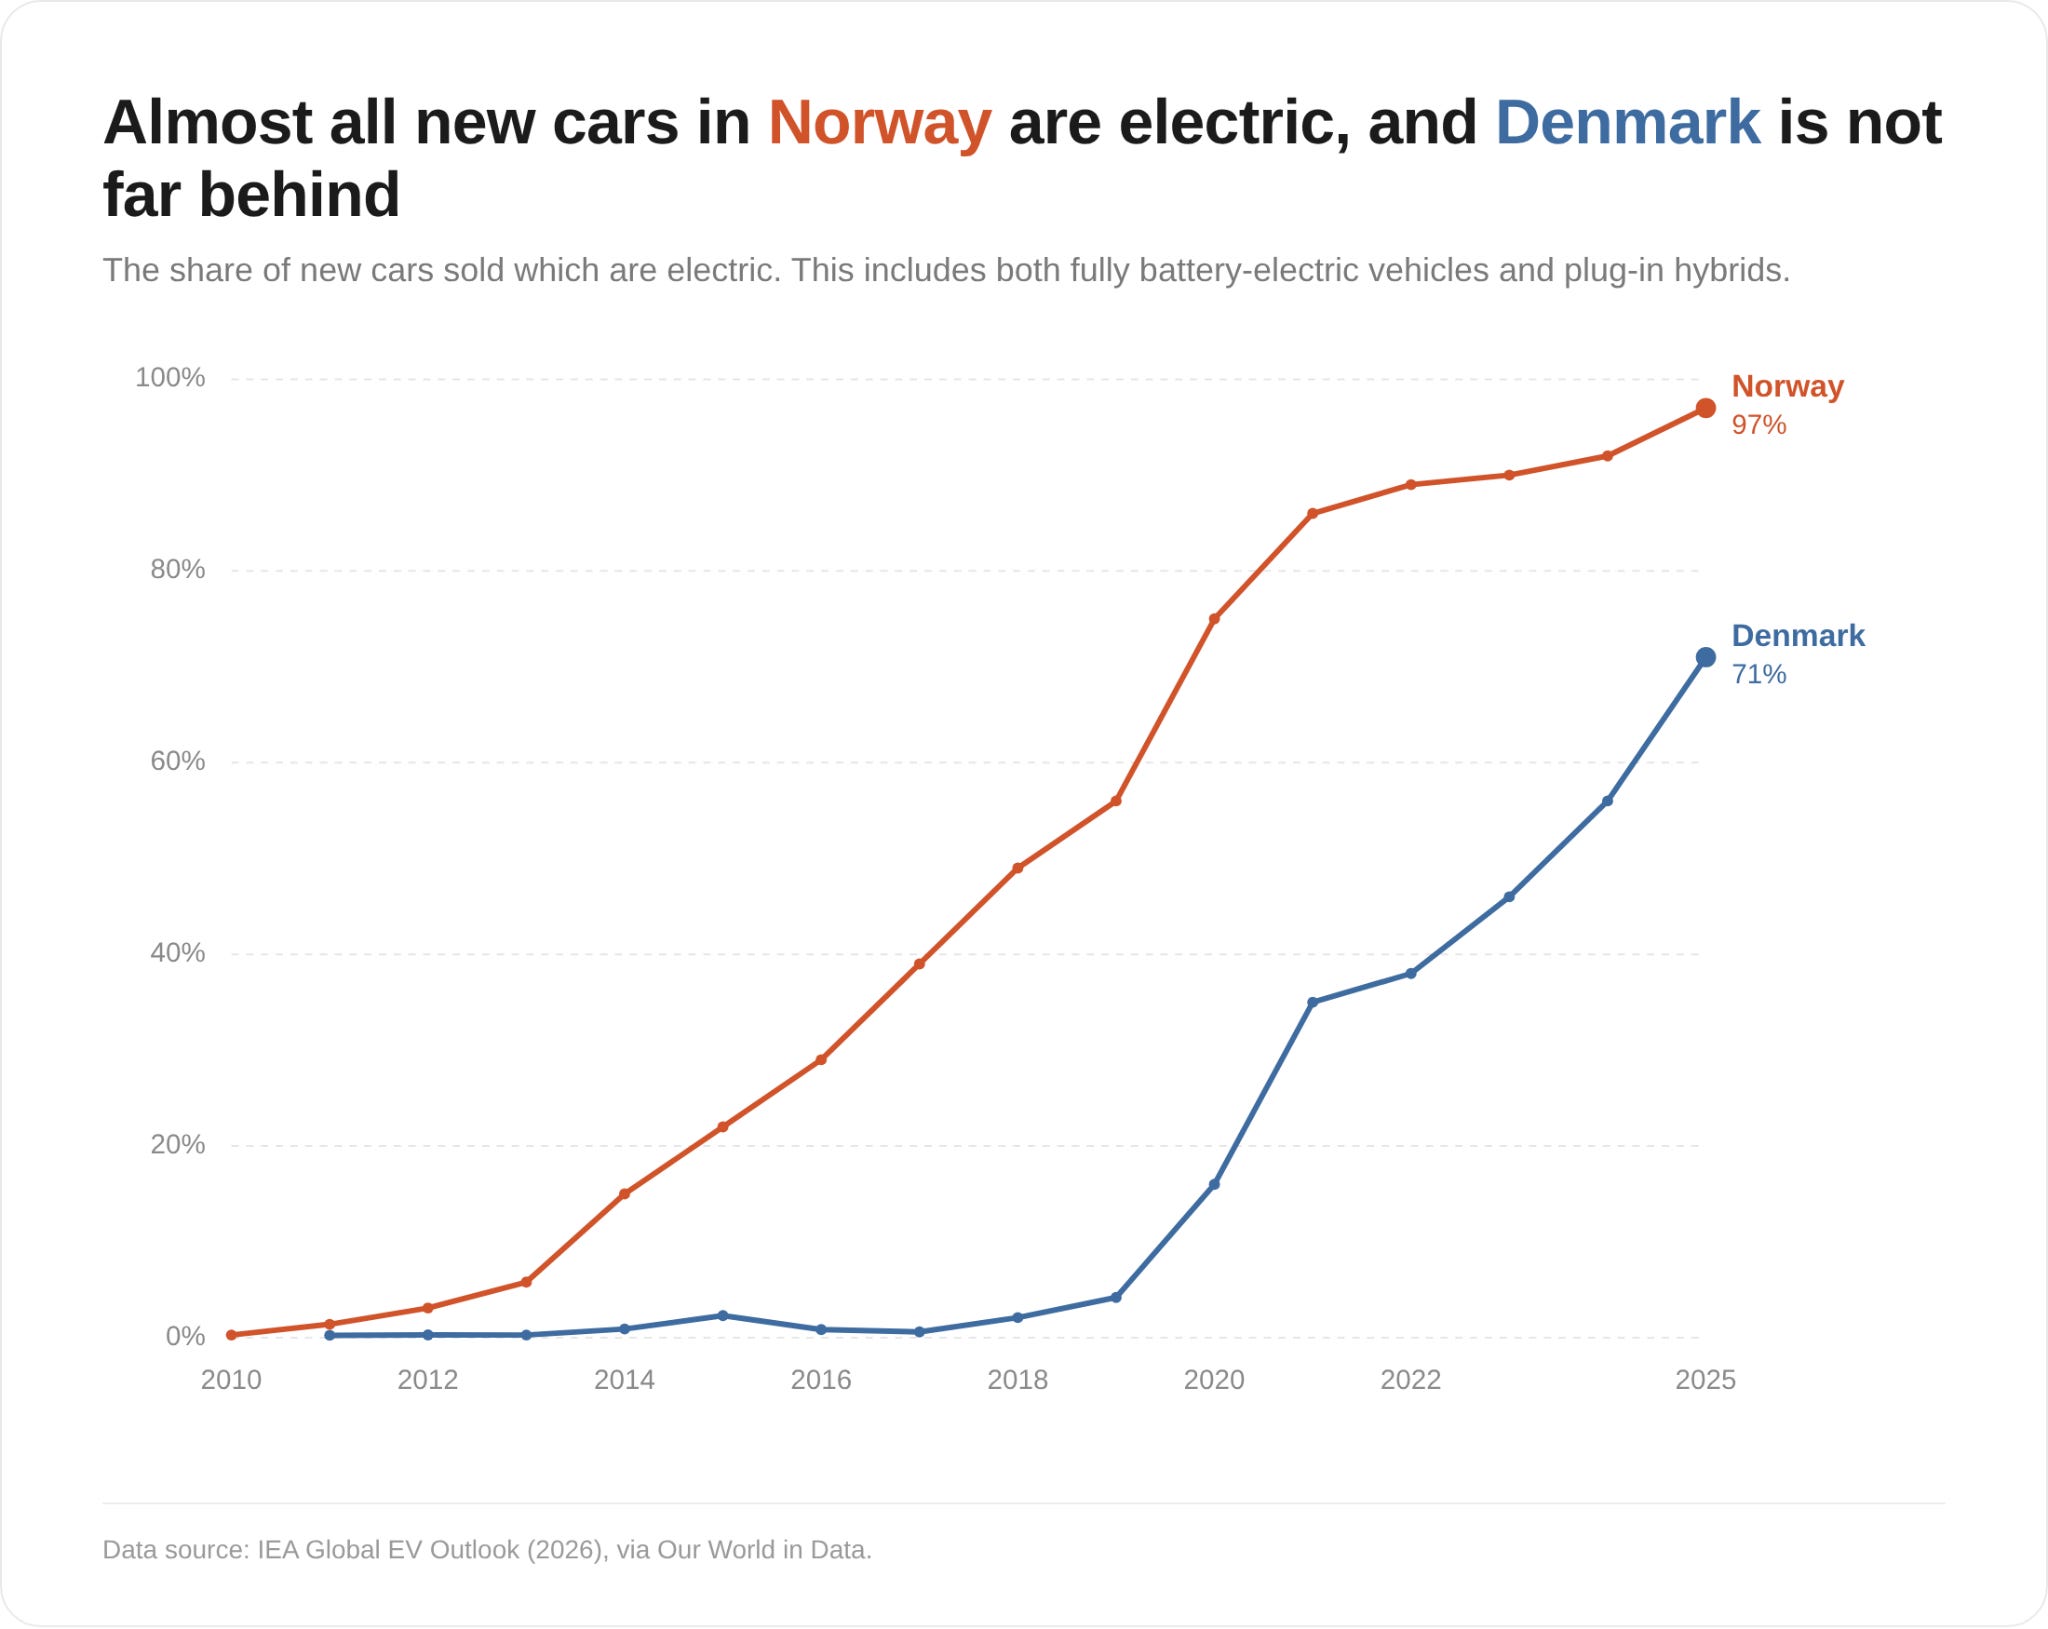
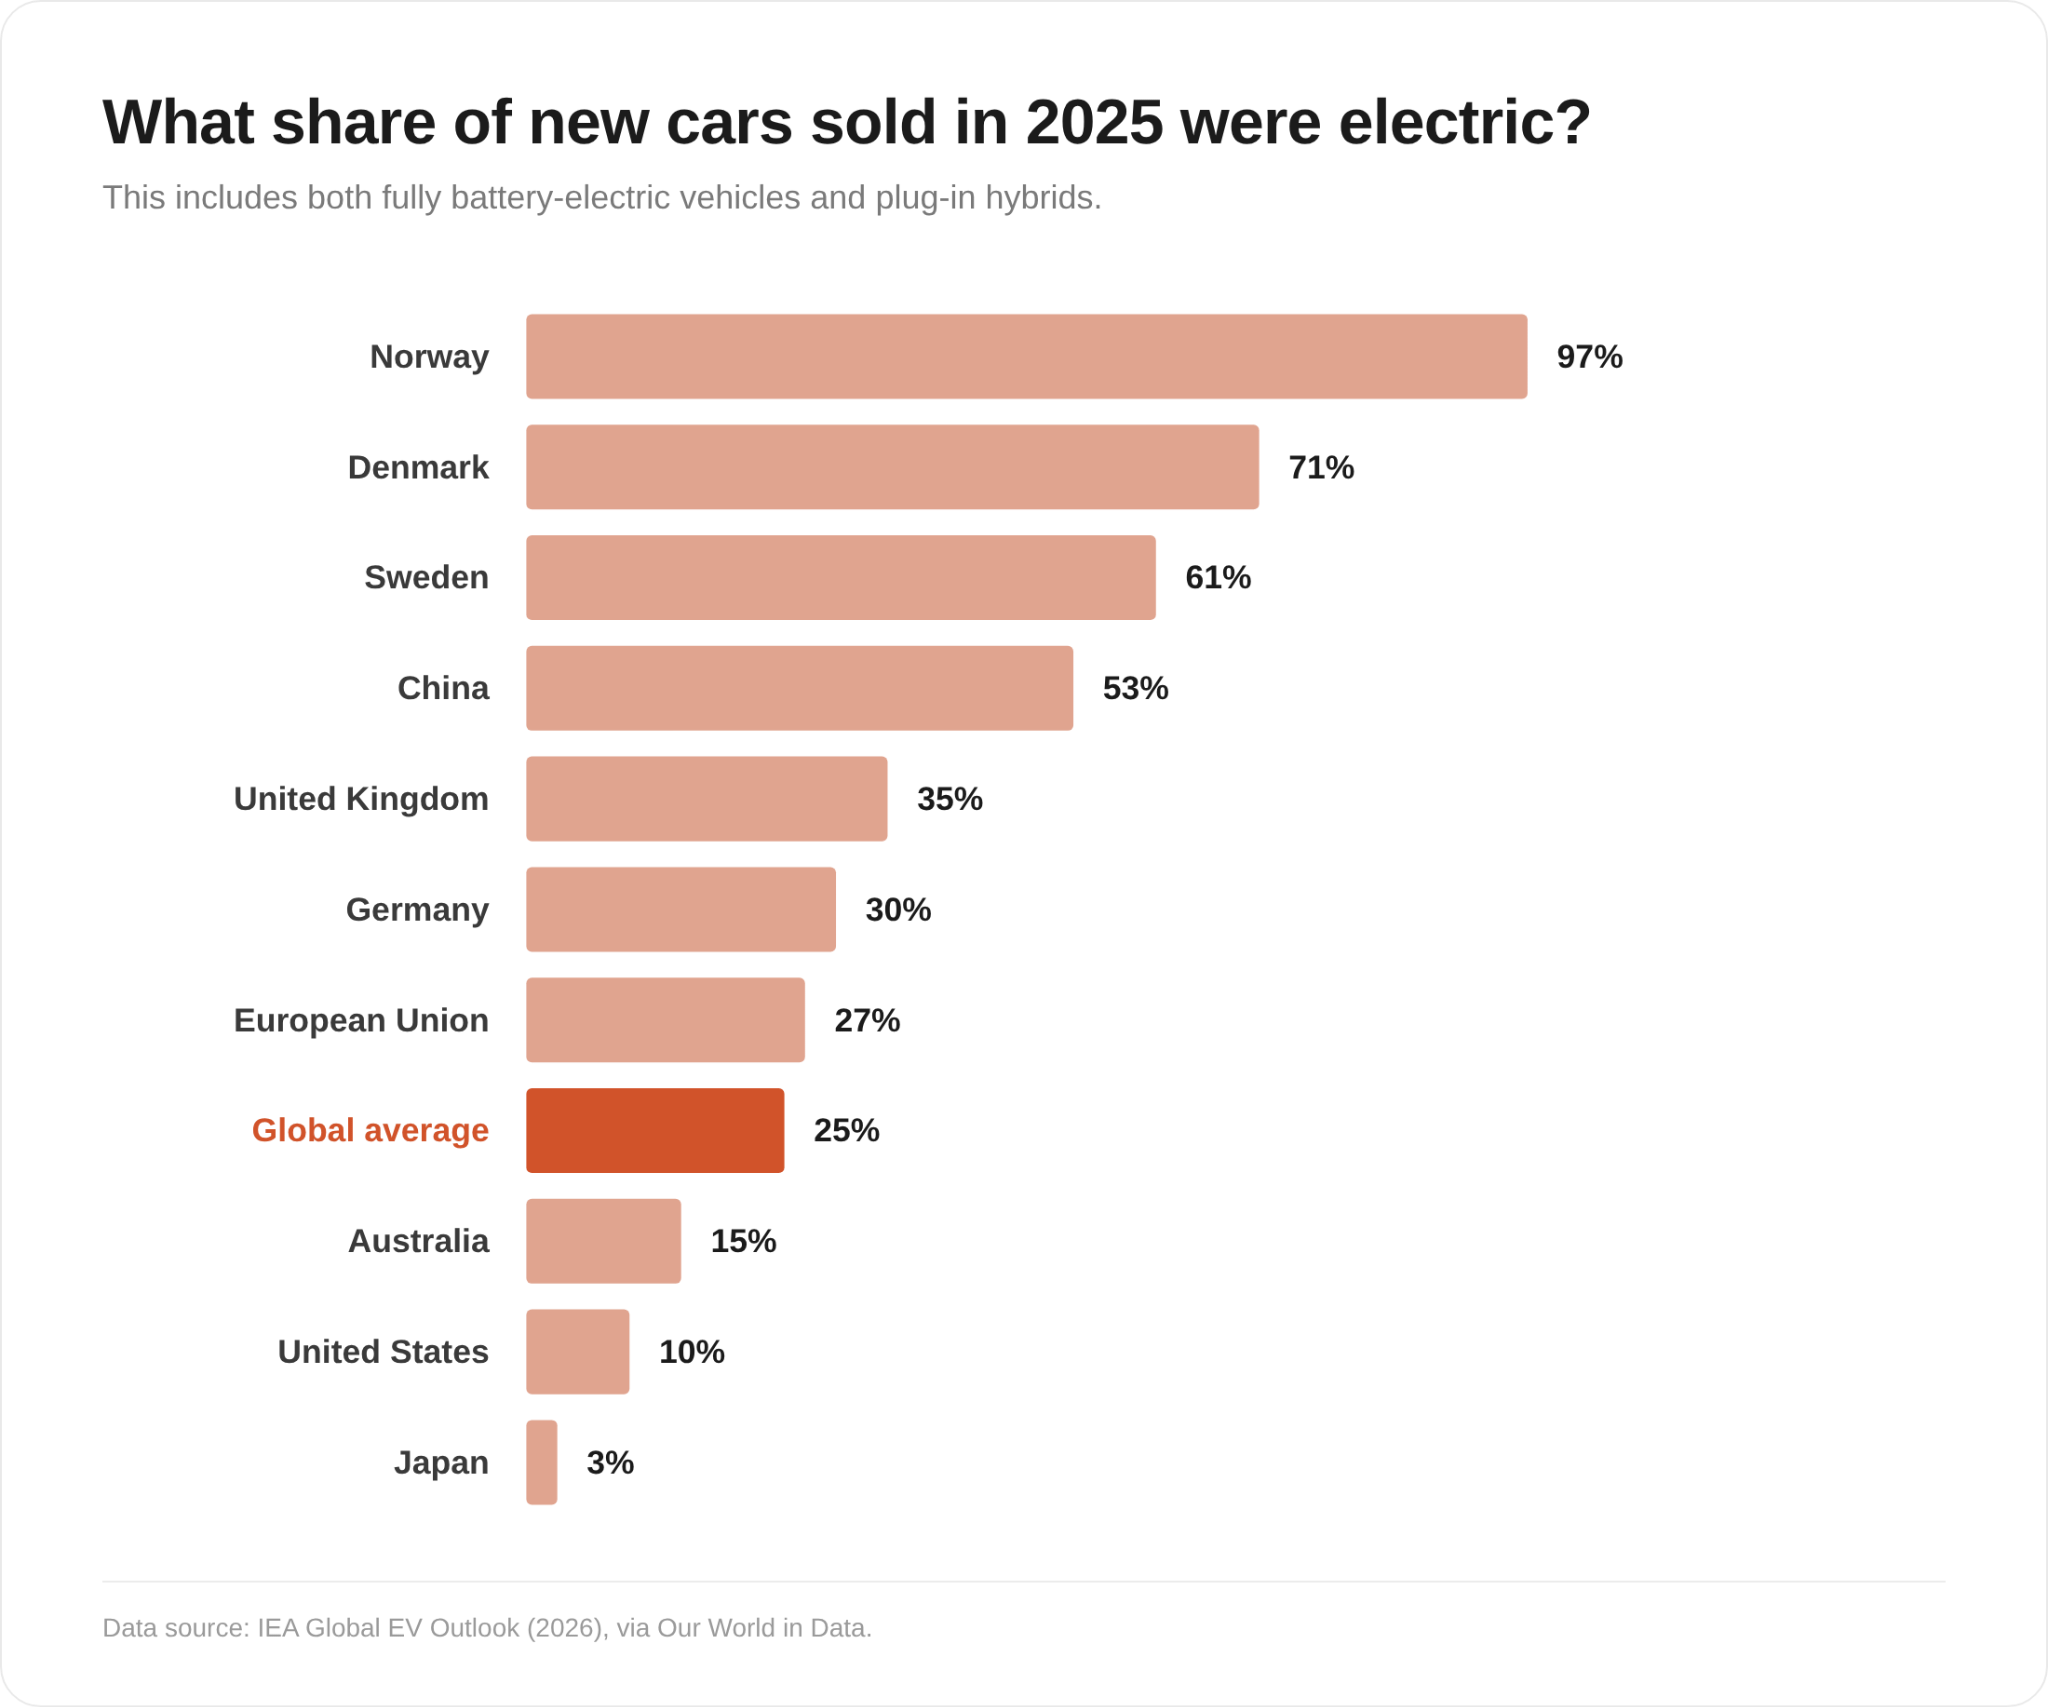
Last month, the International Energy Agency (IEA) published its estimates of electric car sales data for 2025. I updated all of this data in our charts on Our World in Data, if you want to dive into more detail.
Here, I wanted to share just a few headline figures, then go on to tackle the question of how long it takes for electric car sales to translate into cars on the road.
First, the interesting figures from the new data.
Its EV share has been stuck on 10% for several years. This is also true for the total number of electric car sales: in 2025, it was 1.5 million, the same as the year before.
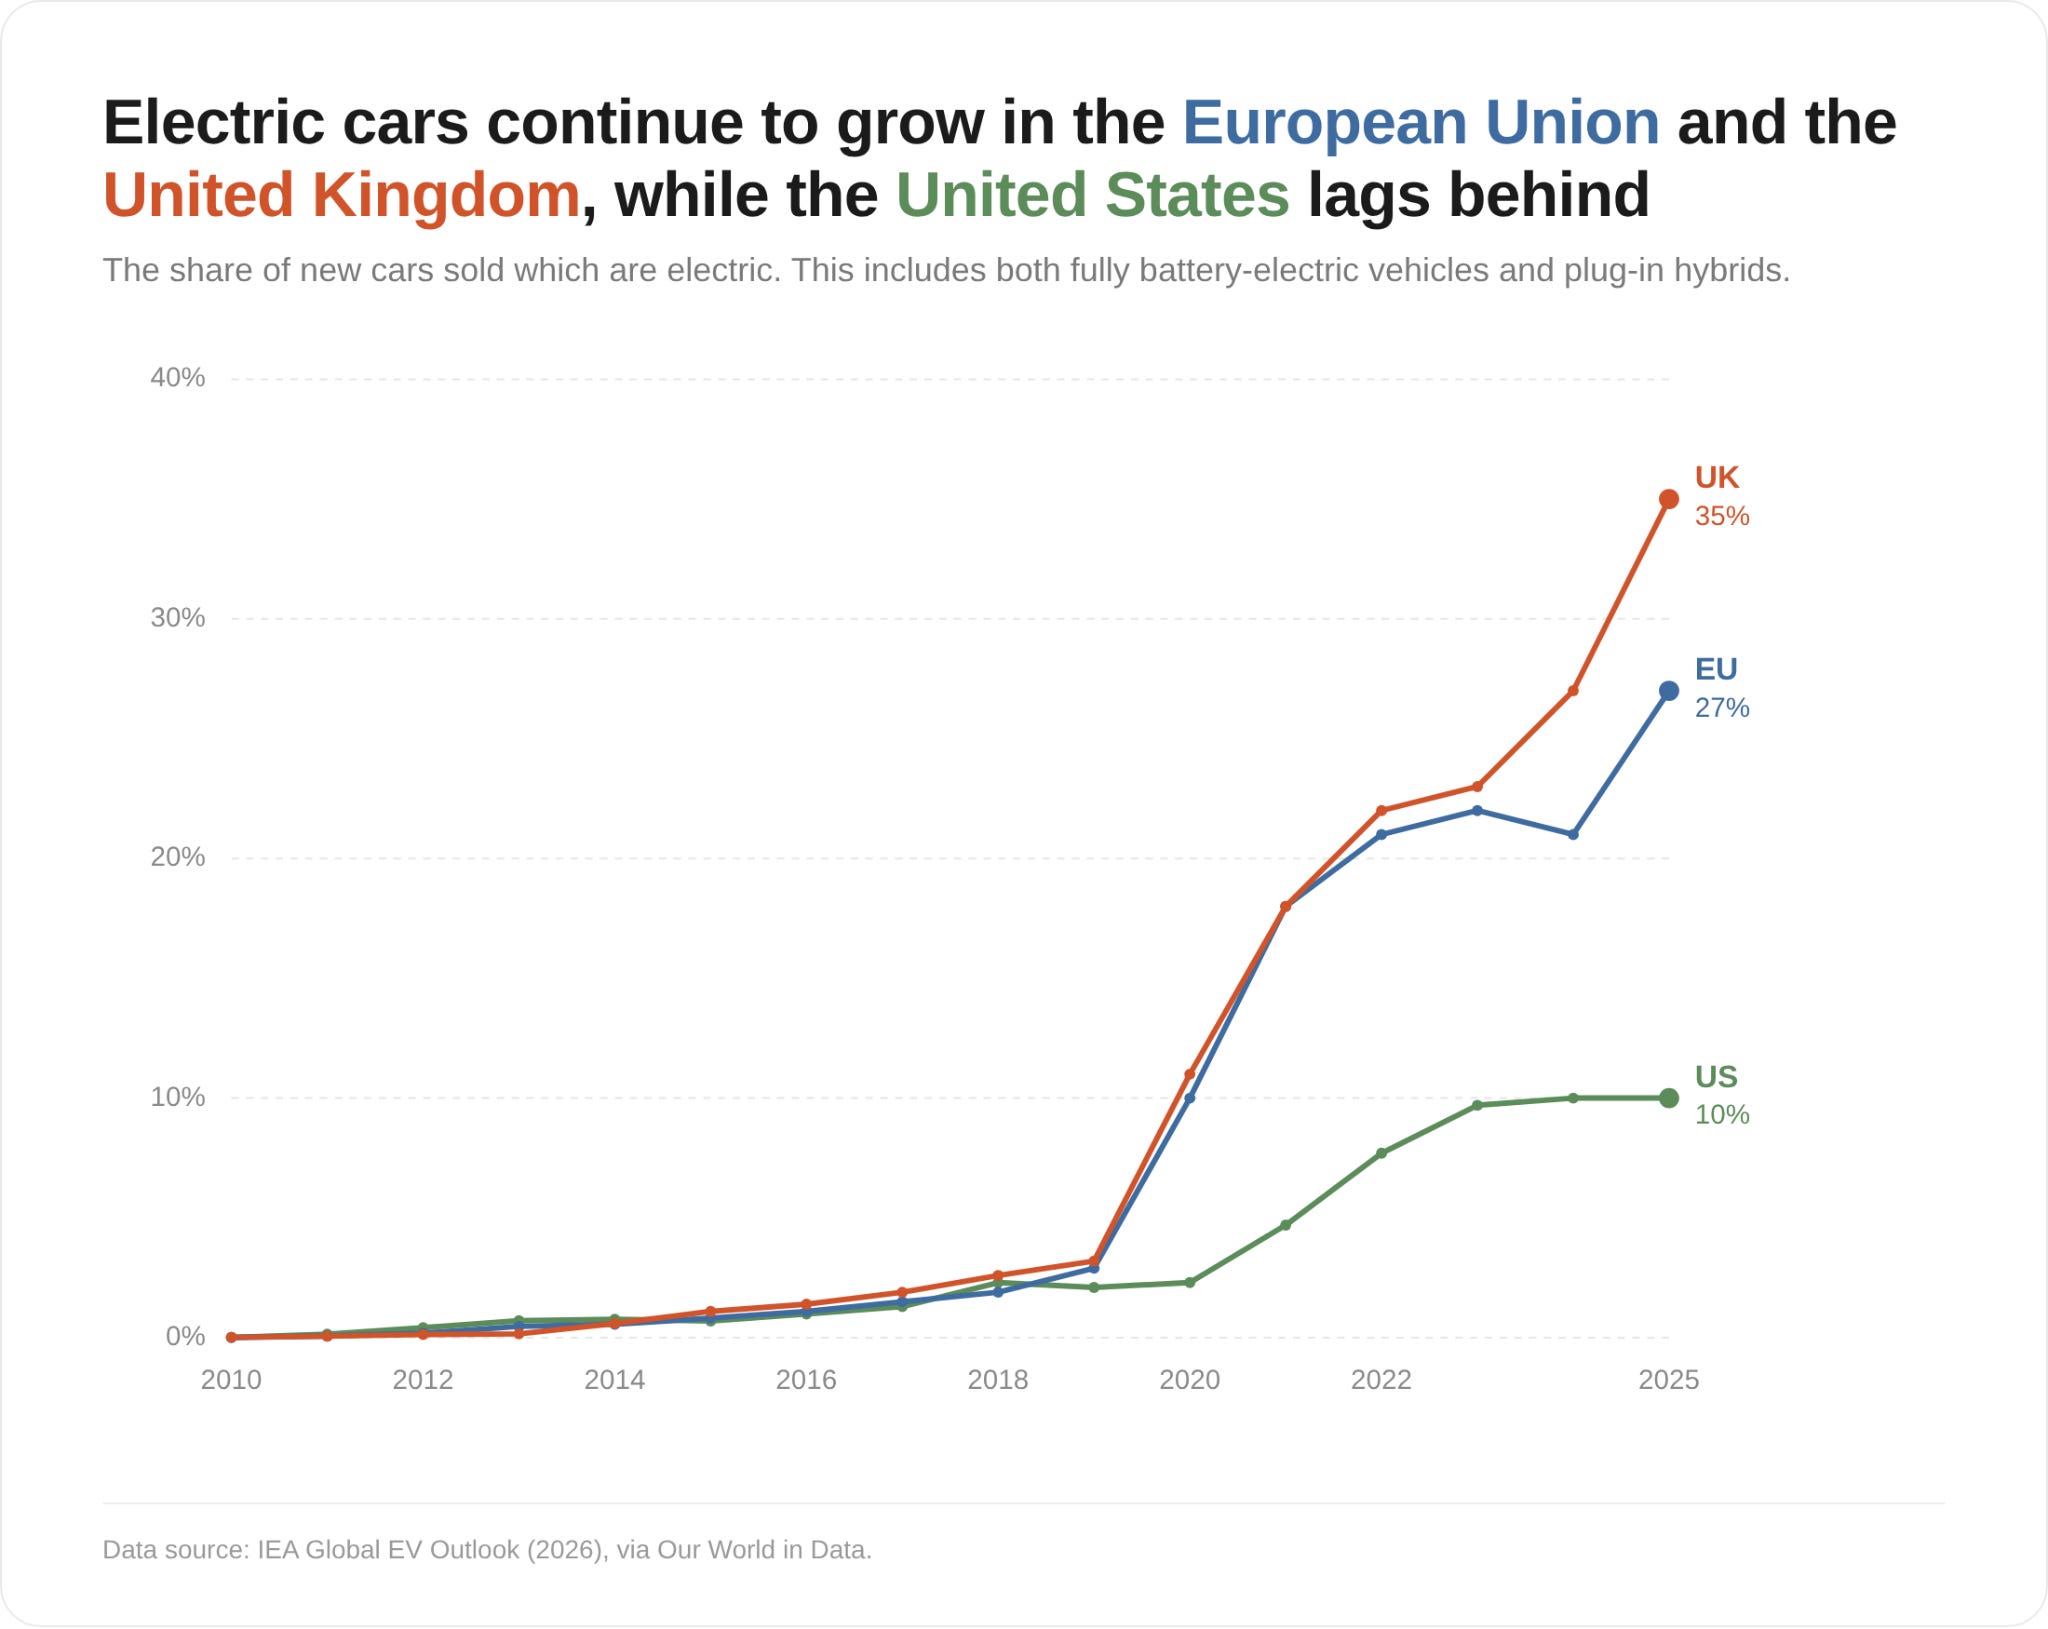
Here is just a selection; you can find data for more here.
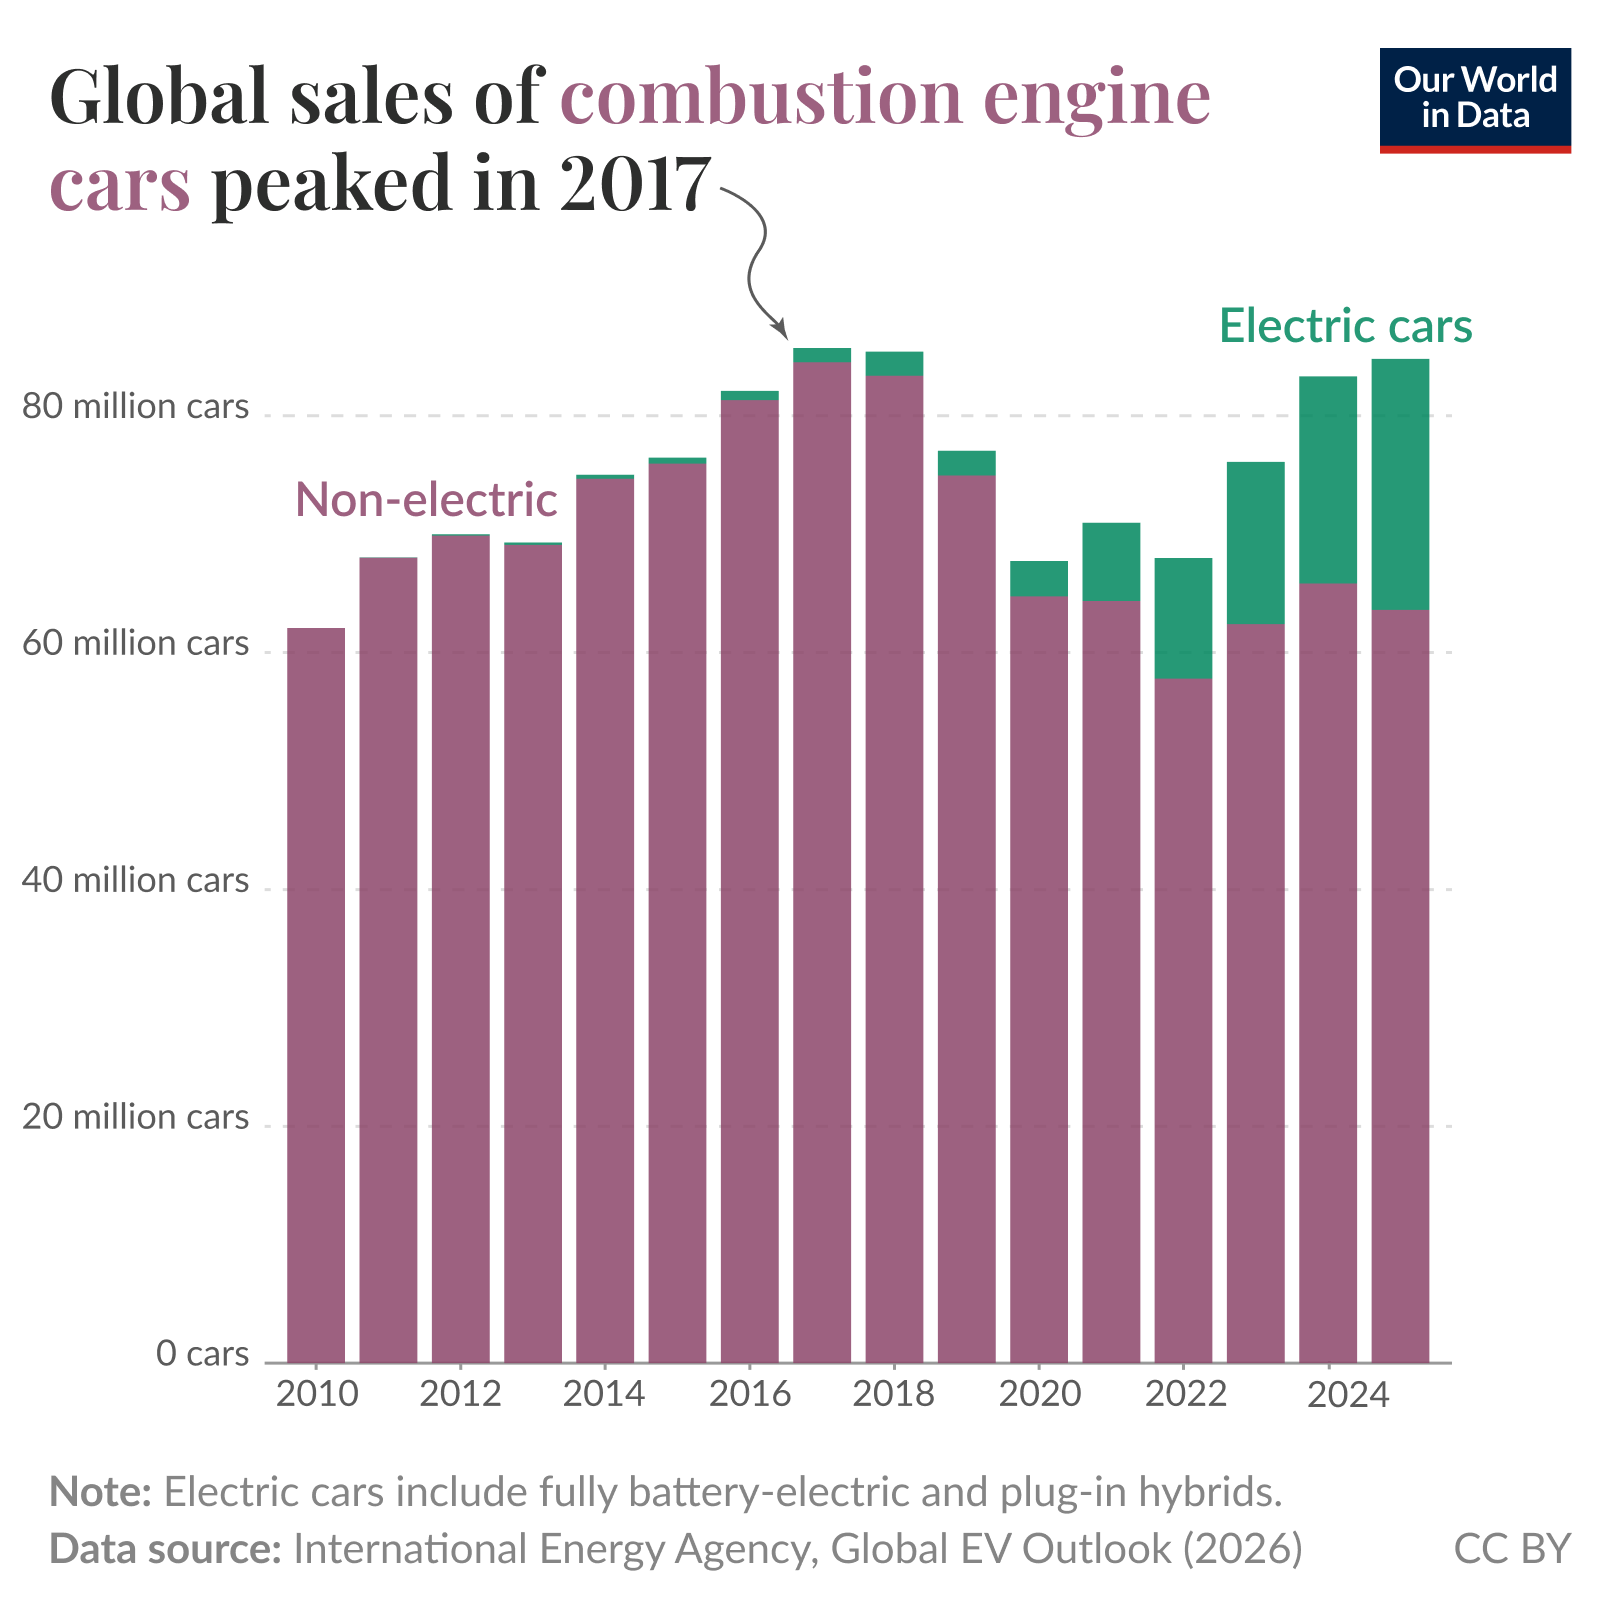
A lot of the data on the rollout of new electric car sales seems very promising for the energy transition. But it’s hard to get a sense of how quickly this filters through to cars on the road.
How long before half of the cars on China’s roads are electric? What about all of them? And how sensitive are these timelines to specific factors around car ownership?
For my own curiosity, I built a quick, simple tool that attempts to model this. I thought I’d share it here in case you want to play with it.
It seems like there’s a lot going on, but the inputs and outputs are quite simple. Pick a given country. The chart on the left show electric car sales. The chart on the right shows how this filters through to cars on the road.
You can adjust three inputs:
How quickly the EV sales share increases. This is a very simple model, so you can’t adjust this for individual years.
The average lifetime of cars: how long people keep their cars for. If people ditch them after 10 years, electric cars will take over faster than it they hold on to them for 15 or 20 years.
How quickly the car fleet is growing. In low- and middle-income countries, total car sales are still increasing a lot. In high-income countries, they’re pretty much stagnant; this means EVs are essentially replacing petrol ones, rather than meeting additional new demand, too.
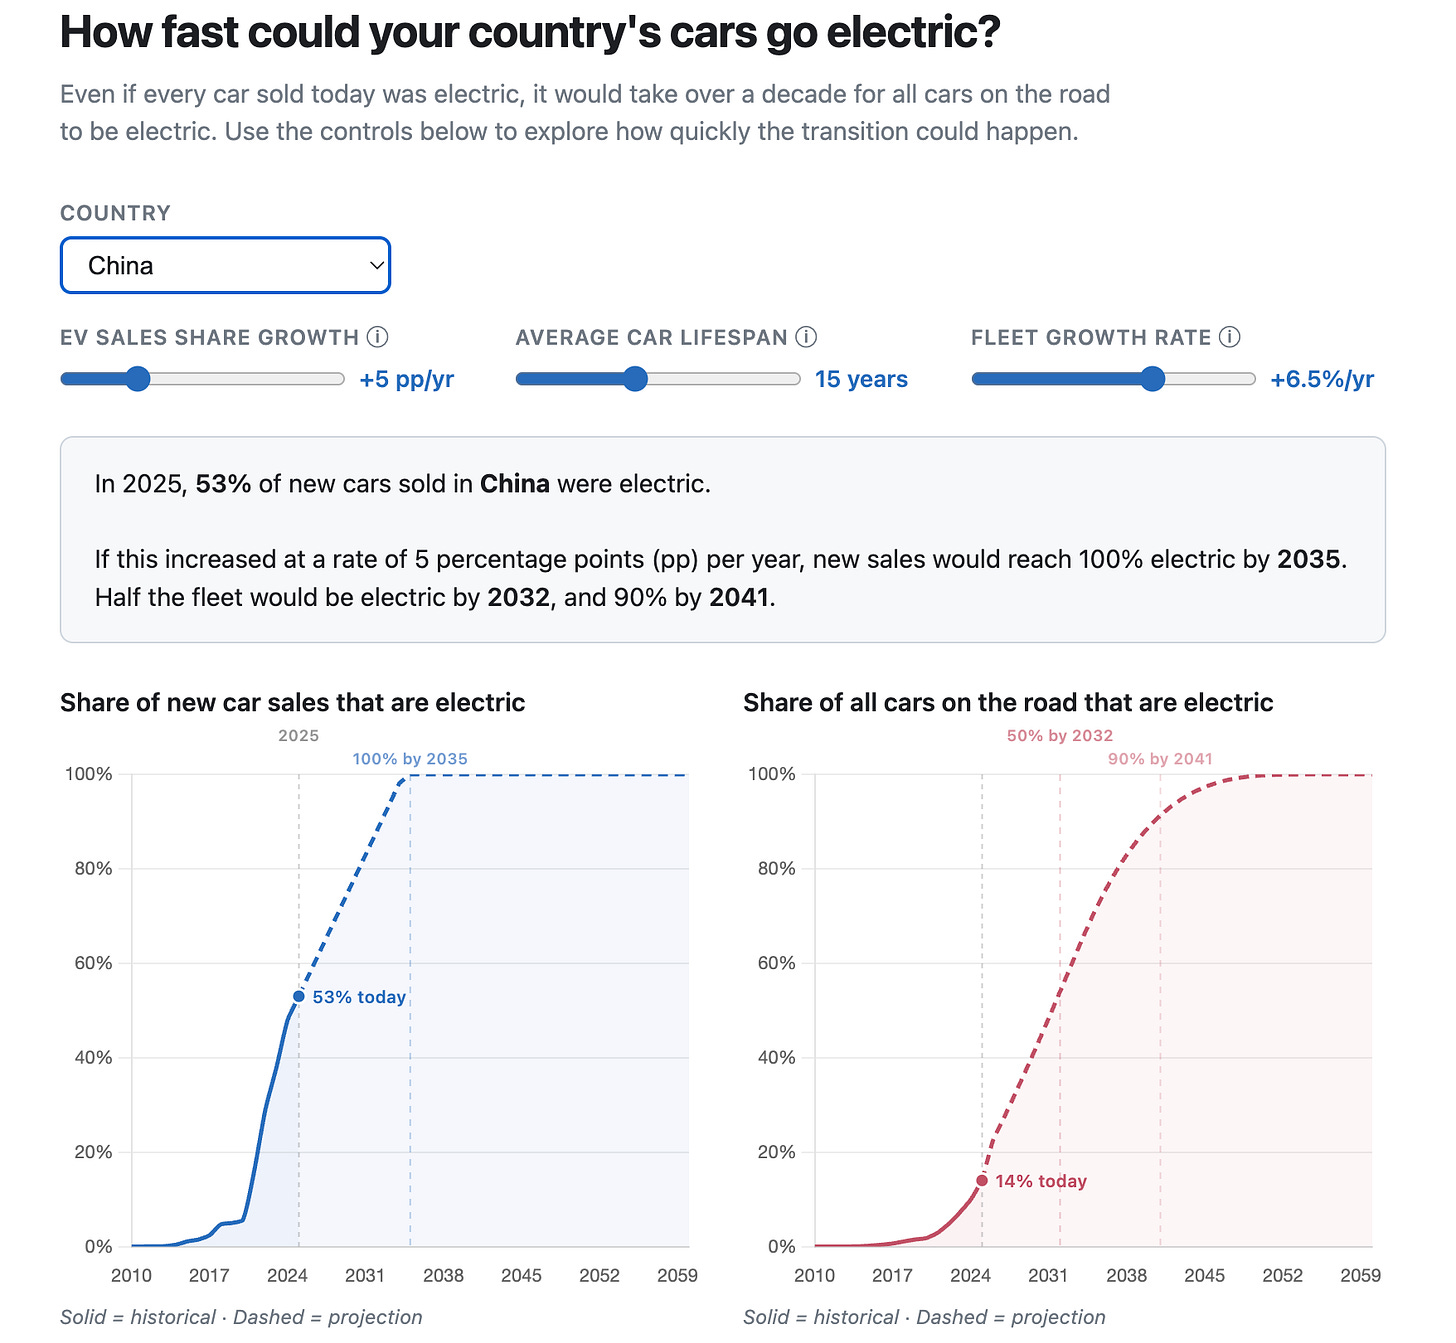
As a quick example: if China’s EV sales share were to grow at 5 percentage points each year, it would reach 100% sales in 2035.
How would this translate into cars on the road?
Today, 14% of cars on the road are electric. If the average lifespan of a car is 15 years, and the fleet is still growing strongly at around 6% per year, this would pass 50% by 2032, and 90% in the early 2040s.
If the car lifespan were 10 years, it would reach 90% in the late 2030s. You can play with these options for a range of different countries to see how sensitive the outcomes are.
Comments
Nothing yet. Say the first thing.
Sign in to join the conversation.