
Deforestation is nearly always reported and measured based on the country where it happens.
In high-income countries, deforestation rates are now very low (we did most of our forest clearing a century or more ago to make space for agriculture). On net, many are gaining forest through planting and natural regeneration.
But consumers also contribute to deforestation through imports. If the UK buys and sells products containing palm oil grown on deforested land in Indonesia, it is in some way responsible for that deforestation.
How much of global deforestation is driven by products that are traded internationally, and how does this look by country?
Researchers Chandrakant Singh, Martin Persson and colleagues have built a very useful dataset that helps us understand deforestation embedded in trade.1 There is also a nice (although quite dense) platform here if you want to go down a rabbit hole. This data is specifically for agricultural products, which makes sense, since they drive most global deforestation.
I used this data to build a Sankey diagram that visualises the deforestation flows for every country. The interactive version is here for you to explore and try out.
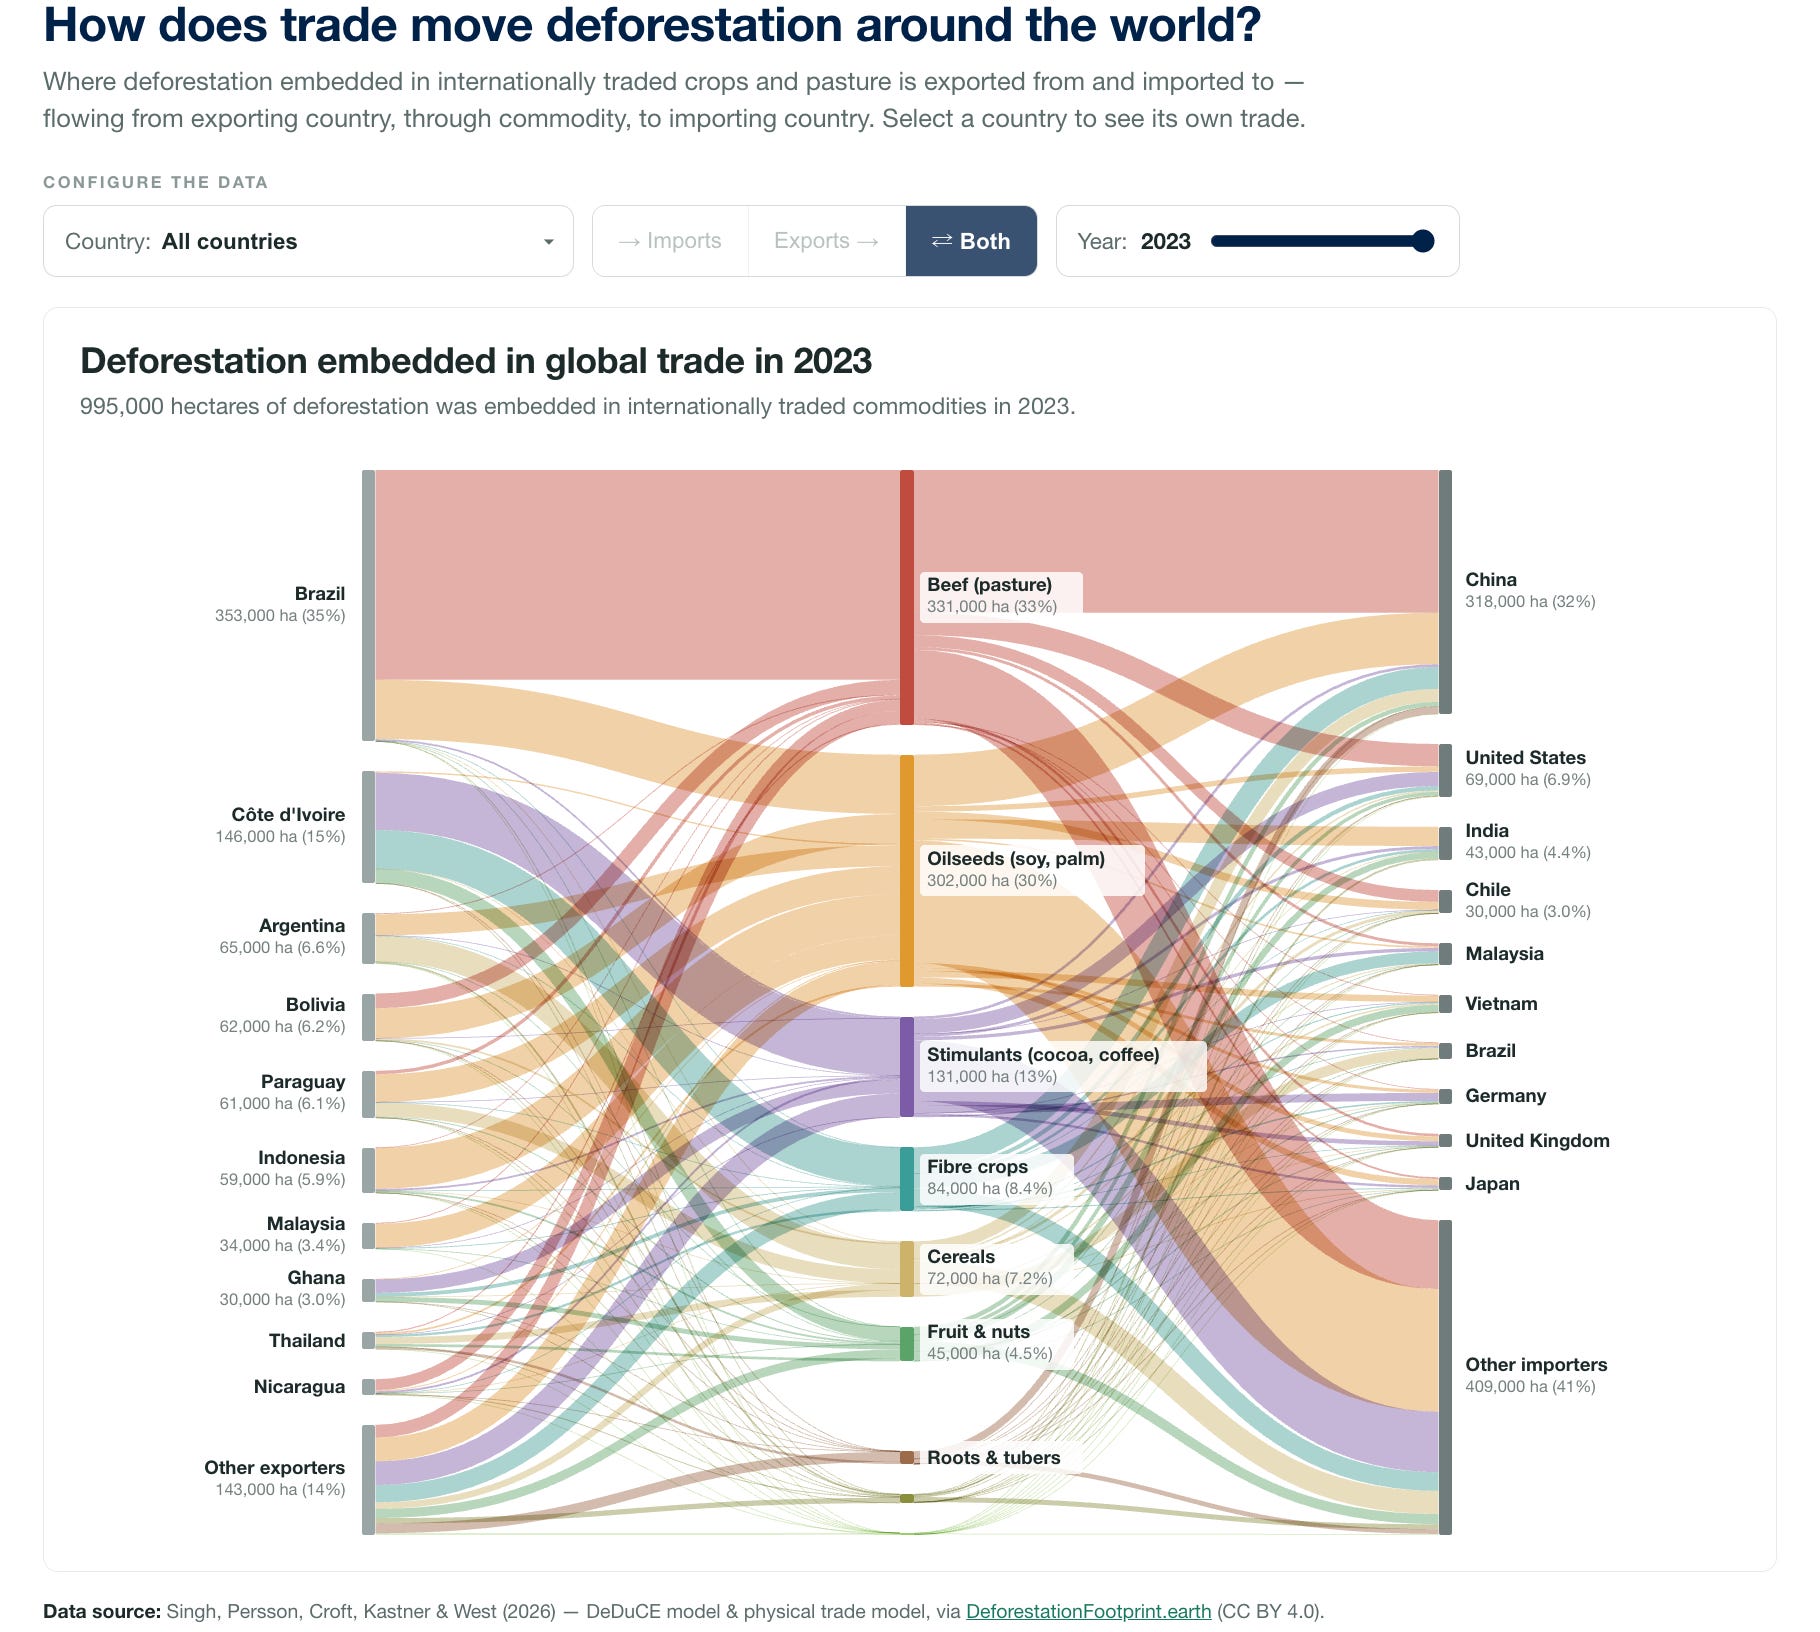
Unfortunately, this data can’t tell us when individual items imported or consumed in a given country were produced on deforested land. The transparent supply chain data is not there to do that. Instead, what they capture is “deforestation risk”, essentially telling us how many hectares of deforestation are embodied in a country’s trade, based on national averages — not whether a specific item you’d pick up in the supermarket came from cleared land.
Here are a few insights from the data. I’m sure you can find more when you explore for yourself.
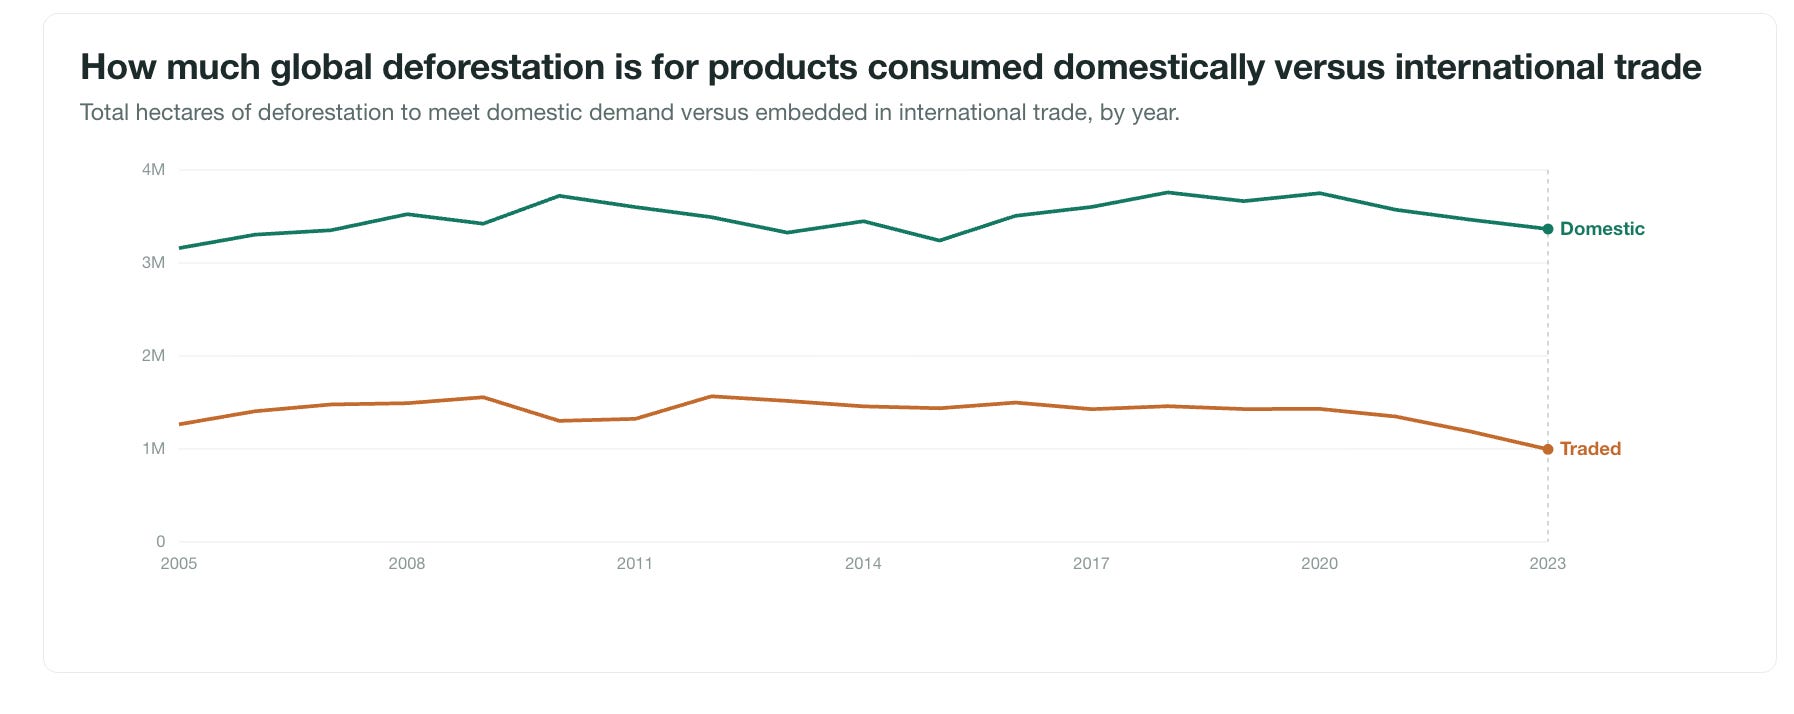
I think some have the impression that most deforestation is driven by demand in international trade. This is not true. Around three-quarters of deforestation is happening for products that are consumed in domestic markets.
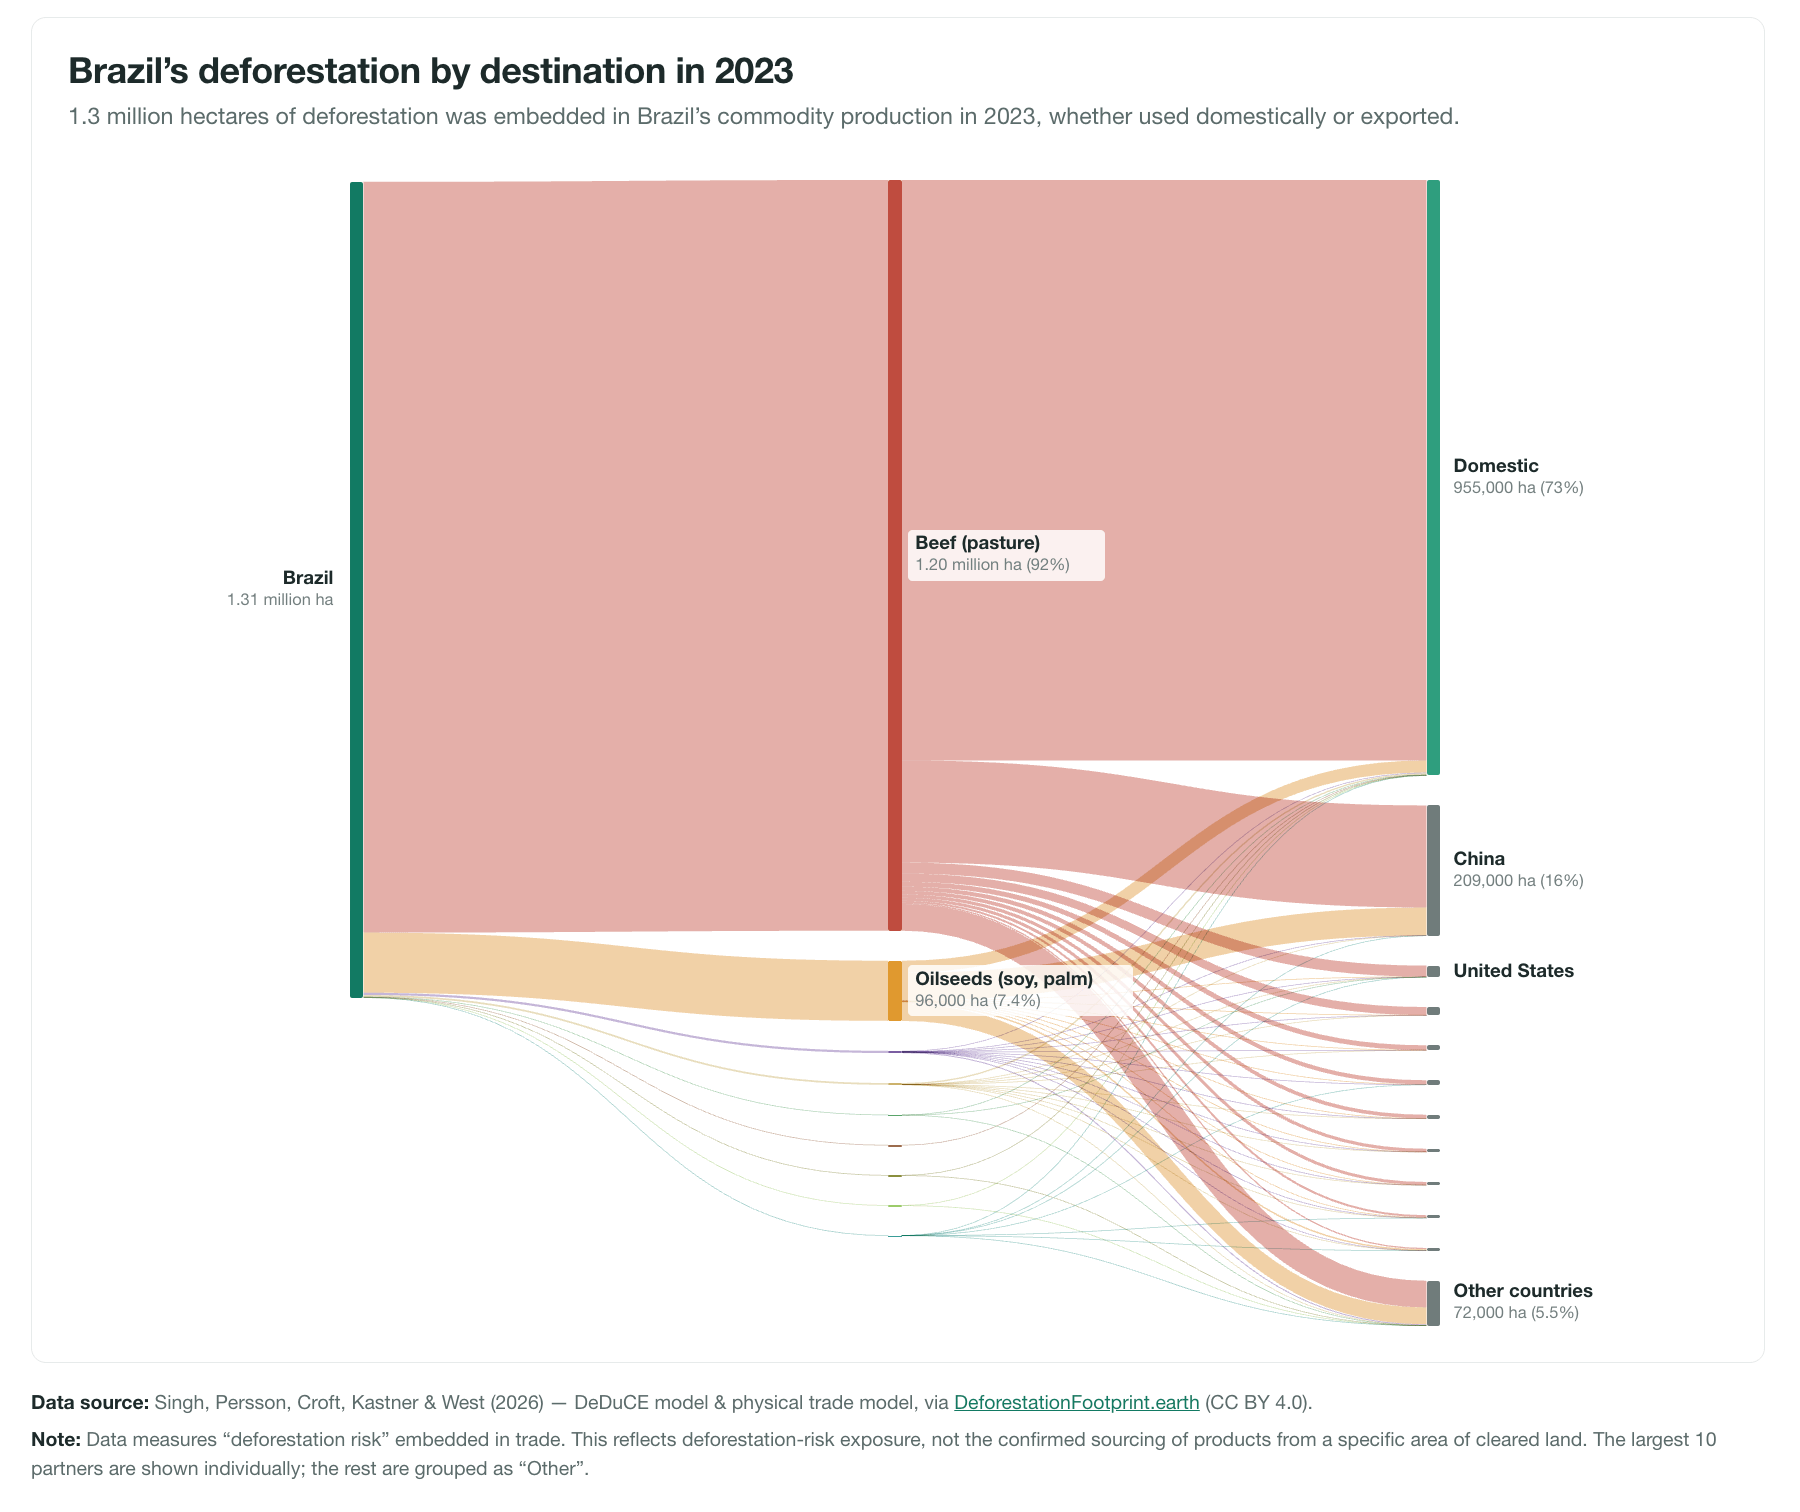
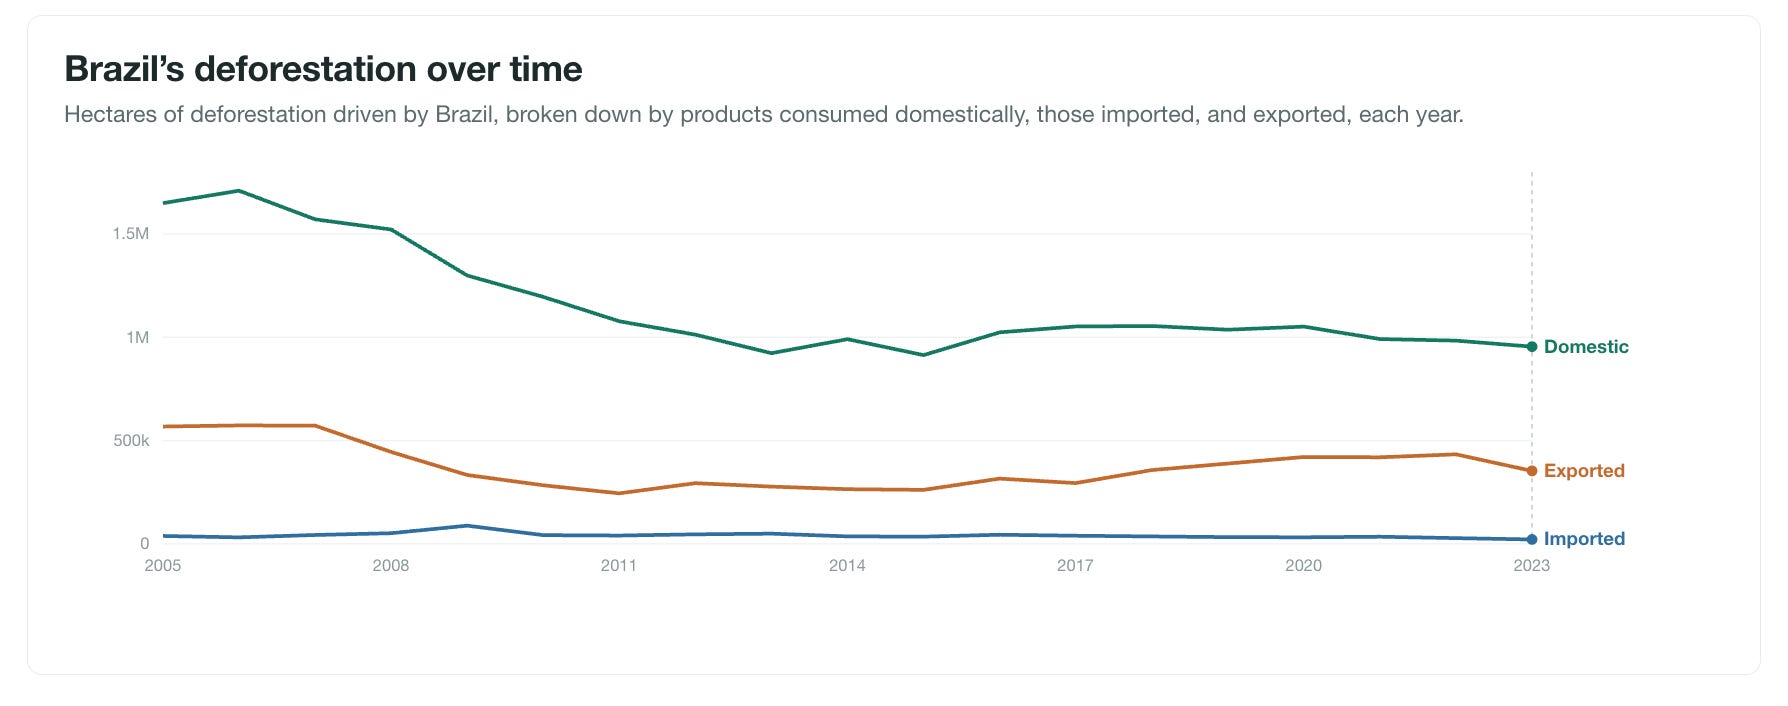
Beef is the largest driver of deforestation globally, and Brazil has been the prime location for this forest clearing for decades. If we look at the data on where this demand is coming from, most of it is domestic.
Here’s the data for the UK. The biggest categories are now oilseeds (which is mostly soy and palm oil), cocoa and coffee. Beef imports were a large contributor in the past, but appear to have fallen quite a bit over the last few decades.
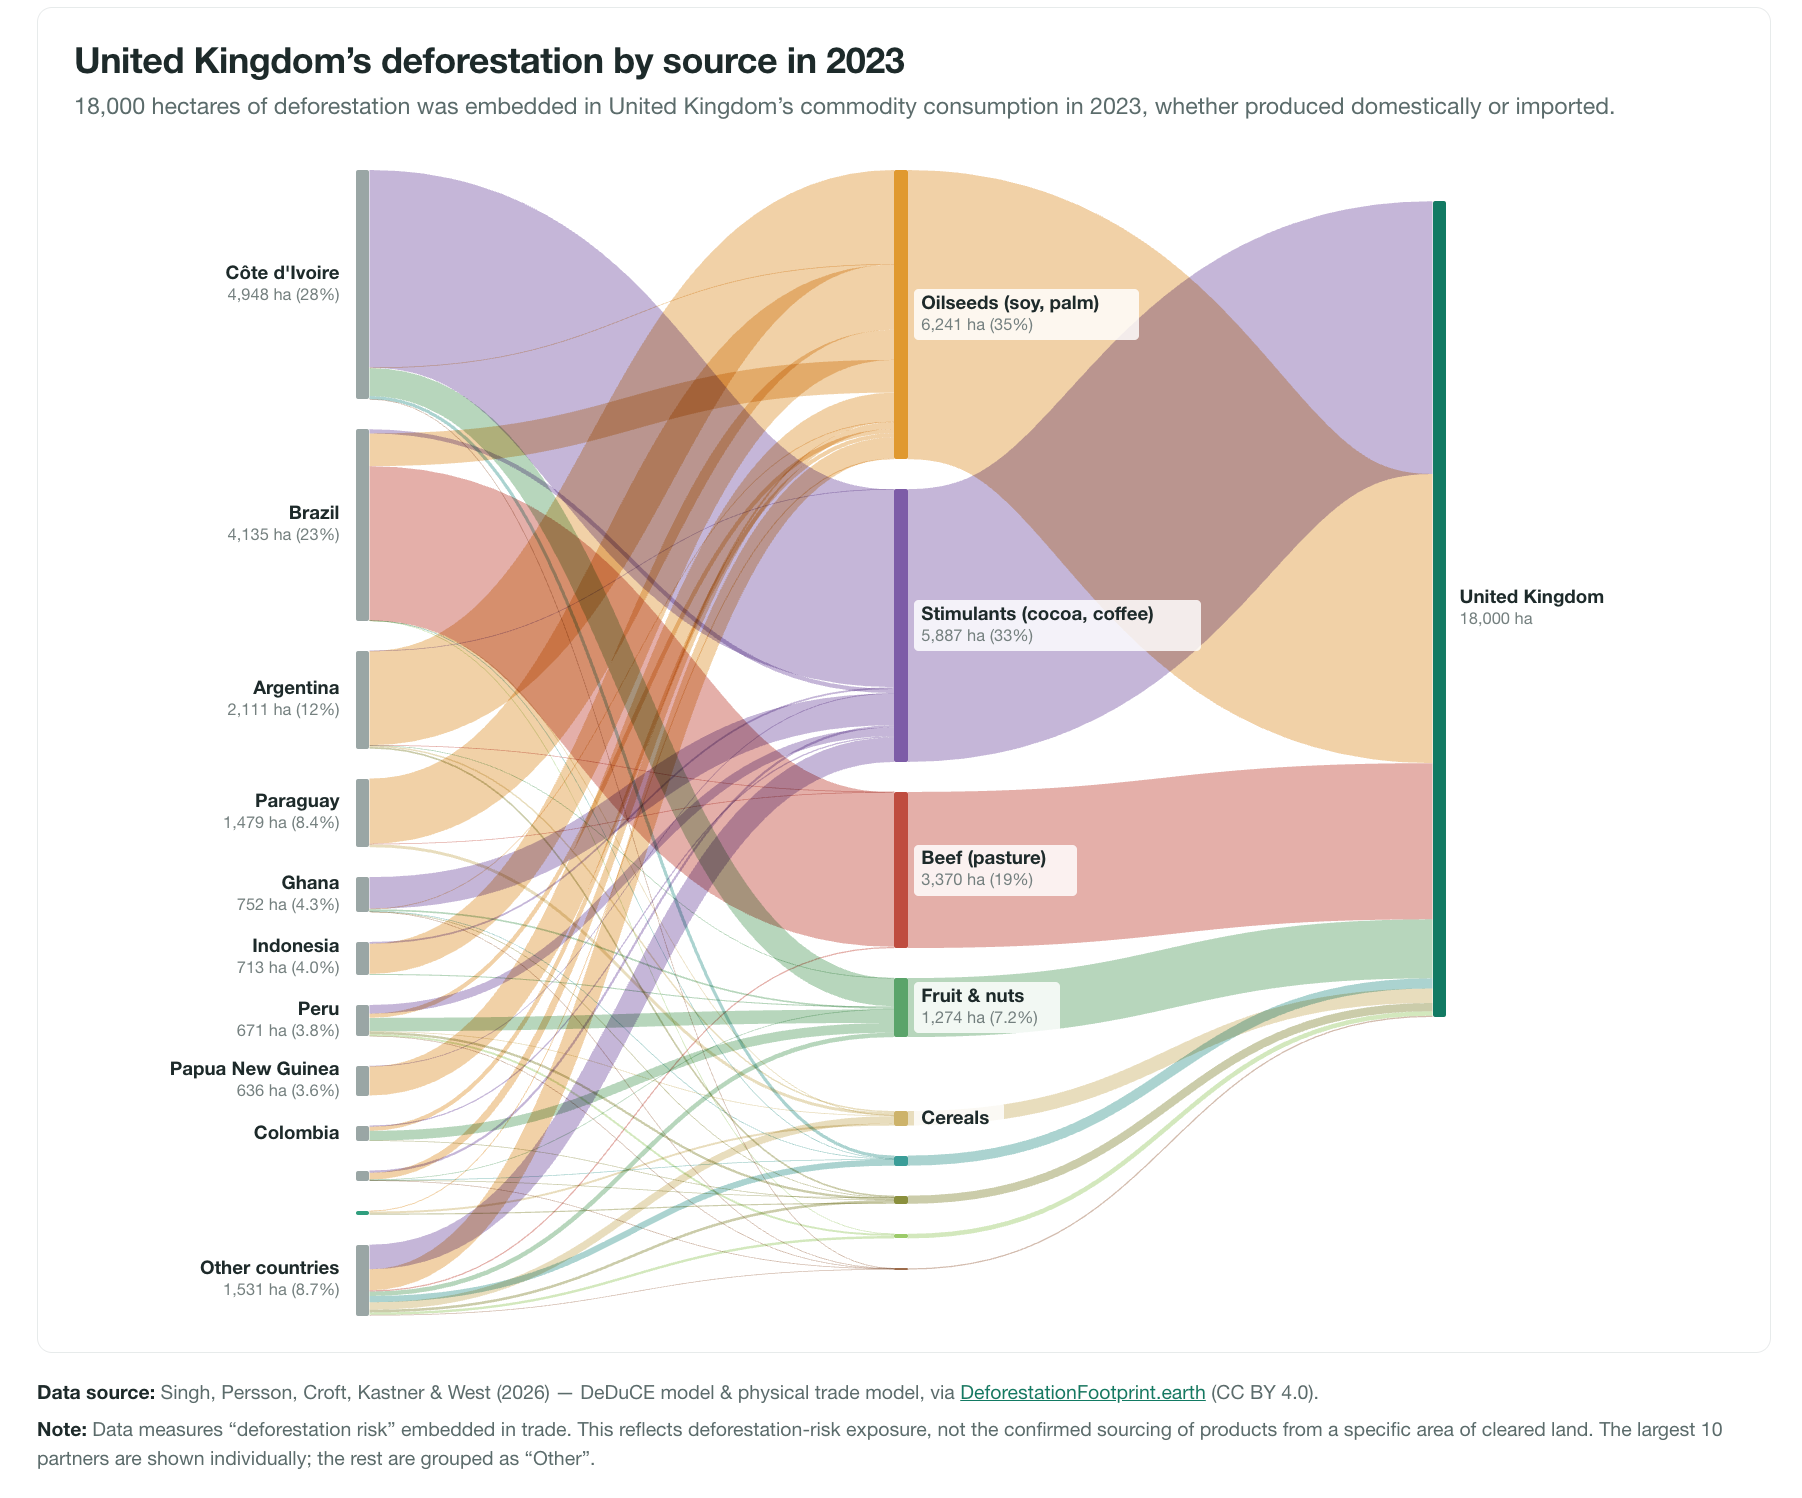
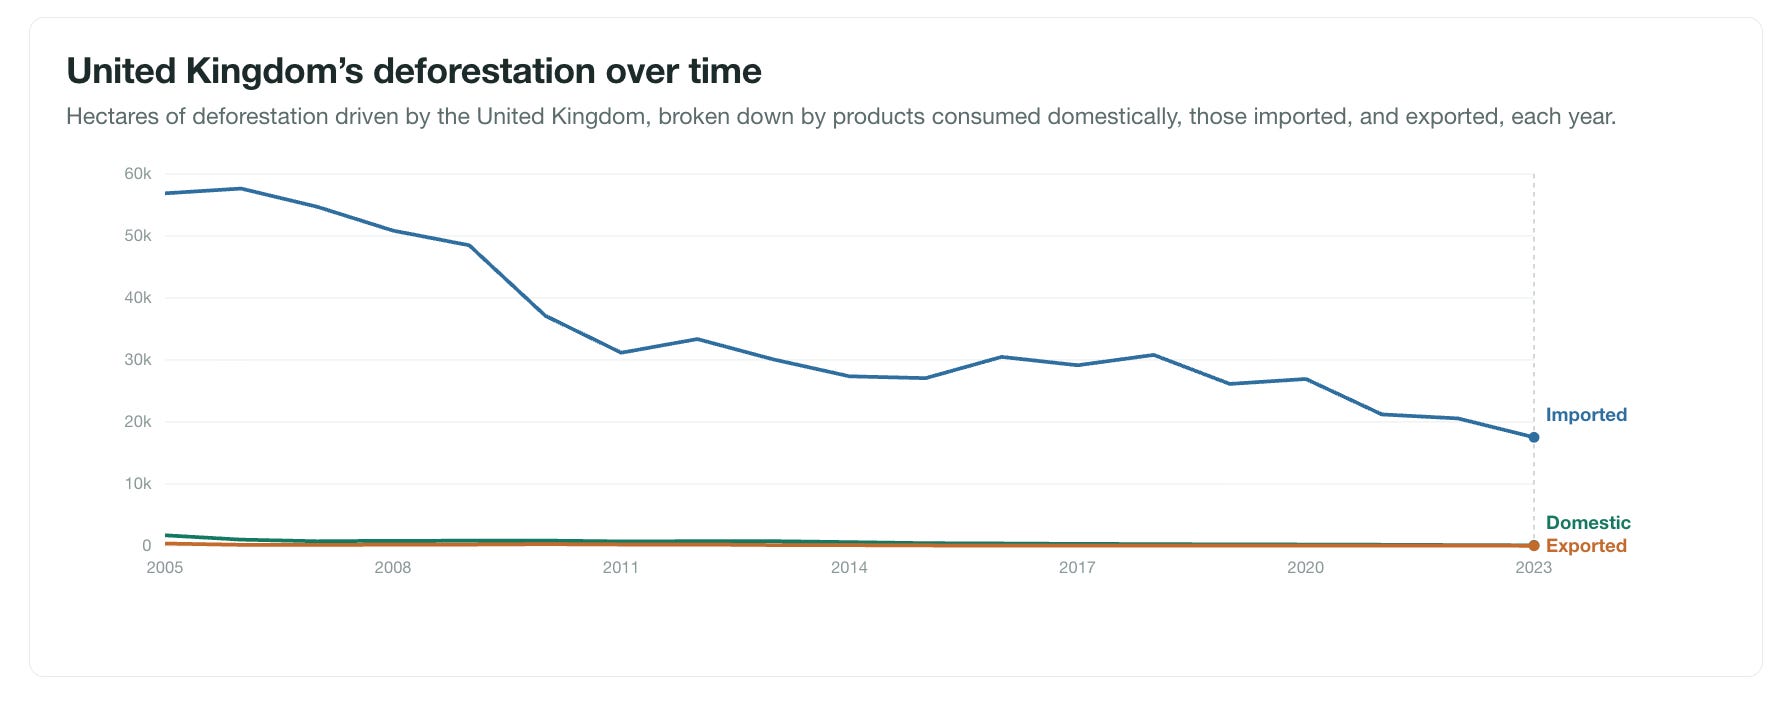
The UK has very little deforestation domestically, and exports next to nothing. All of its contributions come from imported goods.
This imported deforestation, though, appears to have fallen quite a bit in recent decades. Since the early 2000s, it has dropped by roughly two-thirds.
This is true for many countries in Europe (see France and Germany as other examples), but not for the United States.
These are just a few highlights I picked up from exploring the data. I built this interactive tool so that you can dig in deeper and find more. Enjoy!
The dataset is here: https://zenodo.org/records/10633818
The academic paper behind it is here: https://www.nature.com/articles/s43016-026-01305-4
Singh, C., Persson, U.M. (2026) Global patterns of commodity-driven deforestation and associated carbon emissions. Nature Food.
Comments
Nothing yet. Say the first thing.
Sign in to join the conversation.