
On 22 July, Alphabet reported one of the strongest operating quarters in its history and the shares fell. Revenue rose 24% to $119.8 billion. Google Cloud grew 82% to $24.8 billion, against a contracted backlog of $514 billion. Income from operations was up 30%. Then the cash flow statement: capital expenditure of $44.9 billion, roughly double a year earlier, against $39.1 billion of operating cash flow, for free cash flow of negative $5.9 billion, the first negative quarter since the 2004 listing. Management raised full-year capex guidance to $195 to $205 billion from $180 to $190 billion, and said 2027 would be significantly higher again.
The reaction was to treat this as a spending problem. We think that reads the wrong statement. What Alphabet published was not a warning about discipline; it was a timing disclosure, and the timing is the part of this cycle that is actually knowable. Demand for AI is contested and will stay contested. Depreciation on assets already in service is far more mechanical: it arrives according to disclosed useful lives, subject to revisions and early retirements, whether or not the revenue shows up.
The thesis in one line: this spending is immediate revenue for the suppliers and deferred cost for the buyers, so the same cash flow is being priced as a growth story at one end and not yet charged as an expense at the other. This issue follows a single dollar of hyperscaler capital expenditure through the accounts: where it leaves, where it sits, who lent it, where it comes back as cost, and who collects it on the way. Three companies in that cohort report this week. The argument below is about what to read in their filings rather than what to expect from their headlines.
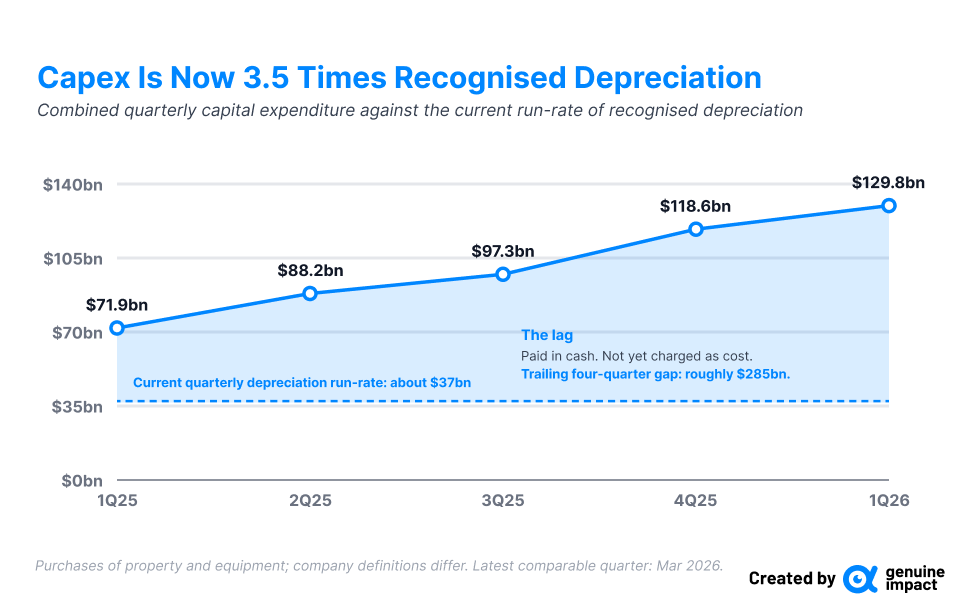
Combined figures run to the last quarter all four companies have reported. Alphabet’s June quarter is discussed above.
Start with the size of the thing. In the four quarters through March 2026, Microsoft, Alphabet, Amazon and Meta bought $433.9 billion of property and equipment between them: Amazon $151.0 billion, Alphabet $109.9 billion, Microsoft $97.2 billion, Meta $75.7 billion. Those are four numbers each company printed in its own cash flow statement, added together. The combined first-quarter figure of $129.8 billion was up 80% on a year earlier, and each of the preceding five quarters set a new combined record. For scale, the same four companies spent $151.1 billion in the whole of 2022.
Guidance for calendar 2026 sums to roughly $700 billion at midpoints, and that aggregate is now stale on the low side, because Alphabet raised its own component by around $15 billion last week. Amazon has indicated roughly $200 billion of capital investment, Microsoft roughly $190 billion including an estimated $25 billion of pure component-price inflation, Meta $125 to $145 billion after an April increase.
Two caveats, stated once and carried throughout. First, these are not identical measures: Meta’s company-defined figure includes finance-lease principal, Amazon’s “capital investments” is broader than cash purchases of property and equipment, and Microsoft’s June fiscal year has to be mapped onto calendar quarters. Second, this is total property and equipment, not an AI-specific line. Nobody discloses one. Amazon’s figure in particular carries fulfilment and logistics assets alongside data centres, so the aggregate materially overstates the amount attributable specifically to AI infrastructure. The methodology table at the foot of this issue sets out each definition. Nothing in the argument below depends on the third significant figure.
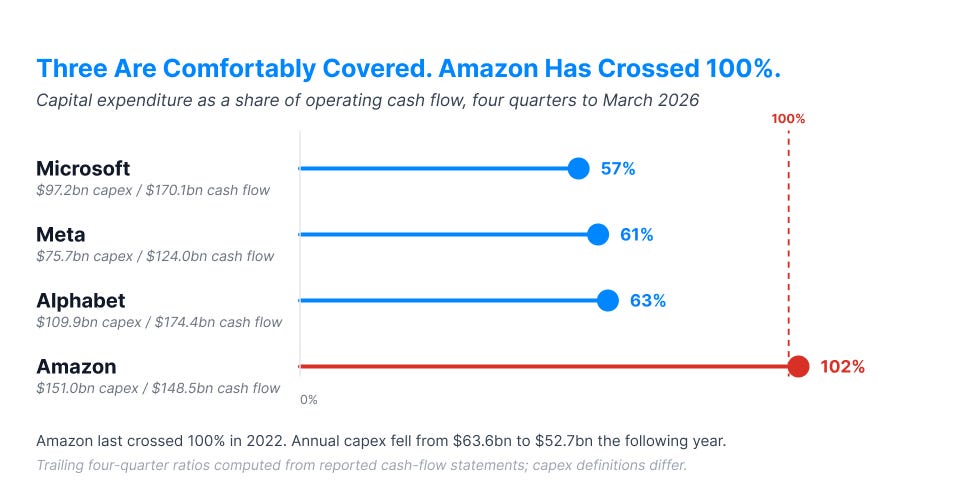
The standard defence of the buildout is that it is funded from operations rather than from the balance sheet. For three of the four, the filings support that. Trailing four-quarter capital expenditure as a share of operating cash flow runs at 57% for Microsoft, 63% for Alphabet and 61% for Meta. High, and comfortably covered.
Amazon is at 102%. That is gross purchases of property and equipment against operating cash flow, not Amazon’s own free cash flow measure, which nets proceeds from sales and incorporates finance leases and so reads differently. On this measure, every dollar of cash generation is going into the ground, and then some. That is the first time Amazon’s trailing capex has exceeded its trailing operating cash flow since 2022, and the 2022 precedent is worth holding onto, because that overbuild ended with annual purchases of property and equipment falling from $63.6 billion to $52.7 billion across the following year, on the same reported cash-flow line. It is the strongest public evidence we have that this cohort does cut when the return arithmetic stops working.
The borrowing is the part that needs explaining, since it is happening at companies that do not obviously need to borrow. The dated record since late 2025: Meta priced $30 billion in October, the largest investment-grade deal of that year, alongside a roughly $27 billion joint venture with Blue Owl funds for the Hyperion data centre that sits off Meta’s balance sheet. Alphabet raised around $25 billion in November and roughly $31 billion more in February, the latter including a 100-year sterling note. Amazon issued $15 billion in November and a further $24.9 billion on 7 July. Oracle raised $18 billion last September. Microsoft has issued no senior notes at all and has instead added $26.0 billion of finance-lease right-of-use assets over the same four quarters, which is capacity arriving as a debt-like obligation rather than as a bond.
Three readings of that behaviour are defensible and not mutually exclusive: managements are matching 25 to 40 year assets with long-dated liabilities while spreads are hospitable; they are protecting dividend and buyback programmes from absorbing capex volatility; and they are pre-funding a cost curve they can see coming. Note also what the structures do to the reported numbers. A minority-owned SPV will often sit off balance sheet, though whether it consolidates turns on control and variable-interest tests rather than on the equity percentage alone. Reported debt understates the sector’s fixed commitments, and the difference is disclosed in lease footnotes and press releases rather than in debt tables.
Here is the mechanism the whole piece turns on, and it is not complicated. A dollar of server spend hits the cash flow statement immediately and the income statement in roughly equal slices over five to six years. A dollar of data centre shell spreads over 25 to 40 years. When capital expenditure triples in three years, recognised depreciation lags mechanically. Reported margins are correct under the applicable standards; our reading is that they flatter the run-rate economics of the buildout until the lag closes.
Against $433.9 billion of trailing capital expenditure, the same four companies recognised roughly $149 billion of depreciation. They are spending at close to three times the rate their income statements currently charge them for it, and on the latest quarter alone the ratio is nearer three and a half. In the first quarter, Microsoft spent $30.9 billion against roughly $10.4 billion of depreciation on property, equipment and finance-lease right-of-use assets; Meta spent $19.0 billion against $6.0 billion.
That gap is a lag, not a subsidy. And the wave is already visible where disclosure happens to be granular: Meta’s depreciation on servers and network assets went from $7.32 billion in 2023 to $11.34 billion in 2024 to $13.36 billion in 2025, up 83% in two years despite a life extension that deferred an estimated $2.9 billion of it. Alphabet’s property and equipment depreciation went $11.9 billion, $15.3 billion, $21.1 billion across the same years.
Which brings us to the accounting policy underneath, and to the single most underread paragraph in this sector’s filings. The disclosed server and network useful-life changes we identified over 2020 to 2024 all moved toward longer lives, and each extension deferred depreciation into later years precisely as spending accelerated. Microsoft moved servers from four years to six in 2022. Alphabet moved to six years in January 2023. Amazon moved from five to six in January 2024.
In January 2025 the pattern broke. Amazon cut the life of a subset of its servers and network equipment back from six years to five, citing the pace of technology development in AI and machine learning, and separately took accelerated depreciation on hardware retired early. Meta extended to 5.5 years in the same month. Two sophisticated operators of overlapping classes of server and network equipment now publish opposite directional judgements about how long it stays useful, and one of them has already conceded the shorter answer and accelerated the expense recognition that follows.
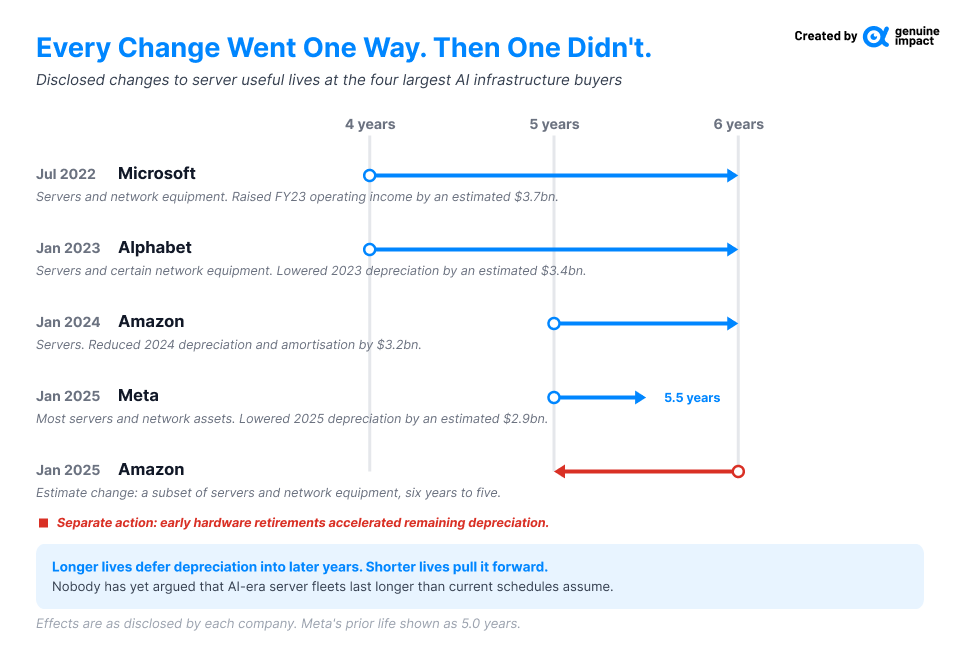
The bear case, put most aggressively last November, is that accelerator fleets have an economic life closer to two or three years than to five or six. We do not endorse a specific number for the shortfall, because it cannot be verified from public filings. But observe the shape of the risk: we are not aware of a public argument that AI-era server fleets last longer than the schedules currently assume. On the evidence available, the error, if there is one, looks more likely to run in one direction than the other.
Every dollar in the first section is revenue for somebody. That is the part the market has already worked out, and it explains the strangest feature of this year’s tape.
The Philadelphia Semiconductor Index had its strongest quarter on record in the second quarter of 2026. Over the same stretch the largest technology companies have lagged badly, and in the week to 24 July the Roundhill Magnificent Seven ETF fell more than 5% while semiconductor funds finished higher. The market is paying the receiver of the capital expenditure and discounting the payer.
In the near term that is simply correct. Once a buildout has been financed and the capacity contracts signed, the spending programme becomes substantially harder to reverse. Microsoft attributing roughly $25 billion of its own number to component prices is a demand signal wearing a cost costume.
Over a two to three year view it is reflexive, and this is the sentence we would want a reader to keep: in aggregate, the supplier’s order book becomes the buyer’s future depreciation schedule. The same $700 billion that makes the memory and foundry complex look like a structural growth story in 2026 is what makes the buyers’ income statements look worse in 2028. These are not two trades. They are one cash flow, observed at two points on its journey, and priced as though the second observation were independent of the first. The transmission runs through margin: where recognised depreciation compounds faster than revenue, the depreciation burden creates arithmetic pressure on operating margins, without anything going wrong operationally. Chief financial officers facing margin questions have historically responded by moderating capital expenditure growth. Amazon in 2022 is the template, and Amazon is already the one spending past its cash generation.
Microsoft, Meta, Amazon and Apple all report in the next few days, into a Federal Reserve meeting where the market’s base case is no change. The headline numbers will be revenue, cloud growth and next year’s capex guidance, and those will move prices. We would read three other things first.
The depreciation line, not the capex line.
Capital expenditure is already guided and largely committed; the surprise capacity in that number is low. The informative series is the growth rate of recognised depreciation, and specifically whether it is accelerating faster than revenue. That ratio is the crossover, and it is visible now in every quarterly filing.
Any change of estimate on useful lives.
These arrive as a single paragraph in an estimate-change disclosure, usually in January or February annual reports, and they are worth more than any keynote. A second company following Amazon’s direction would be the most important datapoint of the year for this sector. A further extension by anyone would warrant close attention both to the technological assumptions behind it and to its resulting margin benefit.
Purchase commitments and lease footnotes, not the debt table.
Contracted future obligations for chips, capacity and power are where the real fixed cost sits, and off-balance-sheet joint ventures are where a growing share of it is being parked. Read the footnote, not the leverage ratio.
There is a version of this cycle that works. Cloud backlogs represent contracted commitments rather than management revenue forecasts, and $514 billion of them at one company is a real answer to the demand question. If revenue compounds faster than the depreciation burden, this mechanism alone need not compress margins, and the whole discussion becomes a footnote about accounting.
But it is a race between two growth rates, and one is far more pre-committed than the other. On current useful-life assumptions and recent spending patterns, we expect much of the incremental depreciation burden attached to equipment already bought to build through 2027 to 2029, on a schedule disclosed in a January estimate-change paragraph rather than one set by adoption curves. Alphabet’s negative quarter was not the moment the spending became a problem. It was the first moment the cash flow statement and the income statement told visibly different stories about the same company, and only one of those stories has finished being told.
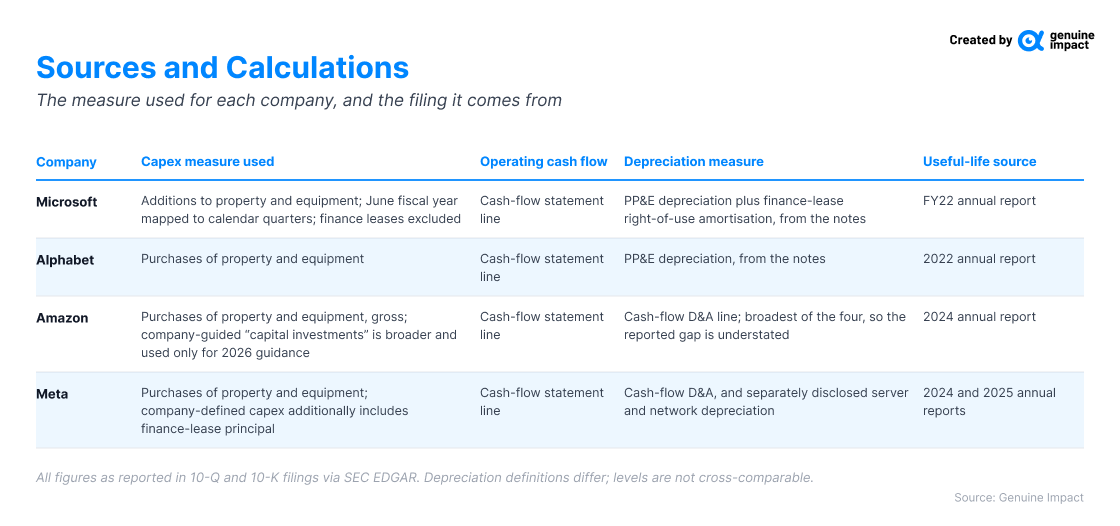
All figures are as reported in Microsoft, Alphabet, Amazon and Meta 10-Q and 10-K filings via SEC EDGAR. Company figures, multi-company sums and ratios were compiled from those filings by Silicon Analysts (10 July 2026); depreciation definitions differ by company and levels should not be cross-compared. Alphabet second-quarter figures are from the company's earnings release of 22 July 2026 and the associated call. Index and fund performance from exchange and issuer data. Figures change with each reporting quarter and should be re-verified against primary filings before publication.
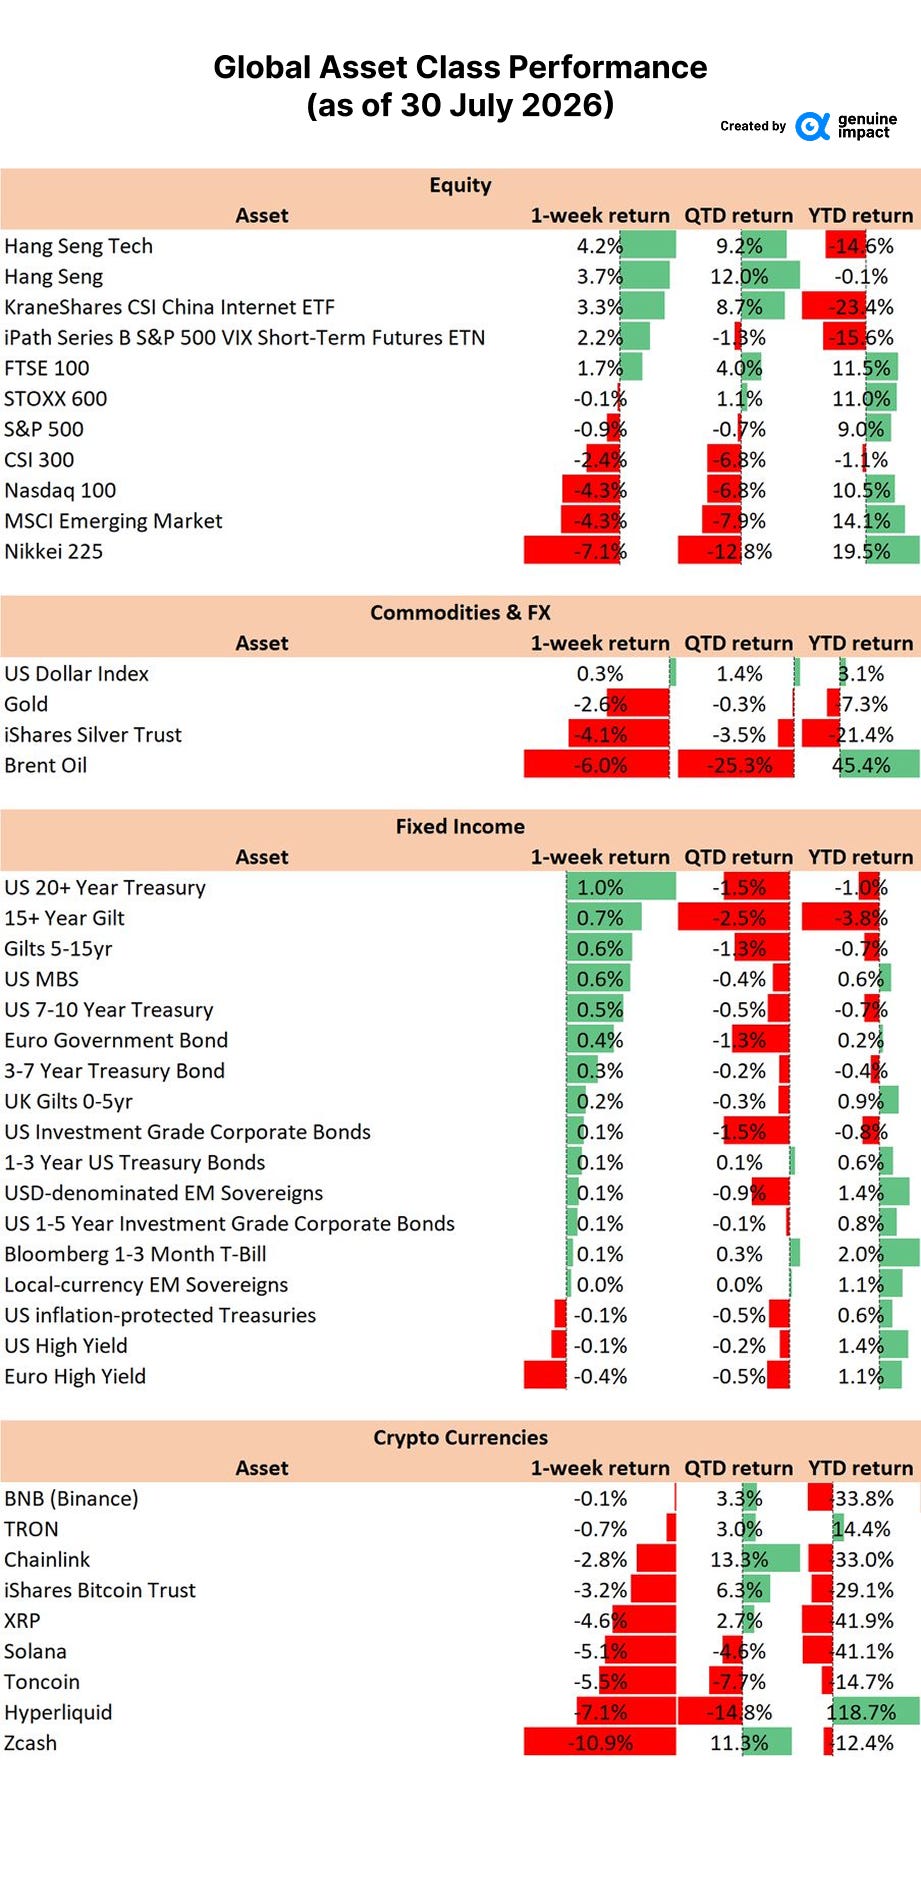
Global markets did not fall this week so much as change direction. The rotation was violent inside equities and barely visible at the index level, with China leading and US tech sold hard. Hang Seng Tech rose 4.2% and the Hang Seng 3.7%, with the KraneShares CSI China Internet ETF up 3.3%. The FTSE 100 added 1.7%. Against that, the Nasdaq 100 fell 4.3%, MSCI Emerging Markets 4.3%, and the Nikkei 225 7.1%, its quarter now 12.8% lower. The S&P 500 lost just 0.9%, and the VIX short-term futures position rose 2.2% as hedges were put back on.
Fixed income was the quiet winner, and duration led it. Long US Treasuries returned 1.0%, 15+ Year Gilts 0.7%, and 5-15 year Gilts and US MBS 0.6% each. Only three lines in the sheet finished negative, and only Euro High Yield by more than a tenth of a point, at 0.4% down.
Commodities and crypto took the brunt of the risk reduction. Brent fell 6.0% and is now 25.3% lower on the quarter, silver 4.1% and gold 2.6%, while the US Dollar Index edged up 0.3%. Crypto was uniformly weak: Zcash off 10.9%, Hyperliquid 7.1%, Toncoin 5.5%, Solana 5.1% and XRP 4.6%, with the iShares Bitcoin Trust down 3.2%.
‼️ Last week the AI complex was carrying the tape. This week it was the source of the losses. The question is whether the portfolio’s structural winners gave back gains, or whether something in the theme changed.
While the index barely moved, our top holding gained 14.0% in a single week — and it is the holding with the weakest share price return of the year so far. Want to see which stocks, at what weights, and what we are watching next? Subscribe to unlock the full holdings and performance below ⬇️
Comments
Nothing yet. Say the first thing.
Sign in to join the conversation.