
Investors today are inundated with noise. Asset prices swing on sentiment. Markets sync and spiral together. In a climate like this, the promise of true diversification has never been more appealing—or more elusive.
At Fractalized, we wanted answers. Not opinions. So we went back to the numbers.
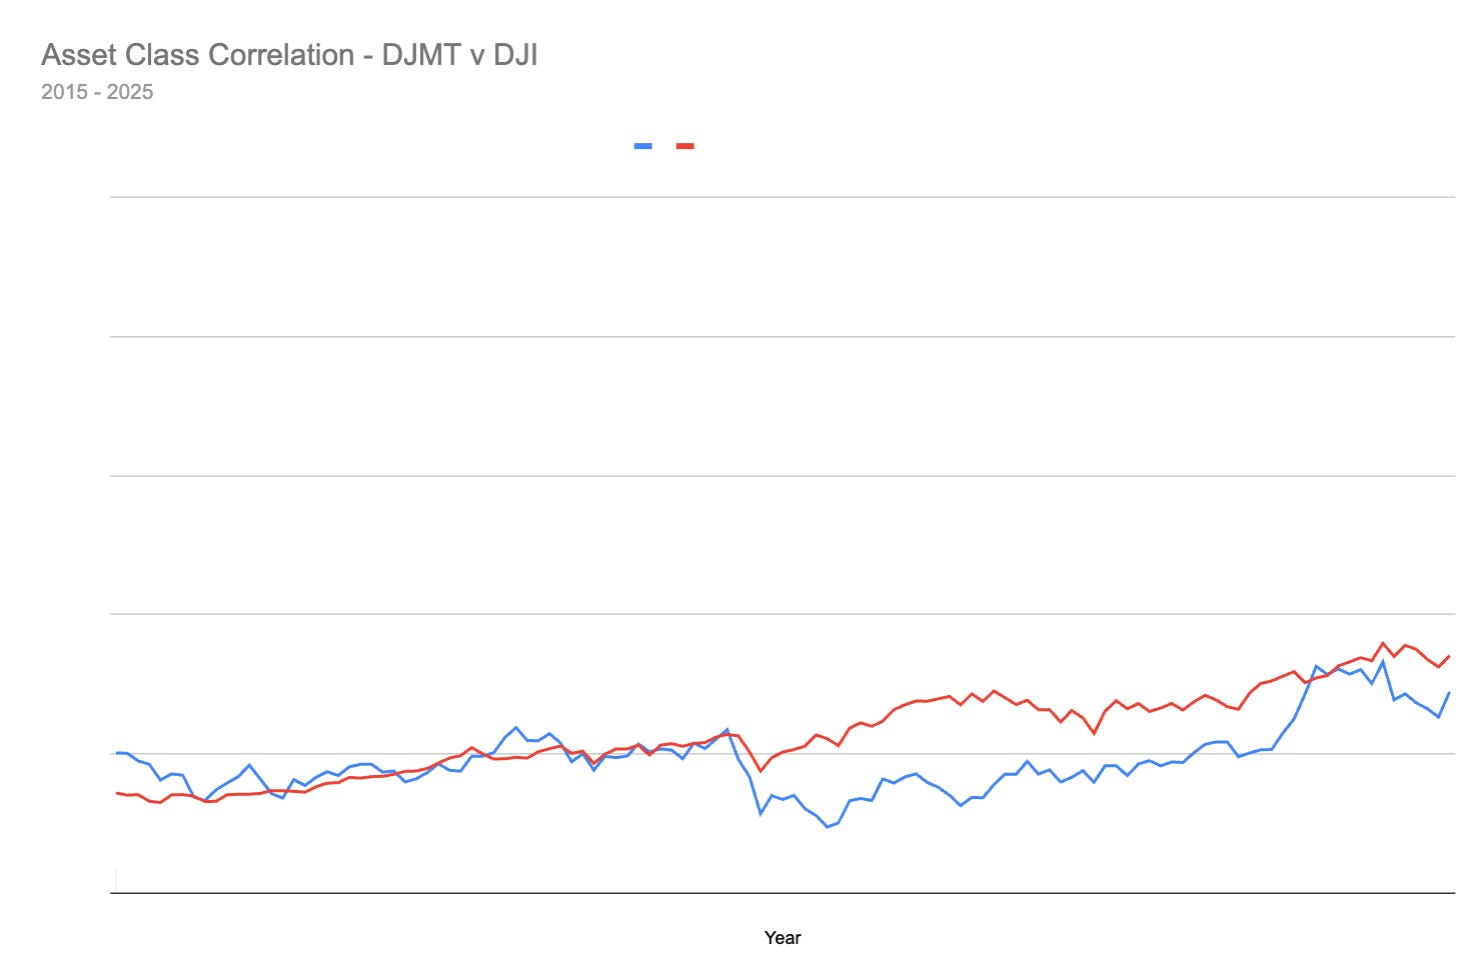
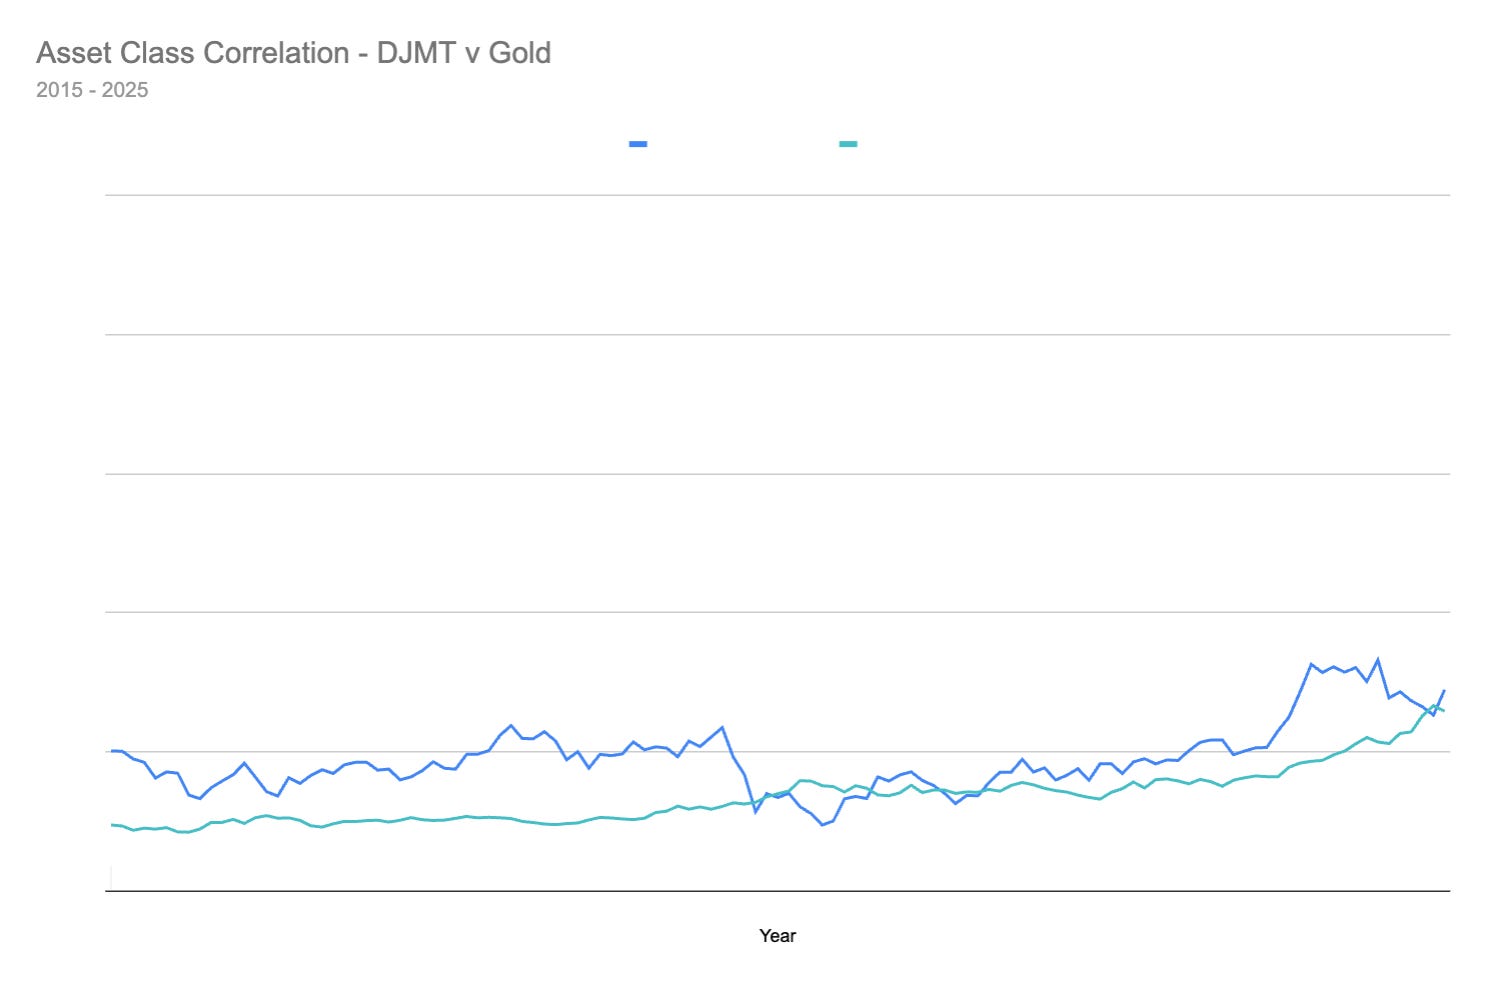
We analyzed ten years of historical price data (2015–2025) across Dow Jones Industrial Average (DJI), Dow Jones Maritime Transportation Index (DJMT), Gold, Bitcoin (BTC), Commercial Real Estate and US House prices. The results were striking: maritime transportation assets display consistently low correlation to the rest of the market.
Asset PairCorrelation
Marine (DJMT) vs BTC: 0.57
Marine vs DJI: 0.55
Marine vs Gold: 0.54
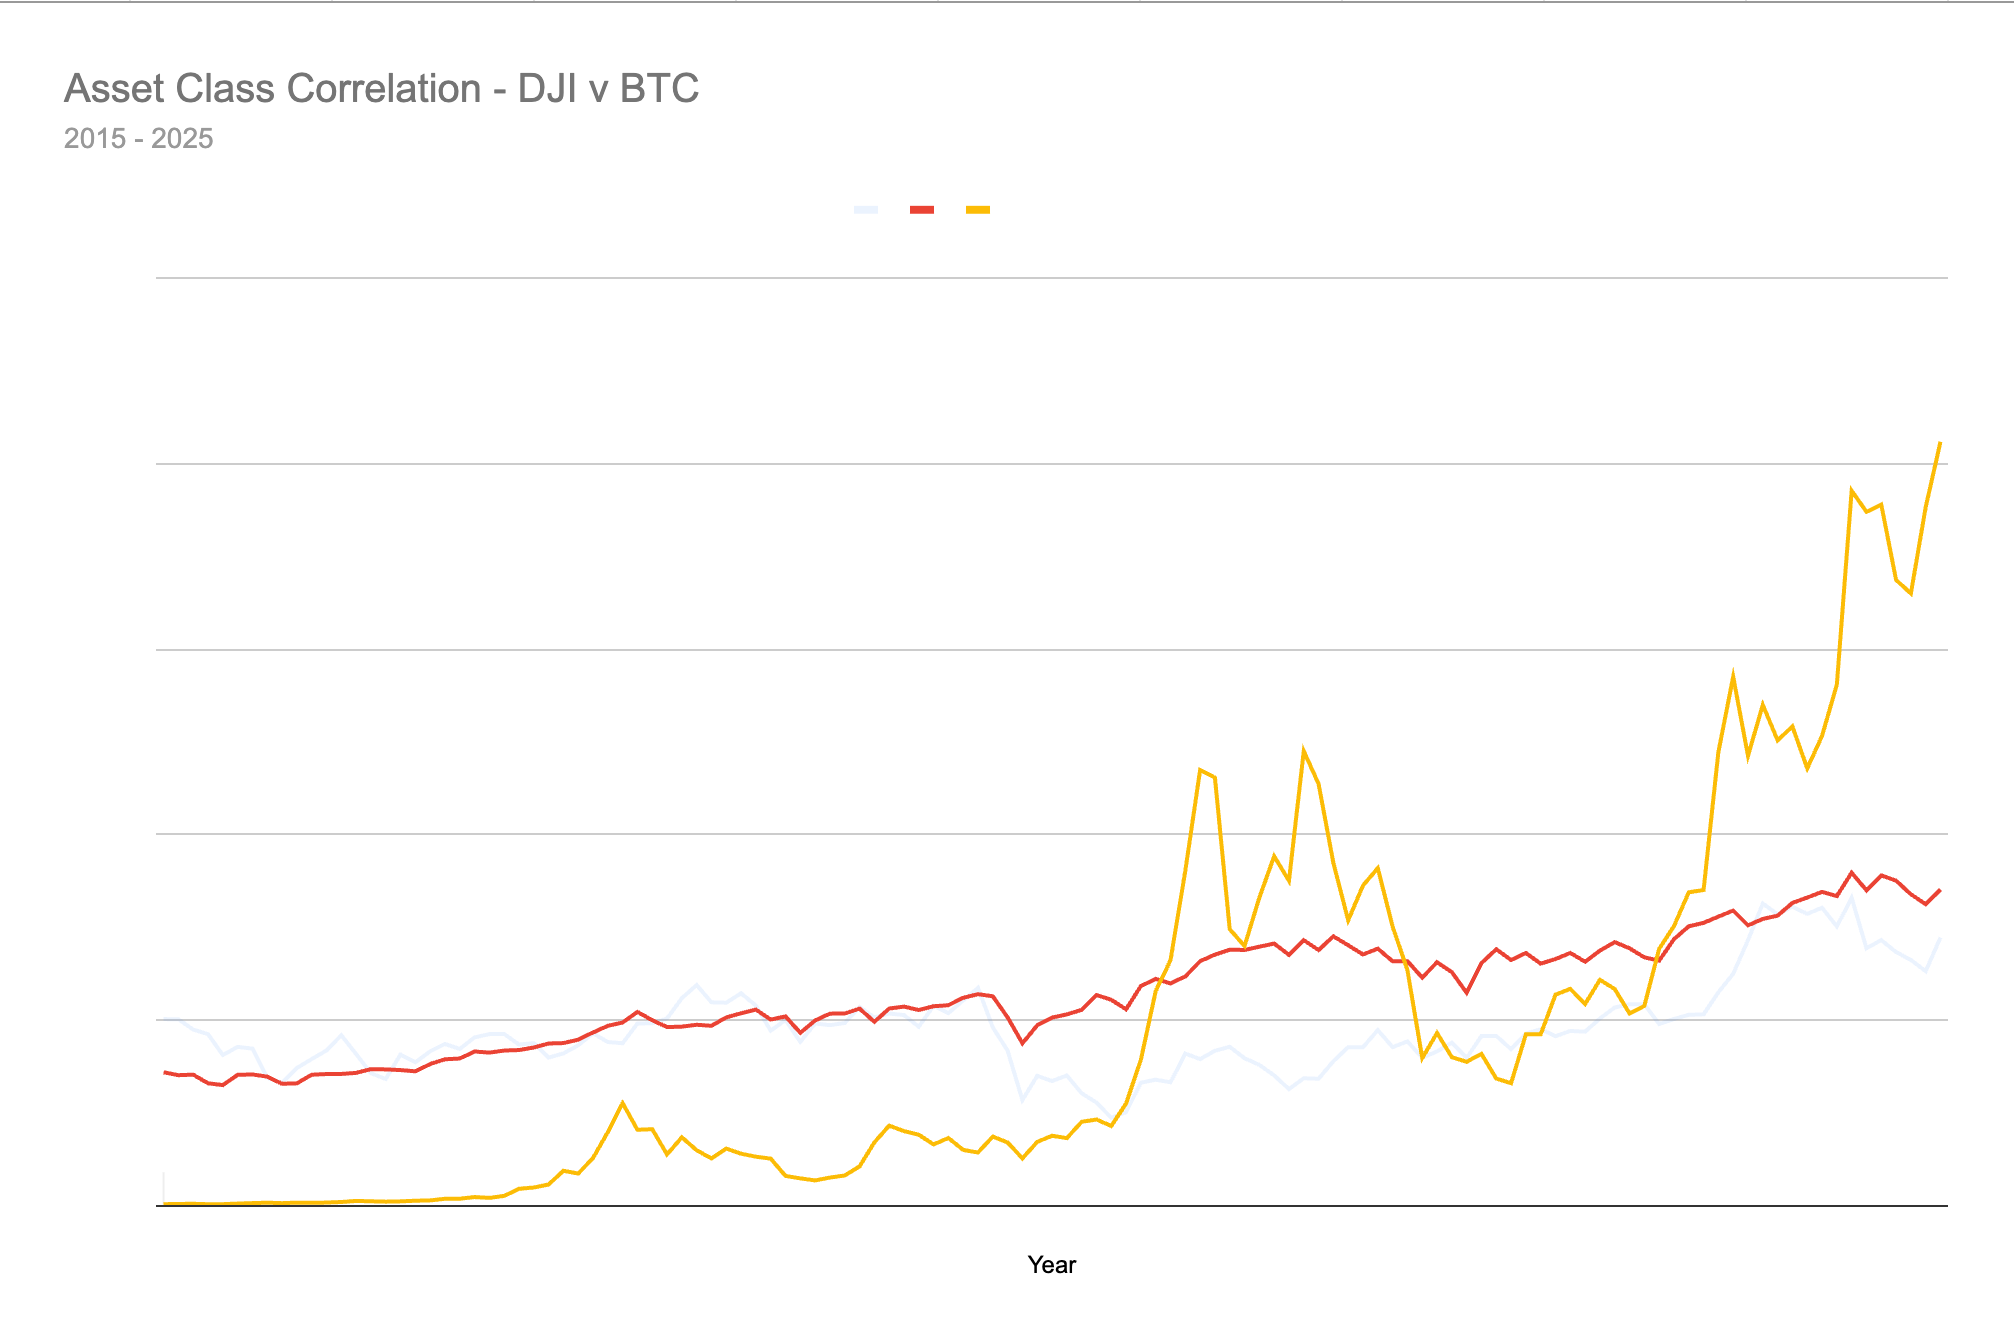
DJI vs BTC: 0.90
Gold vs BTC: 0.91
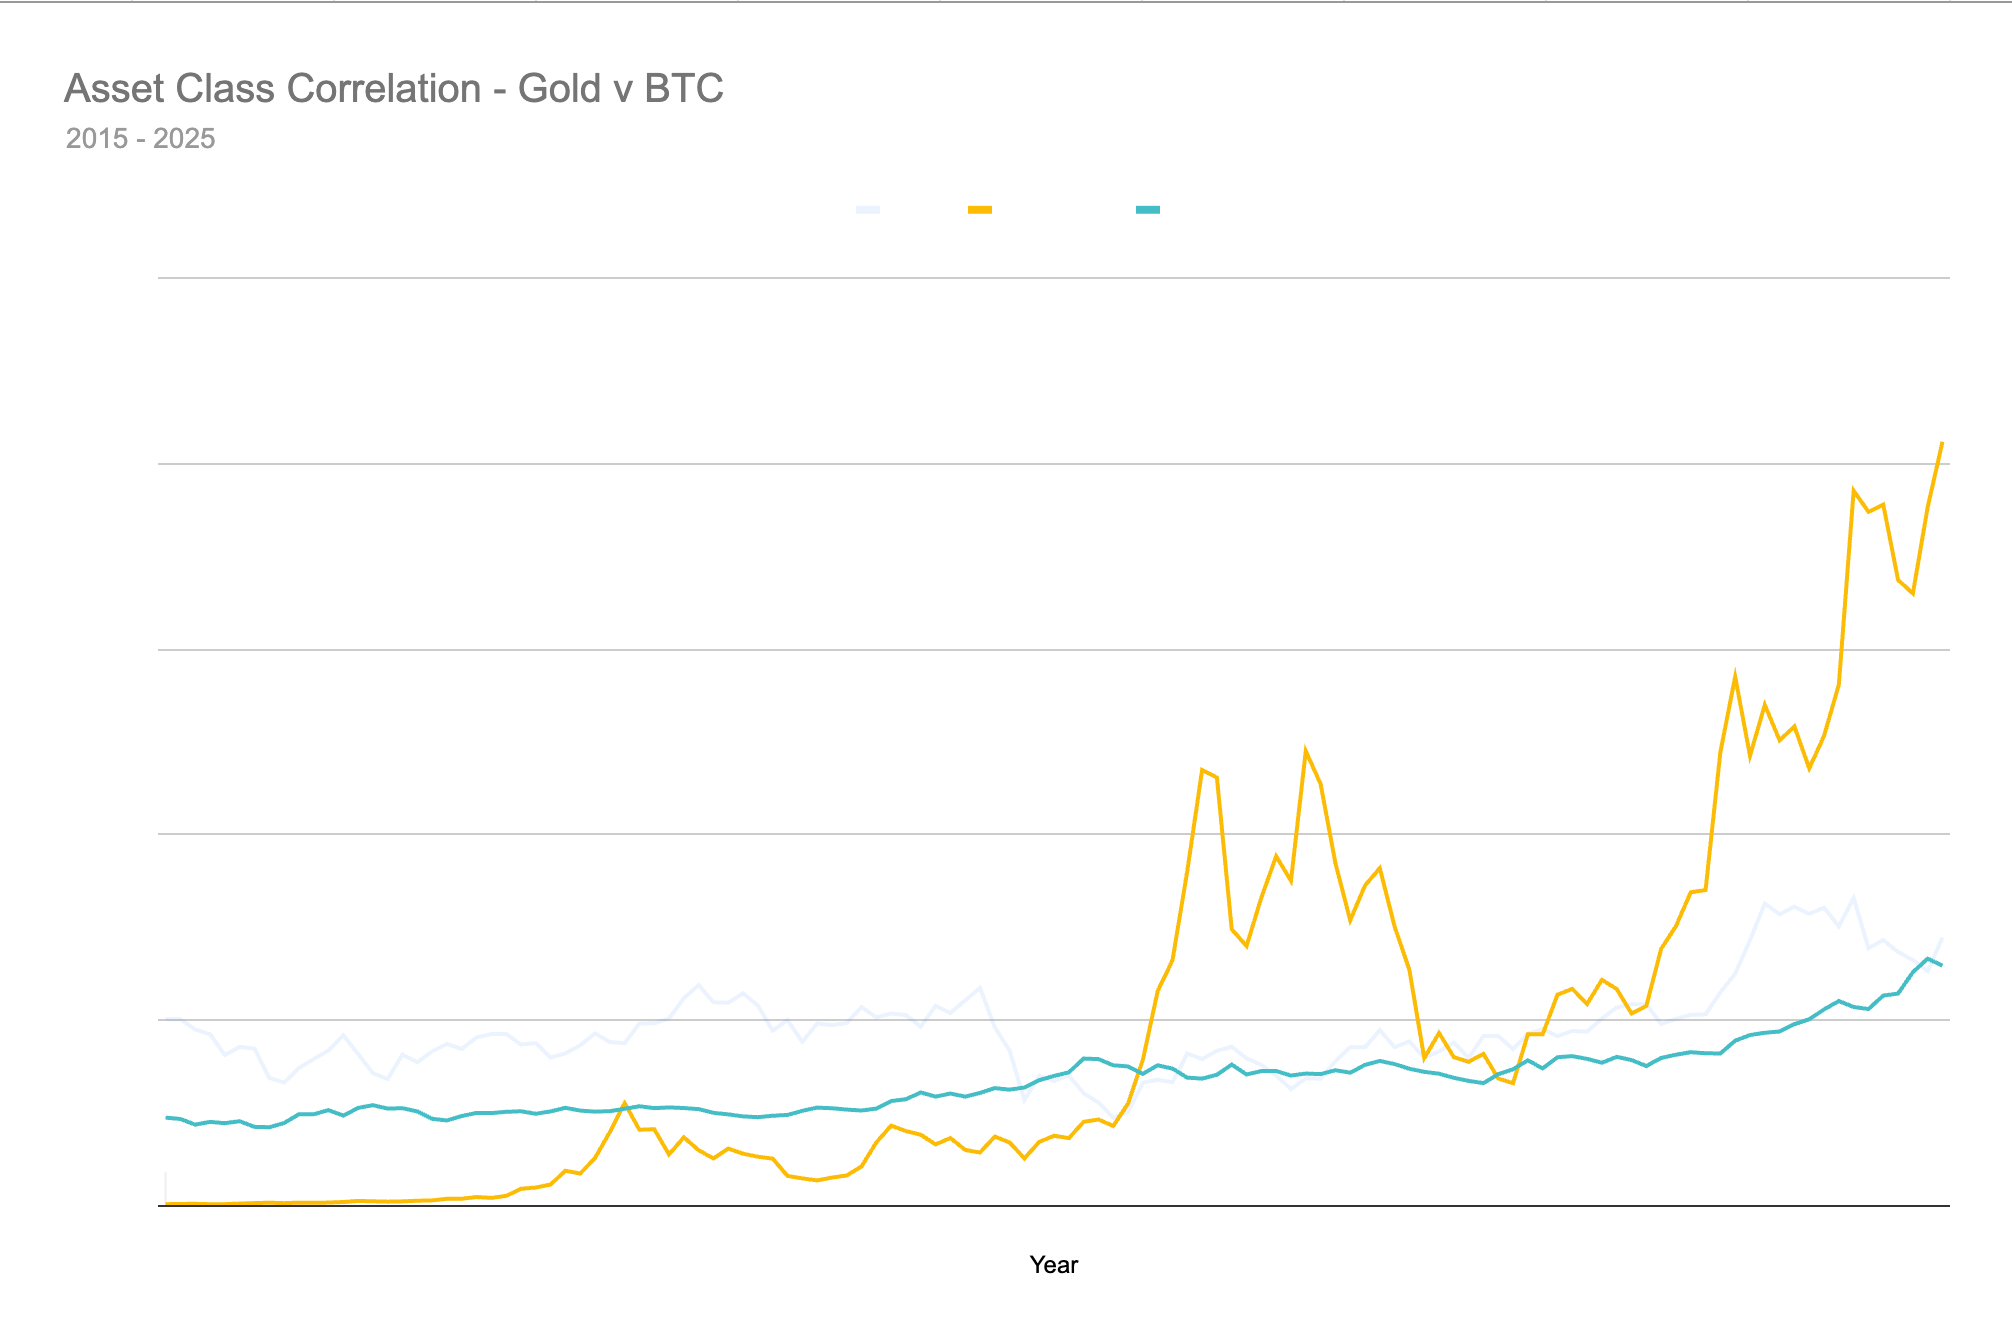
DJI vs House Prices: 0.93
House vs BTC: 0.83
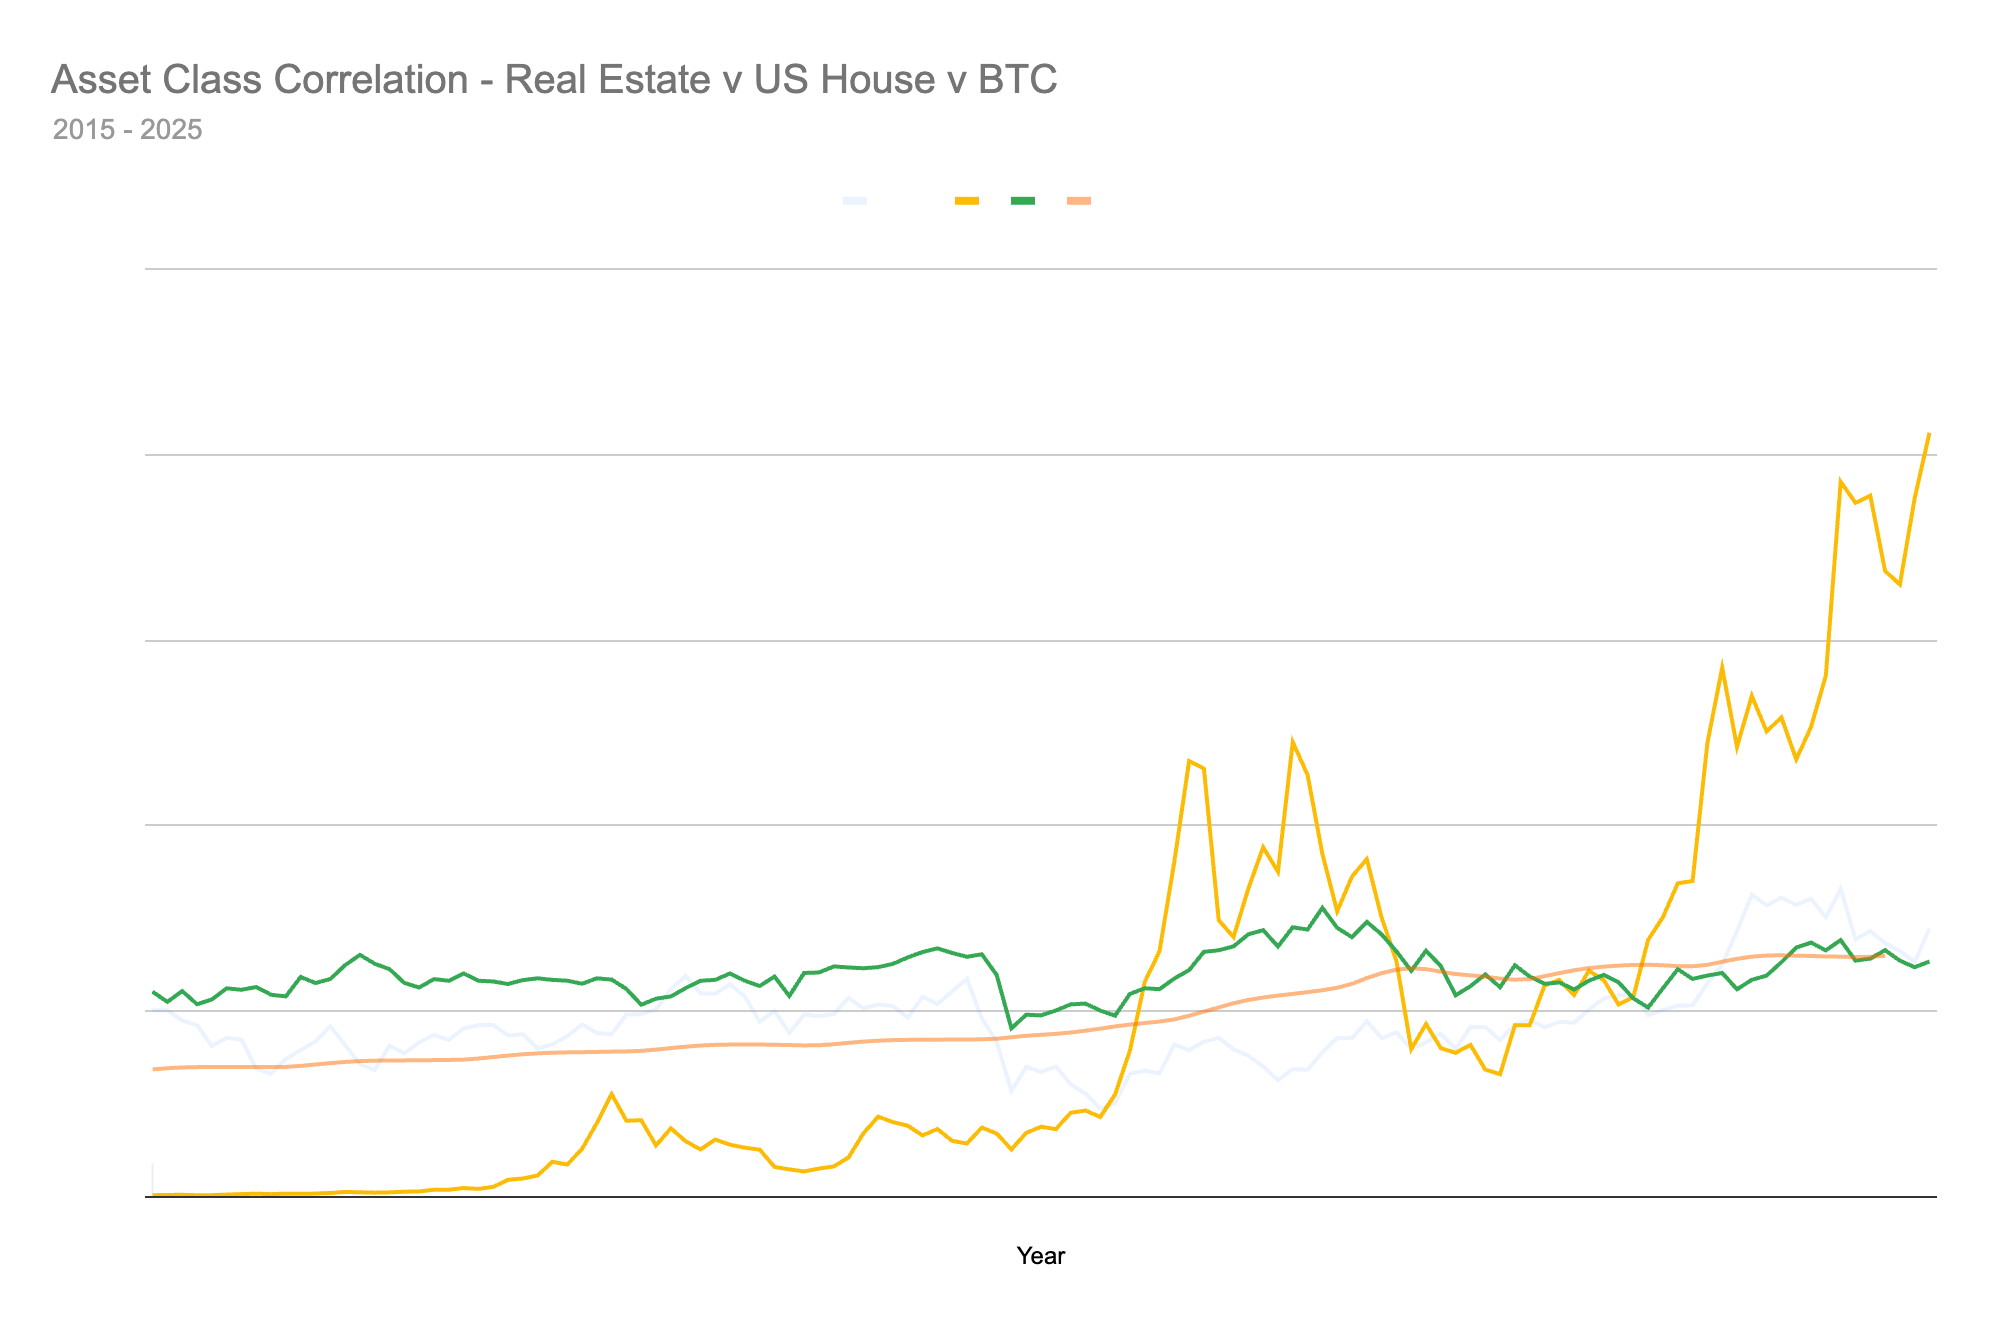
Even as crypto and equities mimic each other more tightly, marine assets remain a statistical outlier. Their behavior is influenced by trade dynamics, commodity flows, and regional economic policies—not monetary tightening or tech hype cycles.
That independence isn’t just theoretical. It’s measurable.
Correlation is only part of the puzzle. Investors also need to understand how turbulent the ride may be.
Here’s what our volatility analysis showed:
Asset10-Year Annualized Volatility
Marine (DJMT): 0.326
Bitcoin (BTC): 0.686
While Bitcoin is renowned for meteoric returns, it’s also more than twice as volatile as maritime transport indices. Maritime assets, particularly those backed by income from long-term contracts, offer a far smoother return profile—a feature investors often don’t appreciate until markets turn sour.
This risk-adjusted stability sets the stage for intelligent, yield-seeking capital.
Let’s clarify: DJMT, the Dow Jones Marine Transportation Index, is merely a broad proxy—an index of listed shipping conglomerates. Fractalized offers something more targeted, and more powerful.
Each vessel on our platform is:
A self-contained asset, selected through rigorous due diligence;
Deployed under fixed-income time charters, delivering monthly income;
Tokenized for fractional ownership, providing access and liquidity;
Managed by a team of shipping experts focused on asset appreciation and optimal exit timing.
In short, DJMT shows how marine transport behaves on the surface. Fractalized dives deeper—unlocking individual vessel performance, not index averages.
Each asset on Fractalized’s platform typically targets annual net yields of 14-18%, distributed in stablecoins and backed by real operational cash flow. Investors can track performance in real time, trade their holdings in a secondary market, and participate in upside events like vessel sales.
This isn’t speculative crypto. This is infrastructure-grade investing, finally made accessible.
Forget “alt assets” that mirror the S&P on bad days and decouple only in marketing decks. If you want actual diversification, grounded in uncorrelated income, maritime assets deserve a seat at your table.
Fractalized brings you onboard.
Ready to explore? Join today at Fractalized.io and access an asset class that moves independently, generates yield, and finally diversifies like you mean it.
Sources:
DJMT 10 year historical data: https://www.investing.com/indices/dj-marine-transportation-historical-data
DJI 10 year historical data: https://www.investing.com/indices/us-30-historical-data
BTC 10 year historical data: https://www.investing.com/crypto/bitcoin/historical-data
Gold 10 year historical data: https://www.investing.com/commodities/gold-historical-data
Global real estate (FTSE EPRA/NAREIT) 10 year historical data: https://www.investing.com/indices/ftse-epra-nareit-united-states-historical-data
US House (Case-Shiller US National Home Price Index) 10 year historical data: https://fred.stlouisfed.org/series/CSUSHPINSA
No posts
Comments
Nothing yet. Say the first thing.
Sign in to join the conversation.