
(Post written by Simas Kučinskas and Chris Karvetski)
Good forecasts often come with a rationale—the reasoning behind the number. In our Longitudinal Expert AI Panel (LEAP), for example, forecasters write hundreds of thousands of words each month, explaining their logic, citing evidence, and weighing competing considerations.
That data lets us report not just that AI experts expect a robot to reliably make a cup of coffee in less than a decade, but why they think so. For example, these are two LEAP rationales from respondents who expect robots to be able to reliably make a cup of coffee soon (source):
Unlike autonomous vehicles, this test is conducted in a pre-consented experimental setting, removing social and regulatory barriers. Current humanoid robots (Tesla Optimus, Figure) have already demonstrated coffee-pouring in structured settings.
The challenge is complex—but it's essentially pattern recognition. For that reason, I expect it to be solvable with current state software technology (the brains), coupled with some further developments in the field of robotics (the muscle).
But here’s what we don’t know: which features of a rationale predict forecasting accuracy? Is statistical reasoning an indicator of forecasting accuracy? What about causal analysis based on domain expertise, as in the rationales highlighted above?
That’s where our latest research comes in. In a new working paper, led by Chris Karvetski and Sheldon Huang, together with Simas Kučinskas, Nadja Flechner, Jingyu Hu, Phil Tetlock, and Ezra Karger, we study which rationale features are correlated with forecasting accuracy.
First, we defined sixty Explanation Quality Markers, or EQMs for short, inspired by the judgment and decision-making literature. Each EQM was described in natural language together with a directional hypothesis: is the EQM expected to help accuracy, or hurt it?
Some EQMs are “good habits,” like statistical or fact-based reasoning. Others are “warning signs,” such as guessing, confirmation bias, or extreme confidence. We then used an LLM (GPT-4o for most of the analysis) to score each rationale against the sixty EQMs on a 0/1/2 scale. For example, a rationale that explicitly cites a base rate might score a 2 on Statistical Reasoning, while one relying on a gut feeling would get a score of 0. For interpretability, we collapsed those sixty scores into a single composite number via a statistical model. Finally, we correlated that composite score with forecasting accuracy. The full scoring pipeline is shown below.
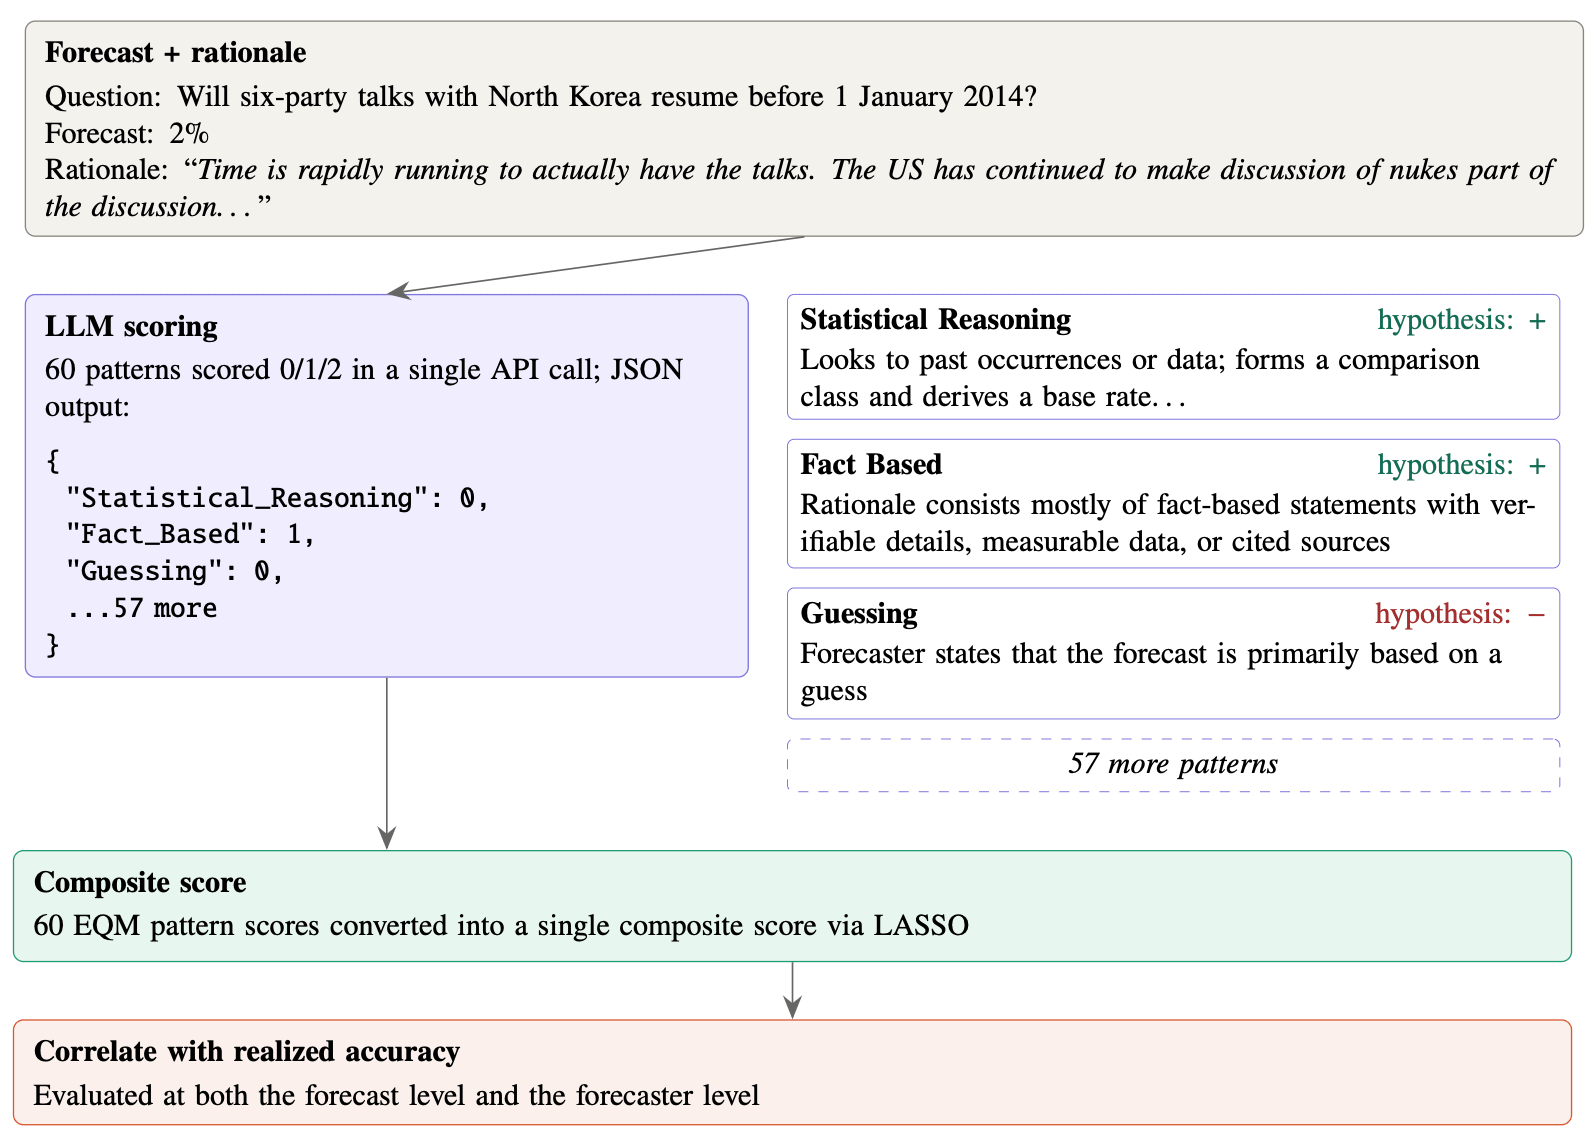
We ran this scoring pipeline on more than 55,000 forecast–rationale pairs from the ACE geopolitical forecasting tournament, the IARPA-funded competition (2011–2015) that produced the Good Judgment Project and the original work on superforecasters. The methodology is cheap and scalable. It cost roughly $0.007 per rationale, or about $400 in total, to score the ACE rationales.
EQMs let us systematically analyze the reasoning behind the forecasts.
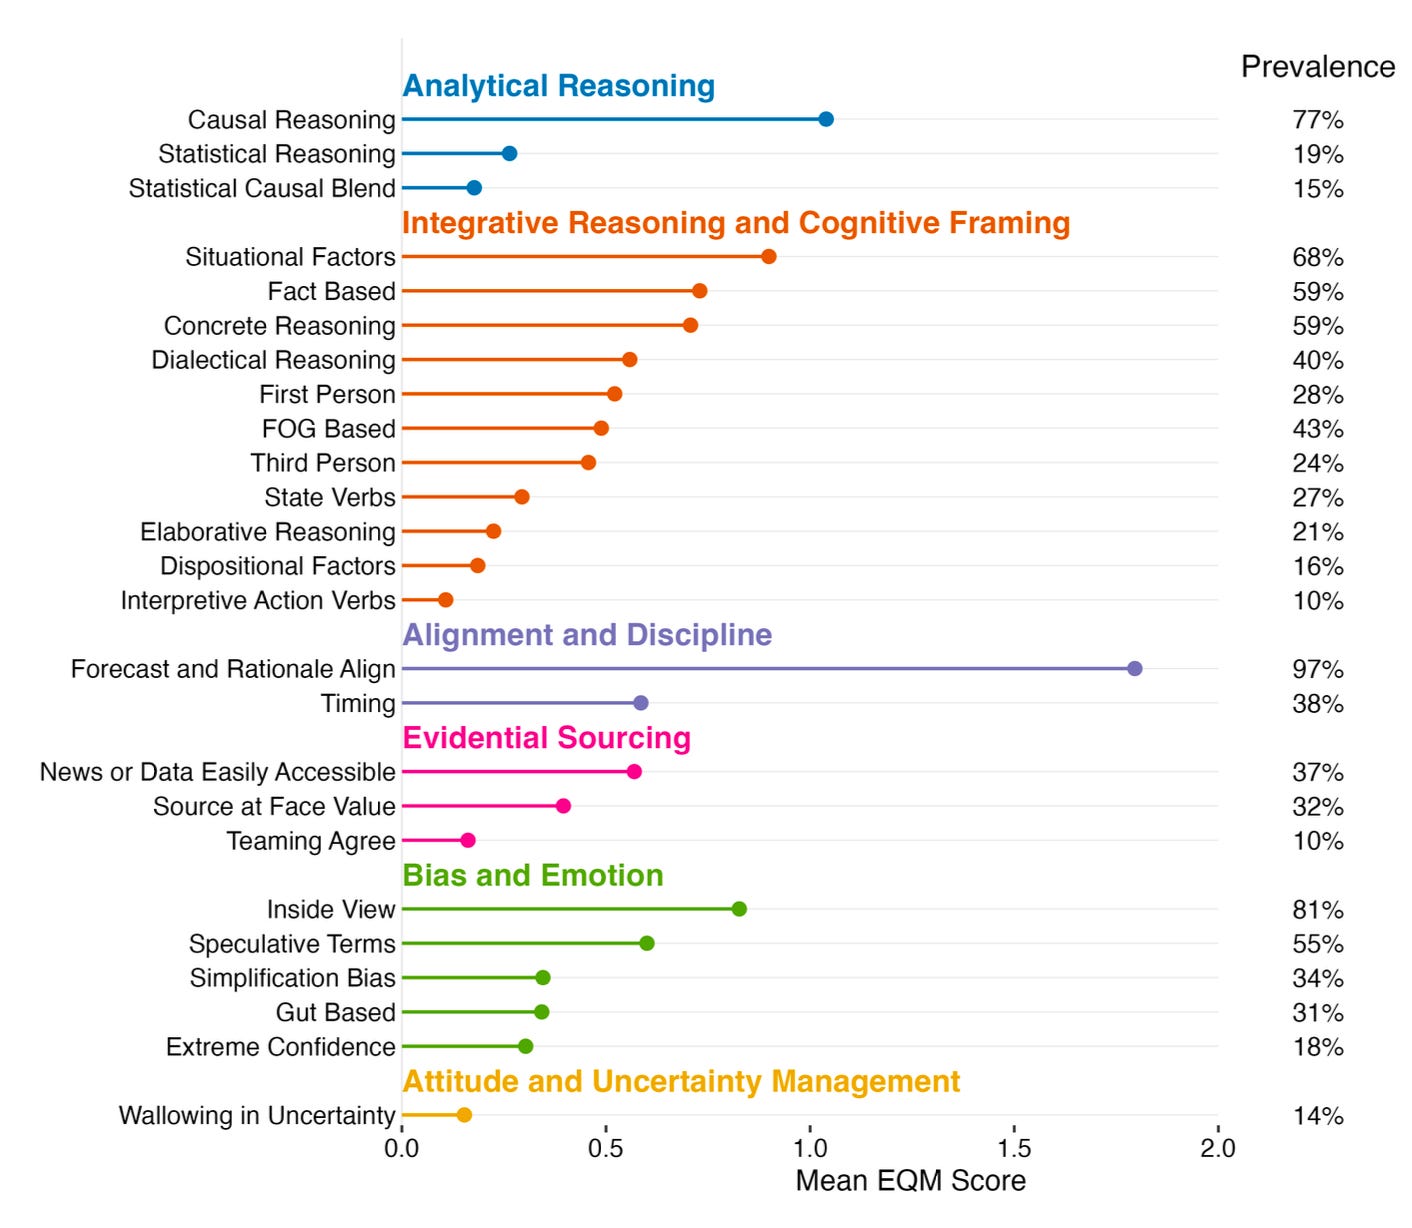
The first thing the EQMs reveal is that forecasters in the ACE tournament typically expressed their reasoning in causal, not statistical, terms: Causal Reasoning shows up in 77% of rationales, while Statistical Reasoning appears in just 19%, a fourfold difference.
The single most common EQM is Forecast and Rationale Align (97%); that is, forecasters’ attitudes—as expressed in their rationales—usually match their quantitative forecasts. However, problematic reasoning patterns are also common. Speculative Terms (55%), Simplification Bias (34%), and Gut Based (31%) all turn up frequently.
OK, but can the EQMs actually predict forecasting accuracy? And do they outperform previous methods?
We measured accuracy in two ways. Forecast-level accuracy asks whether an individual prediction was more accurate than the crowd median on that question. Forecaster-level accuracy measures whether a person was accurate across a whole season of questions. The EQM composite score correlated more strongly with forecasting accuracy than a pre-LLM benchmark did, at both the forecast level (r = .19 vs. .06) and the forecaster level (r = .51 vs. .39); both differences were statistically significant. For context, the pre-LLM benchmark consisted of a rich set of 100+ features, including a comparison-class classifier (Karvetski et al., 2022), automated measures of reasoning complexity, and a standard psycholinguistic dictionary (LIWC 2022). So, EQMs cleared a real bar.
Which EQMs are doing the work?
The graph below shows where each EQM lands in terms of both forecaster-level accuracy (x-axis) and forecast-level accuracy (y-axis).
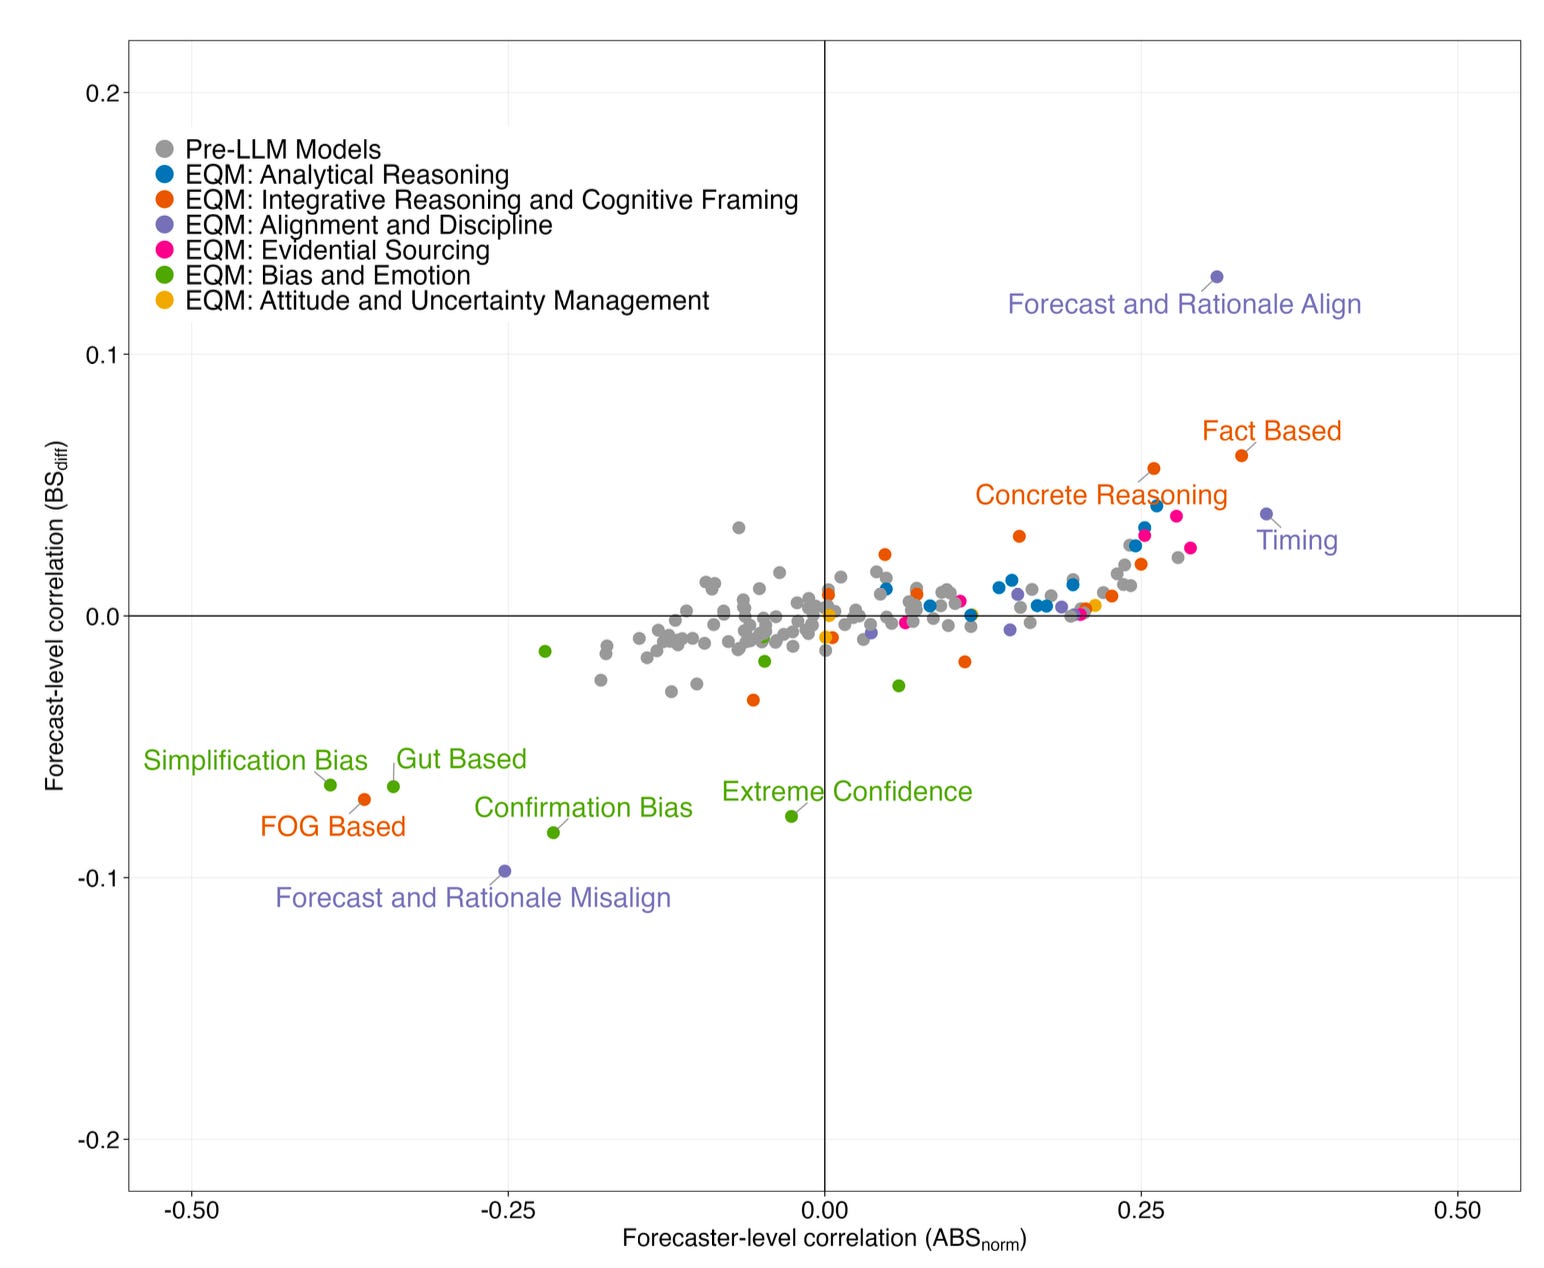
EQMs in the upper-right quadrant (positively associated with both accuracy metrics) include Forecast and Rationale Align, Fact Based, and Concrete Reasoning. The lower-left quadrant (negatively associated with both accuracy metrics) is dominated by the bias family, including Gut Based, Simplification Bias, Confirmation Bias, and Extreme Confidence. In particular, Forecast and Rationale Misalign had the strongest negative correlation with forecast-level accuracy. Statistical Reasoning correlated more strongly with accuracy than Causal Reasoning for both metrics (forecast level: r = .04 vs. .01; forecaster level: r = .26 vs. .05), despite being much less prevalent. In total, over 90% of the statistically significant correlations matched the hypothesized direction. No pre-LLM feature reached the predictive strength of the top EQM patterns, as shown by the gray points clustering around zero.
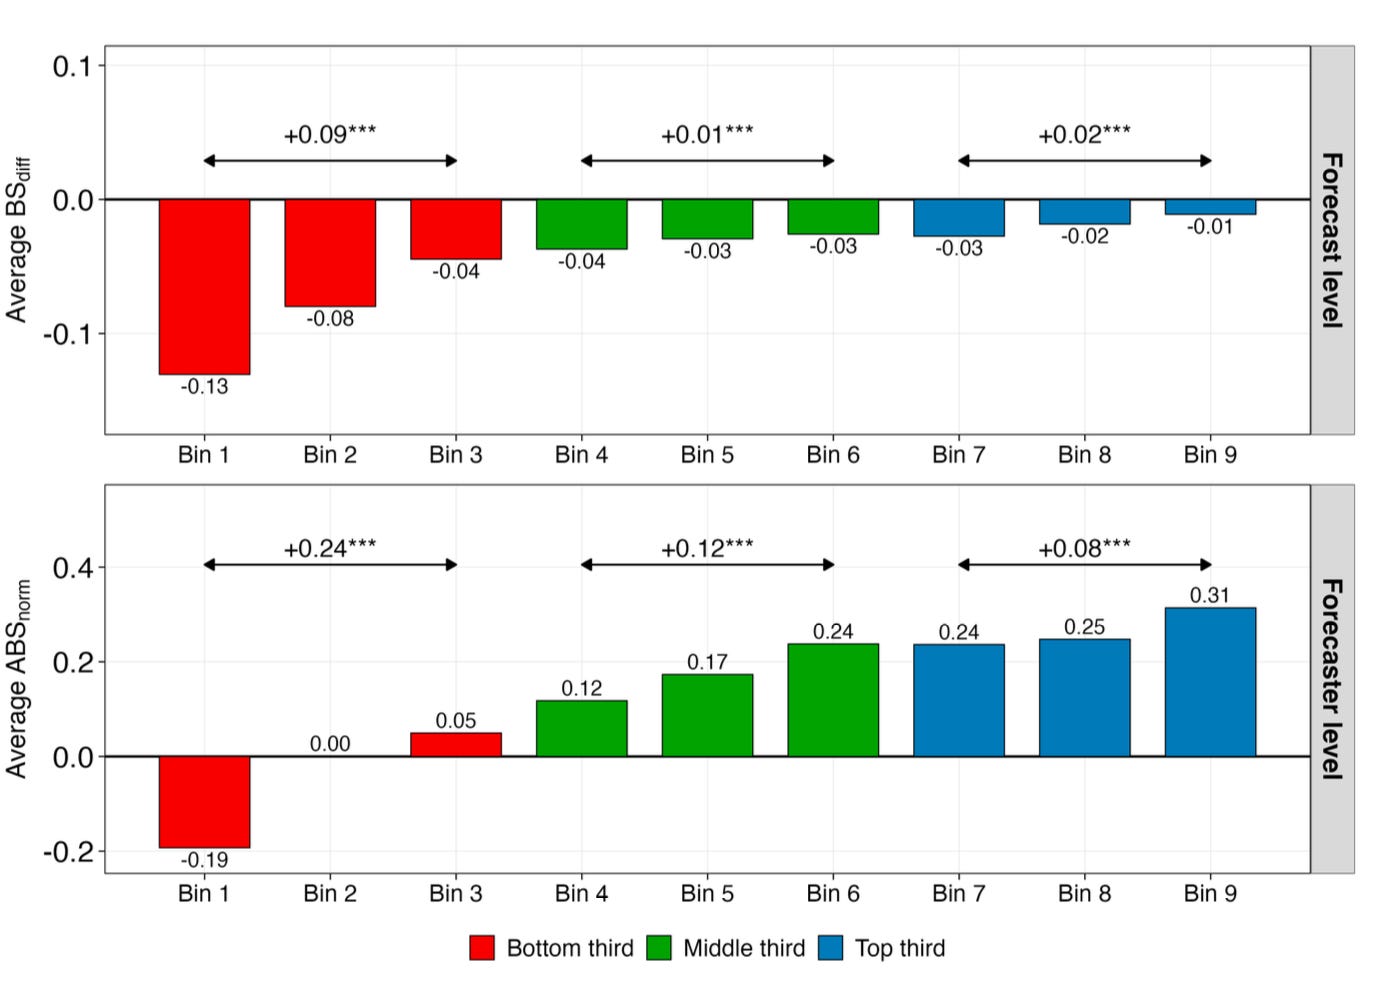
However, EQMs flag bad forecasts and forecasters more reliably than they pick out excellent ones. In the graph below, we sort the data into nine bins by the EQM composite score. At the forecast level, accuracy jumps by 0.09 across the bottom third but only by 0.01 and 0.02 across the middle and top thirds. At the forecaster level, the biggest gain (0.24) is also in the bottom third. Intuitively, a low EQM score appears to be a “red flag,” but a high one is a much weaker “green flag.”
During the ACE tournament, forecasters also rated each other’s rationales for quality.1 That lets us ask a more pointed question: do EQMs outperform human ratings?
The answer is “mostly yes.” Human ratings correlate with forecast-level accuracy at just r = .07, versus r = .23 for the EQM composite score; at the forecaster level, human ratings underperform at r = .40 vs. .50.2
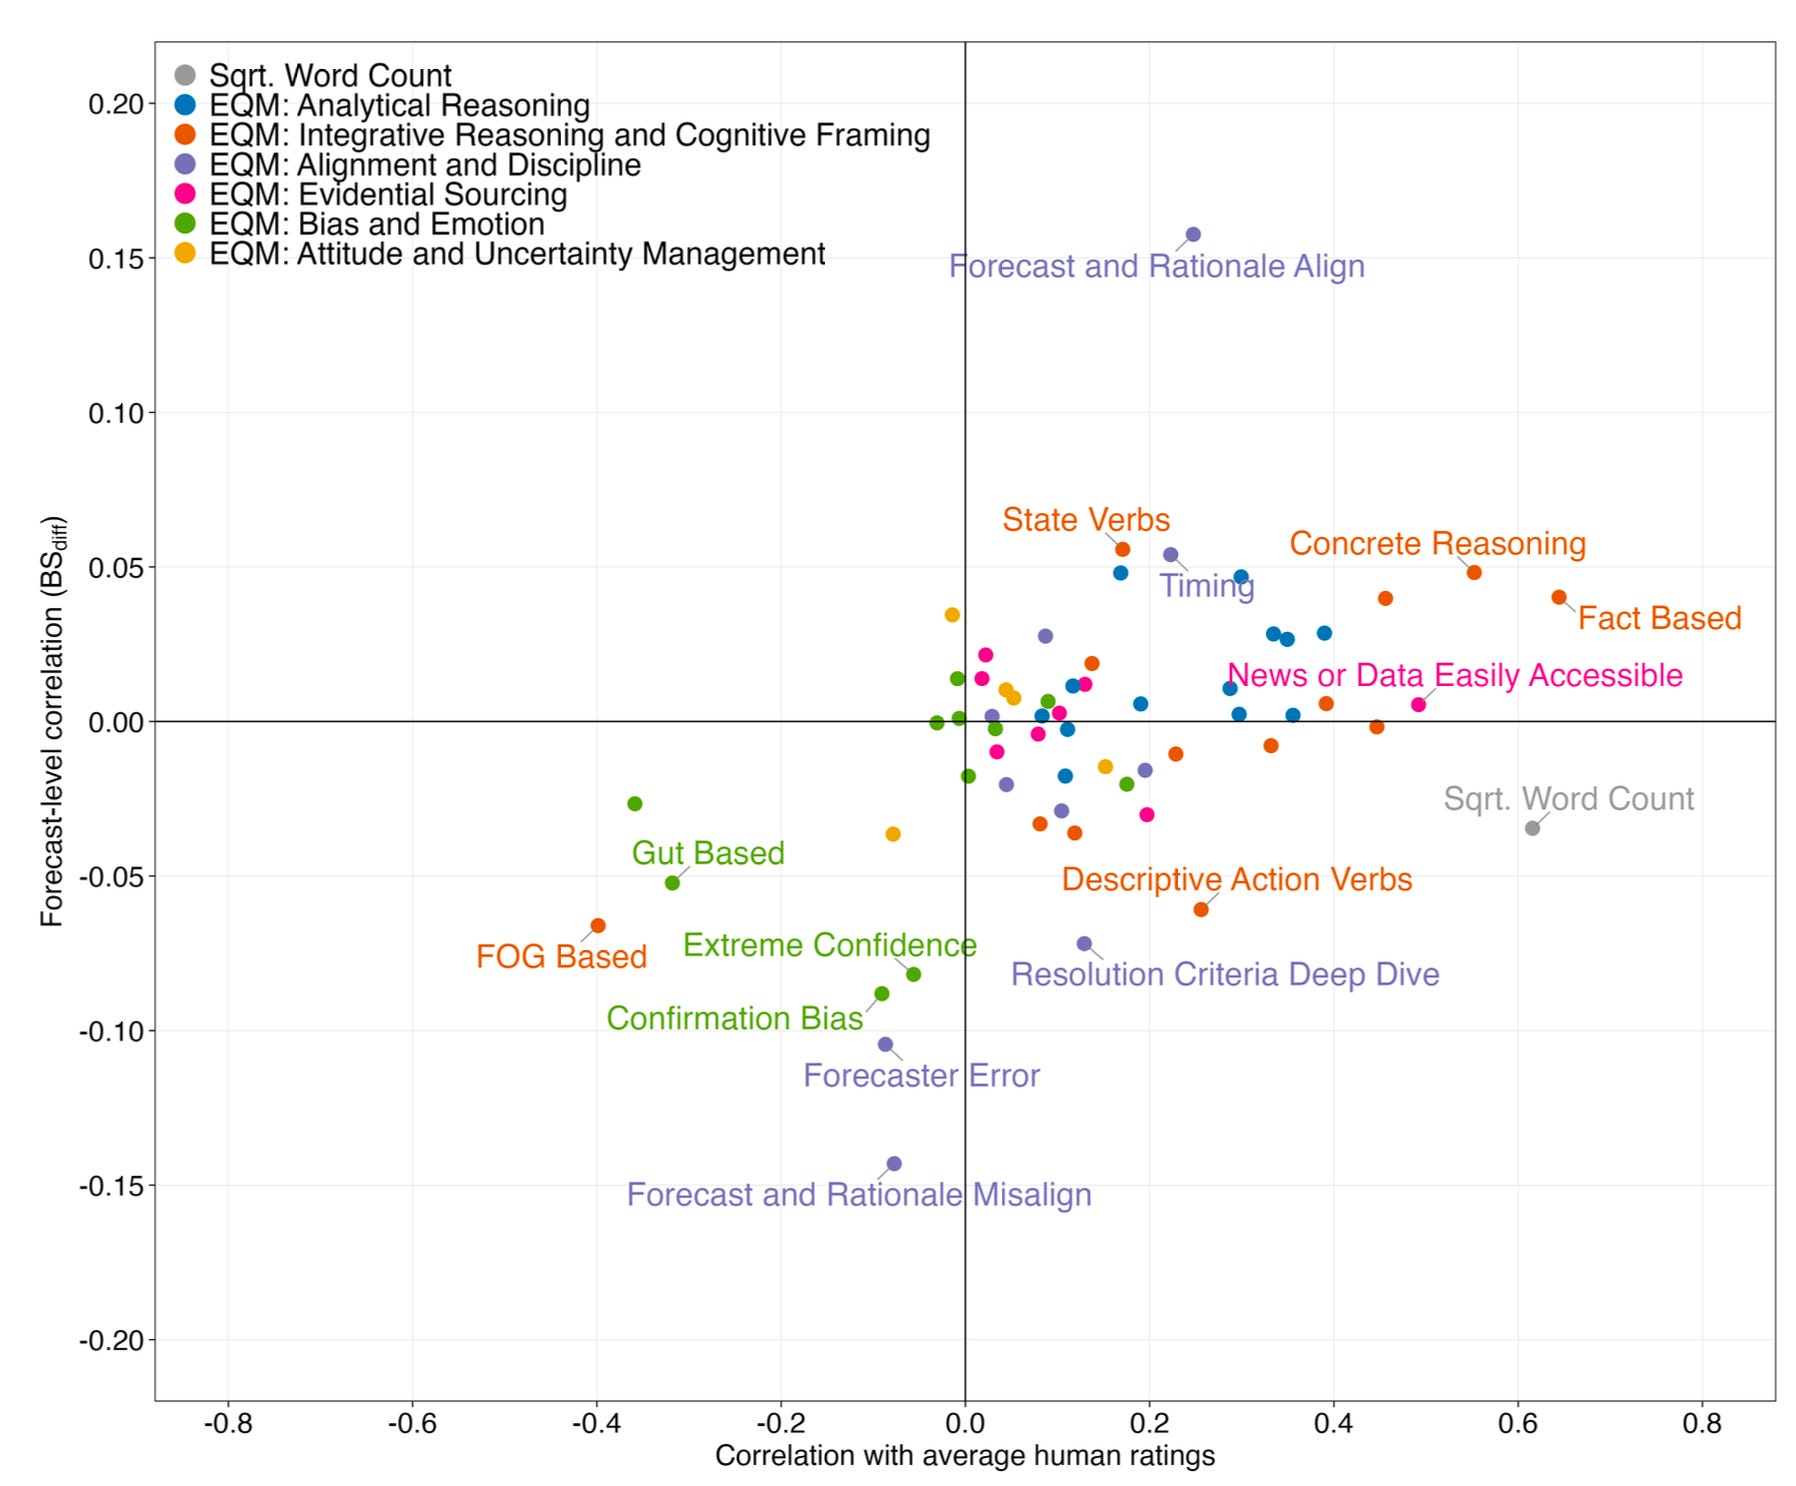
As shown in the figure above, human ratings strongly correlate with rationale length: rationale length correlates with average ratings at r = .62, yet it is essentially unrelated to forecast-level accuracy. Humans also strongly preferred fact-based reasoning (Fact Based). Human raters weren’t wrong directionally, but they appeared to place undue weight on some features. For example, as we show in more detail in the working paper, they underweighted “red flags” such as Extreme Confidence.
In an out-of-sample test (Team Dynamics dataset), human ratings performed similarly well at the forecast level, although they still lagged at the forecaster level. So, the head-to-head performance of EQMs vs. humans at the forecast level appears to be context dependent. As in the ACE dataset, human ratings remained strongly correlated with rationale length.
So, can we spot a good forecast by its rationale? Three findings stand out:
EQMs carry real signal. EQMs predict accuracy, and they beat both older text-analysis tools and (often) humans’ own quality ratings. They do so cheaply, at scale, and from a single written rationale.
EQMs are mostly a screen, not a talent detector. The predictive signal is asymmetric: EQMs flag weak forecasts and forecasters more reliably than they single out the best. We observe the same pattern when EQMs are used for forecast aggregation. Ranking forecasters by their EQM score helps about as much as ranking by past accuracy, while ranking individual forecasts barely moves the needle.
What looks good to humans isn’t always what’s accurate. Human raters tend to reward length and a fact-based tone more than those features deserve, and underweight warning signs such as overconfidence.
Two caveats to keep in mind. First, rationales provide a limited view into the reasoning underlying forecasts. Second, our results are correlational, not causal. The ACE tournament included a randomized experiment in which some forecasters received the CHAMPS KNOW training, a structured program teaching probabilistic-forecasting skills. We use the randomized treatment to check whether the training shifted the EQMs it was meant to target. It did: trained forecasters scored higher on exactly those markers (e.g., Statistical Reasoning, Statistical Causal Blend, and Best Practices). However, the evidence is preliminary, and the training’s effect on forecasting accuracy itself was more mixed.
Nevertheless, the results are encouraging. The written reasoning that already accompanies many forecasts is a largely untapped source of information. EQMs are an exciting new method to begin extracting it.
Read the working paper for the detailed methodology and full results here.
Specifically, they judged how well a given rationale corresponded to the CHAMPS KNOW rubric.
The forecast-level difference is statistically significant; the forecaster-level gap (p = .097) points in the same direction but doesn’t reach conventional significance. The EQM correlations here are computed on the subset of rationales that received human ratings, so they differ slightly from the full-sample figures in the previous section.
No posts
Comments
Nothing yet. Say the first thing.
Sign in to join the conversation.