

Welcome back, Fluenteer! 👋🏻
It’s been a while.
I used to create these listicles weekly, but I haven’t done them in a while. However, there’s been a lot happening recently, and new small-cap and mid-cap companies have entered the first layer of my screener.
Instead of gatekeeping these, I’ll be sharing them with you. I’m not greedy.
Are all these worthy to be added to your portfolio right now? No, they’re not. These companies, however, are very, very interesting and should be monitored closely. These companies all have a unique aspect to them that I’m confident will create outsized returns for patient investors.
Here are six small-cap and mid-cap stocks that I think have the highest probability of providing outsized returns when the time and valuation are right.
Benefit Systems is basically a wellness business, but not in the traditional sense.
They work with employers primarily in Poland but also in countries like Turkey, Slovakia, Bulgaria, Croatia, and Czechia.
Together with these employers, they arrange cards so employees can access gyms, pools, or even yoga classes without having to pay a single dime.
Benefit Systems simply receives a subscription fee for its services and pays the gym or any other facility when the employee swipes their card. The difference between what Benefits Systems has to pay out and what it is receiving in subscriptions goes straight into their own pockets.
This is honestly the oldest trick in the playbook, by playing the middleman.
Top-line growth has been strong, and it accelerated, with revenue jumping 45% in Q1 of 26.
The MAC acquisition did most of the heavy lifting. The Turkish chain added roughly PLN 198M of revenue in the quarter, and strip it out, and growth was 25%. Still very good, just a different story than 45%.
Here’s the thing to watch though. MAC consolidated in May 2025, so 2026 gets the last few months of easy comparison and then it’s done. From next year MAC is part of the base, and that boost disappears from the growth rate entirely.
Which means the growth has to come from somewhere else. More acquisitions, and there will be more, plus 70+ new club openings this year across Poland, Turkey and the smaller European markets. They’ve shown they can do both.
This is the whole game with the owned clubs. Every visit that lands in a Benefit gym instead of a partner gym turns a payment out the door into revenue that stays in the house. Same visit, completely different economics.
Cost per square meter is growing slower than revenue per square meter. That’s the definition of operating leverage, and it’s showing up in the margins right now.
And the shift is real, not just a plan on a slide. Own-club share of visits in Poland went from 68% to 71% in two years. That may not sound like much, but at this scale every point is meaningful, and the number is still climbing.
PLN 764M of free cash flow on an LTM basis against a market cap of roughly PLN 16B. That’s a real yield, and it’s the kind of number that tends to get ignored when everyone is arguing about the capex.
The FCF margin has held between 15% and 21% for a decade. And I mean a full decade, including 2020, when a pandemic shut down every single gym they own. If that doesn’t tell you something about the durability of this model, I don’t know what will.
Cash conversion sits above 100% of net income, and the reason why is the best part of the whole business. Employers pay for the cards upfront, gyms get paid after the visits actually happen. That gap funds the company. Growth here generates cash instead of eating it, and honestly, that’s rarer than most investors realise.
Insider ownership sits at 7.39% in total. Sounds decent until you look at who holds it: 7.06% belongs to one man, Marek Kamola.
Kamola is sitting on 233K shares worth roughly PLN 934M. That’s real money and it moves with the stock every single day. He is properly invested here.
Now take him out of the picture and the whole thing looks different. The entire management board holds 0.33% between them, worth about PLN 44M combined. That is the group actually making the capital allocation decisions, and they own almost none of the company.
The balance sheet more than doubled in eighteen months. Total assets went from PLN 3.4B at the end of 2024 to PLN 7.5B today. That is a company buying things, and we should treat it that way.
Long-term debt jumped from PLN 157M to PLN 1,393M in 2025. This is the PLN 1B bond issue they used to fund MAC, and they raised another PLN 742M in equity on top of it.
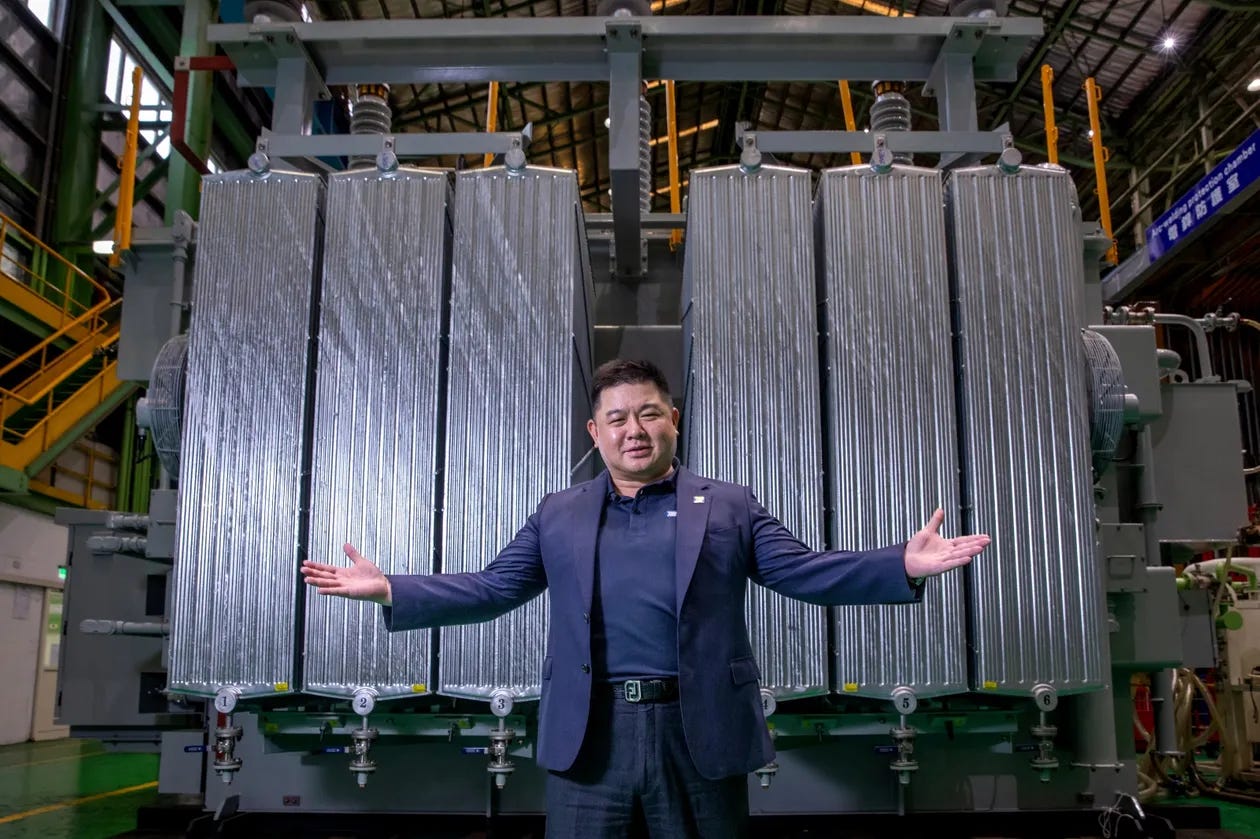
So, Fortune Electric makes the boring stuff.
This is the equipment electricity has to pass through before it can be put to any useful purpose. Transformers, switchgear, that sort of thing. Nobody gives it a thought until the day it stops working.
Their customers are utilities and heavy industry, and now data centers too. That last one is why people are suddenly paying attention. An AI data center needs a huge amount of power delivered reliably, and every one of those megawatts has to pass through equipment like this.
What interests me most is that it’s a picks-and-shovels play on the AI buildout, sitting one layer back from all the semiconductor names everyone already owns. The chips get all the coverage, sure. But those chips don’t run without a grid connection.
Revenue sat between TWD 5.7B and TWD 9.0B from 2016 through 2022, with 2022 down 14%.
2023 broke it open. Revenue jumped 79% to TWD 13.9B, then 45% in 2024 and 21% in 2025 to reach TWD 24.4B. A tripling in three years, remarkable for a transformer manufacturer.
But watch the growth rate. 79%, then 45%, then 21%, now 15% LTM. Still growth, and the deceleration is steep and consistent. Worth monitoring whether it stabilises or keeps sliding.
Ignore the 17.1% CAGR. It blends seven dead years with three explosive ones and describes neither. The real question is whether 2023 was catch-up on grid underinvestment or the start of something structural.
Gross margin went from 16% in 2021 to 42% today. Margins expanding alongside a revenue tripling means pricing power, not cost cutting.
Operating margin went 4% to 22%, net 4% to 19%. That’s unusual for a manufacturer.
Operating margin peaked at 25% in 2024 and sits at 22%. Net peaked at 21%, now 19%. Gross margin still climbing while both roll over, so costs below the gross line are outgrowing revenue.
In 2018 gross margin was 10% and operating margin was 0%. That’s this business with normal demand, and nothing structural has changed about transformers since.
The question: is 42% the new floor or a cyclical peak. Tight industry capacity produces margins like these, and it also invites everyone to build more.
ROIC went from 5% in 2022 to 25% today. ROE went from 22% to 59%. Same story as the margins, same starting point, same year it broke.
ROE at 59% against ROIC at 25% is a wide gap. That spread is leverage, and it’s worth checking the balance sheet before treating 59% as quality.
ROIC peaked at 35% in 2024 and has come down to 25%. Two years of decline while ROE went back up. Returns on the actual capital are falling.
2016-2018 is the reminder. ROIC hit 0%. That’s this business in a normal demand environment.
25% ROIC is still very good. The question is whether it holds when capacity across the industry catches up.
Total assets tripled from TWD 9.9B in 2021 to TWD 29.9B today.
Long-term debt went from TWD 1,202M in 2021 to TWD 554M in 2025. They funded this expansion without borrowing.
Liabilities grew faster than assets, 20.9% CAGR against 17.1%. Equity is now TWD 8.5B against TWD 21.5B of liabilities.
That’s the answer on the ROE gap. Not debt, so it’s payables and customer advances doing the work.
Cash went from TWD 169M to TWD 5,335M in four years.
Worth checking: how much of that TWD 21.5B is customer prepayments. If it’s large, the order book is funding the business and that’s the best thing on this chart.

SHIFT does software testing. That’s the whole business, and in Japan that turns out to matter more than it sounds.
Japanese enterprises have historically built and tested software in-house, badly, with engineers who’d rather be doing anything else. SHIFT took that work off their hands and made it a specialism. They hire non-engineers, train them on a proprietary methodology, and bill them out to fix other people’s code quality.
The model is people. Revenue scales with headcount, and that’s exactly what the numbers show: 25x revenue growth over nine years with gross margin stuck around 30%. Every yen of growth needed another body to deliver it.
They’ve expanded beyond pure testing into broader development and consulting work, and they’ve bought a lot of small firms along the way to get there.
Gross margin has sat between 28% and 35% for nine years. This is a services business with a services cost structure, and scale has barely moved it.
Operating margin bounces between 5% and 13% with no trend. Currently 10%, down from 12% last year.
Net margin the same, 3% to 8%, currently 6%.
That’s the tension with the revenue chart. Revenue up 25x, margins flat. Growth has come from adding people rather than from operating leverage.
Revenue went from JPY 5.5B in FY16 to JPY 140.2B LTM. A 40.6% CAGR over nine years, which is exceptional by any standard.
But the growth rate has collapsed. 68%, 48%, 56%, 53%, 47%, 60%, then 41%, 36%, 26%, 17%, and 17% LTM. Four straight years of sharp deceleration.
FY21 at 60% was the last acceleration. Everything since has stepped down, and the FY25 to LTM move flat at 17% is the first sign it might be finding a floor.
Going from 60% to 17% in four years is a different company. Worth knowing whether that’s the law of large numbers or the end market cooling.
Total assets went from JPY 3.4B to JPY 80.4B. Liabilities grew faster, 41.6% CAGR against 39.7%.
Liabilities are JPY 41.8B against JPY 80.4B of assets, so equity is roughly JPY 38.6B. Still balanced.
Long-term debt is JPY 6.7B, up from almost nothing, and cash is JPY 24.4B. Net cash position.
The liabilities jump from JPY 28.2B to JPY 41.8B in the last two periods is steep. Worth checking what’s in there before drawing conclusions.
FCF went from JPY 60M to JPY 11.4B. FCF margin has moved from 1% to 8%, so cash conversion has genuinely improved even with flat operating margins.
FY24 is the problem. FCF fell to JPY 3.4B and margin to 3%, then rebounded to JPY 14.3B and 11% in FY25.
LTM back down to JPY 11.4B and 8%. The line is volatile enough that no single year tells you much.
FCF margin of 8-11% against operating margin of 10-12% is decent conversion. The volatility is the thing to explain.
Comments
Nothing yet. Say the first thing.
Sign in to join the conversation.