
Markets have a short attention span. At any given moment, capital flows toward whatever story feels most urgent. Today it is artificial intelligence. Yesterday it was EVs. Before that it was crypto, metaverse platforms, and zero-rate growth. Each cycle produces winners, but it also creates blind spots.
One of those blind spots is high-quality businesses that keep compounding quietly while attention moves elsewhere.
Mastercard ($MA) sits squarely in that category.
It rarely dominates financial headlines. It does not promise disruption or radical transformation. Instead, it does something far more valuable for long-term investors: it benefits from the simple fact that money keeps moving, regardless of which trend is in fashion.
After reviewing Mastercard’s latest results and stepping back to look at how the business has evolved over multiple years, the case for Mastercard as a long-term holding into 2026 remains compelling.
A surprising number of investors still misunderstand what Mastercard actually is.
They see it as a “financial company” and instinctively group it with banks. That mental shortcut leads to flawed assumptions about credit risk, leverage, and cyclicality.
Mastercard does not lend money.
It does not hold consumer debt.
It does not take balance-sheet risk the way banks do.

Instead, Mastercard operates the global payments network that connects issuers and merchants. It is infrastructure.
Banks issue Mastercard-branded cards.
Merchants accept those cards.
Mastercard authorizes, routes, and settles transactions across countries and currencies.
For this service, Mastercard collects a small fee on every transaction. Individually, those fees are tiny. At global scale, they create one of the most powerful cash-generating machines in the market.
This distinction matters. Mastercard’s revenue grows with spending volume, not loan books. That difference explains much of the company’s resilience across economic cycles.
What makes Mastercard exceptional is not just what it does, but how it does it.
As global spending rises through inflation, population growth, or increased digitization, Mastercard benefits automatically. Unlike capital-intensive businesses, it does not need to build new factories or extend large amounts of credit to grow.
Once the network is in place, additional volume flows through at minimal incremental cost.
Mastercard’s cost structure is largely fixed. Security, compliance, and network infrastructure are expensive to build but cheap to operate at scale.
This creates operating leverage. When revenue grows, profits grow faster. Over time, this dynamic becomes visible in expanding and consistently high margins.
Mastercard’s network touches consumer purchases, business travel, online subscriptions, remittances, and B2B payments. This diversity helps stabilize results and reduces reliance on any single economic driver.
One of the simplest ways to understand a business like Mastercard is to stop listening to quarterly narratives and instead follow the money over time.
Below is a screenshot from the Finorify app, showing Mastercard’s annual revenue progression over the past decade.
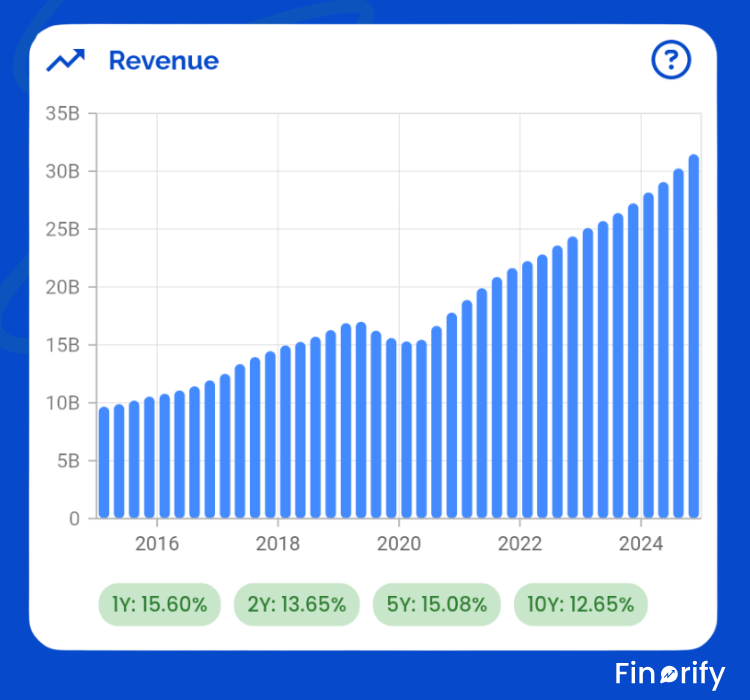
What immediately stands out in this chart is not just growth, but consistency.
Starting from roughly $9 to $10 billion in revenue around 2015, Mastercard steadily expanded year after year. The bars rise almost mechanically, reflecting a business that benefits from structural tailwinds rather than cyclical luck. Even periods of economic uncertainty show up not as permanent damage, but as brief pauses before growth resumes.
The most obvious interruption appears around 2020, when global spending and travel slowed sharply. Revenue temporarily dipped as cross-border transactions collapsed. But what matters more than the dip itself is what followed. As soon as spending normalized, revenue did not just recover, it accelerated. By 2022 and beyond, the chart shows Mastercard moving decisively into a new revenue range, eventually exceeding $30 billion annually.
This is the power of Mastercard’s model, visualized.
What makes this chart especially compelling is the growth rate consistency displayed beneath it. According to Finorify’s calculations:
1-year revenue growth: ~15.6% YoY
2-year revenue growth: ~13.7% YoY
5-year revenue growth: ~15.1% YoY
10-year revenue growth: ~12.7% YoY
These are not one-off spikes. They are sustained, multi-year growth rates across vastly different economic environments. Inflation, recessions, rate hikes, pandemics, and recoveries all come and go, yet Mastercard continues to compound at low-to-mid double-digit rates.
The reason becomes clear when you connect the chart back to the business model:
As nominal spending rises due to inflation, Mastercard benefits.
As economies grow, Mastercard benefits.
As cash usage declines and digital payments expand globally, Mastercard benefits.
The revenue chart is essentially a visual representation of money moving through the global economy and Mastercard taking a small cut of nearly every transaction.
This is why long-term investors care far more about charts like this than about individual quarterly beats or misses. When revenue trends look this smooth over ten years, it usually signals a business with durable pricing power, embedded infrastructure, and very few realistic threats.
If you want to explore this chart interactively, toggle timeframes, or compare Mastercard’s revenue growth directly against other high-quality compounders, this exact visualization is available inside the Finorify app. Seeing these trends laid out visually often makes the long-term story much clearer than reading earnings headlines ever could.
Revenue growth tells you where a business is going. Profitability tells you how strong it is while getting there.
Below is a screenshot from the Finorify app showing Mastercard’s operating margin over time.
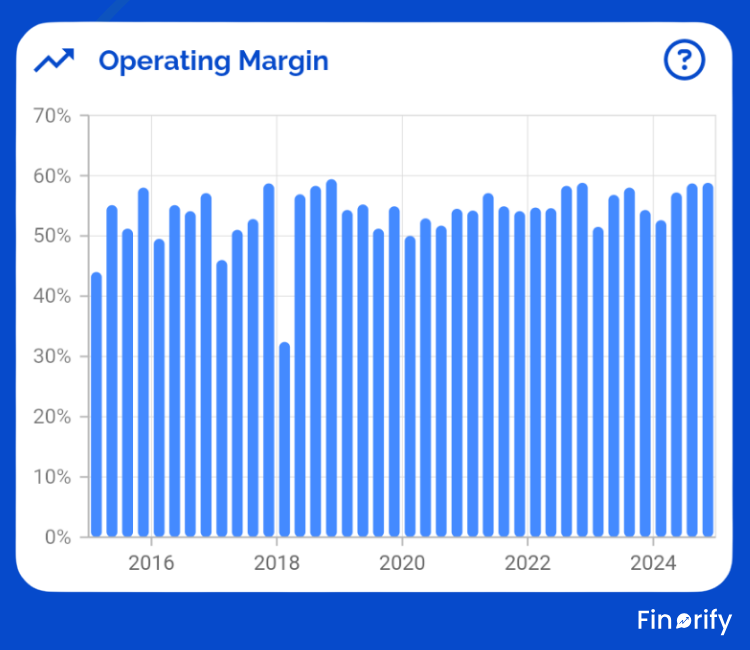
At first glance, what stands out is how consistently high these margins are. For most of the past decade, Mastercard’s operating margin has lived in a remarkably tight range, generally between 50% and 60%. Very few global businesses, outside of pure software monopolies, operate at these levels for this long.
There is one visible disruption around 2018, where margins briefly drop sharply. This was not a collapse in the business model, but a one-off regulatory and accounting adjustment tied to European interchange and network settlements. What matters is what happens next. Margins rebound quickly and return to their historical range, reinforcing that this was an external shock, not a structural issue.
From there, the chart tells a powerful story. Even through periods of rising inflation, higher wages, increased compliance costs, and global uncertainty, Mastercard’s operating margins remain stubbornly high. In recent years, they again push toward the upper end of the range, approaching 58 to 59%.
This stability is not accidental.
Mastercard’s cost structure is largely fixed. The network, security systems, compliance infrastructure, and global processing capabilities are expensive to build, but once in place, processing additional transaction volume costs almost nothing. As revenue grows, incremental dollars fall disproportionately to the bottom line.
This is operating leverage in its purest form.
What makes this chart especially compelling is what you do not see: no long-term margin erosion, no steady compression from competition, and no evidence that scale is working against the business. Instead, the operating margin chart looks more like a controlled system than a cyclical business.
For long-term investors, this is exactly what you want to see. High margins are impressive, but sustainably high margins over a decade signal a deep moat. They suggest strong pricing power, regulatory barriers, trusted infrastructure, and network effects that are extremely difficult to replicate.
If you explore this chart inside the Finorify app, you can see how rare this margin profile truly is when compared to other large financial and technology companies. Seeing profitability displayed this way makes it clear that Mastercard is not just growing, it is doing so with extraordinary efficiency.
This is why profitability, not just growth, is what ultimately tells the real story.
If revenue shows the scale of the business and operating margins reveal its efficiency, earnings per share tells the story of what actually accrues to shareholders.
Below is a screenshot from the Finorify app showing Mastercard’s EPS progression over the past decade.
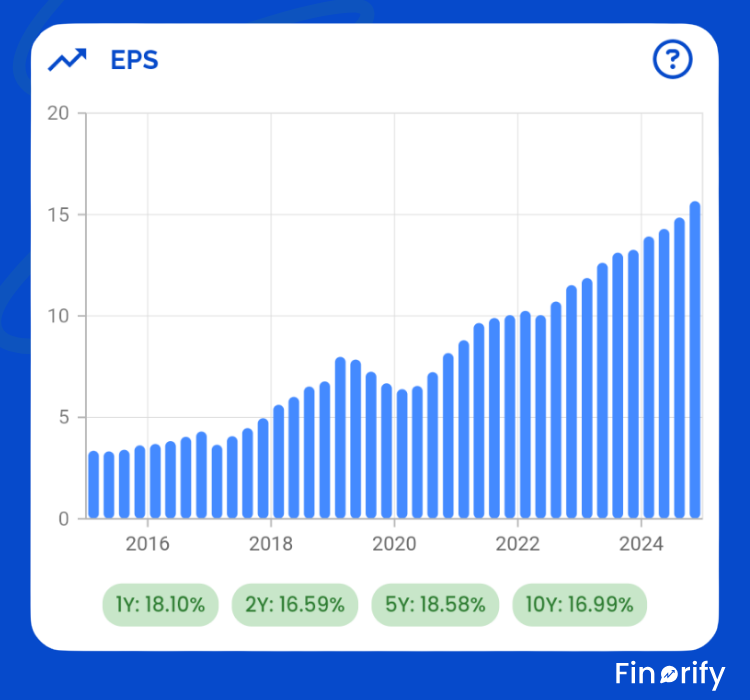
What stands out immediately is the smooth, upward trajectory of earnings per share over time. EPS rises from roughly $3 in the mid-2010s to more than $15 today, a more than five-fold increase.
There is a visible dip around 2020, reflecting the temporary collapse in travel and cross-border spending. But just like the revenue chart, the recovery is swift, and EPS not only rebounds but pushes decisively to new highs.
The key reason for this acceleration is Mastercard’s buyback strategy.
Mastercard generates far more cash than it needs to operate the business. Rather than letting that cash sit idle or chasing risky acquisitions, management consistently returns it to shareholders by repurchasing shares. Each buyback reduces the total share count, which means future profits are divided among fewer shares.
This is where the flywheel effect kicks in:
Revenue grows
Margins stay high
Free cash flow accumulates
Shares are repurchased
EPS grows faster than the underlying business
The growth rates displayed beneath the chart in Finorify make this especially clear. Earnings per share have compounded at roughly 17 to 18% annually over the past 1, 2, 5, and even 10 years. Sustaining that level of per-share growth over a full decade is extremely rare for a company of Mastercard’s size.
What makes this even more powerful is how EPS behaves during tougher environments. Even when revenue growth temporarily slows, buybacks help keep per-share earnings moving higher. This reduces volatility for long-term shareholders and reinforces the compounding effect.
If you explore this EPS chart interactively inside the Finorify app, you can clearly see how much of Mastercard’s shareholder returns come not just from growth, but from intelligent capital allocation. Over time, this buyback flywheel turns a great business into an exceptional long-term investment.
One of the biggest traps in modern equity analysis is taking free cash flow at face value.
Many companies proudly report strong cash generation, but when you look closer, a large portion of that “cash” is quietly offset by stock-based compensation. In practice, this means shareholders are paying employees with dilution while being told the business is generating excess cash.
Mastercard stands out very clearly when you visualize this relationship.
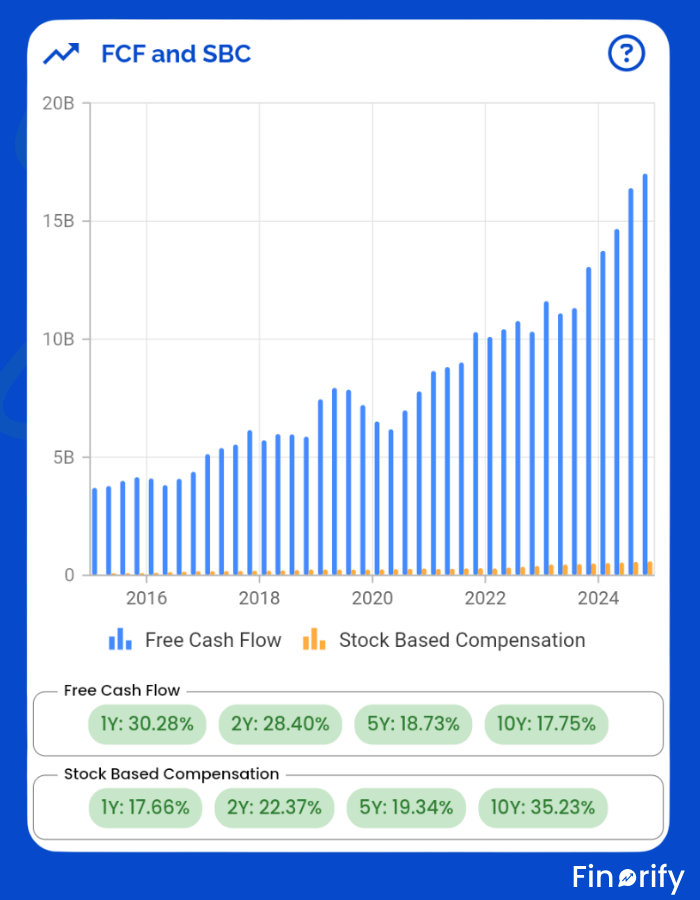
The chart above is a screenshot from the Finorify app, showing Mastercard’s free cash flow (blue bars) alongside stock-based compensation (orange bars) over time. Seeing these two metrics together is critical, because it immediately answers a simple but important question: how much of the company’s cash generation actually belongs to shareholders?
Over the most recent year, Mastercard generated roughly $13.5 billion in free cash flow, while stock-based compensation came in at around $510 million. That puts stock-based compensation at less than 4% of free cash flow.
Visually, the contrast is striking. Free cash flow has grown steadily and meaningfully over time, while stock-based compensation remains a small, controlled component rather than something that scales aggressively with revenue.
This is exactly what high-quality cash generation looks like.
The implication is important. Mastercard is not funding growth by issuing large amounts of equity to employees. Instead, the cash produced by the business is genuinely excess cash. It can be returned to shareholders through dividends and buybacks, or used selectively for strategic investments, without eroding ownership.
This is one of the reasons Mastercard’s capital return story is so consistent. When you combine strong free cash flow with disciplined stock-based compensation, buybacks become truly accretive rather than cosmetic.
Charts like this are why I prefer to analyze fundamentals visually. Numbers in isolation can look fine on paper, but when you put cash flow and dilution side by side, the quality of the business becomes immediately obvious. This type of comparison is exactly what Finorify is designed to surface at a glance.
Strong earnings and cash flow matter, but they become far more powerful when paired with a resilient balance sheet. This is especially important during periods of economic uncertainty, when access to liquidity and manageable leverage can determine how a company navigates stress.
Mastercard’s balance sheet adds another layer of confidence to the long-term investment case.
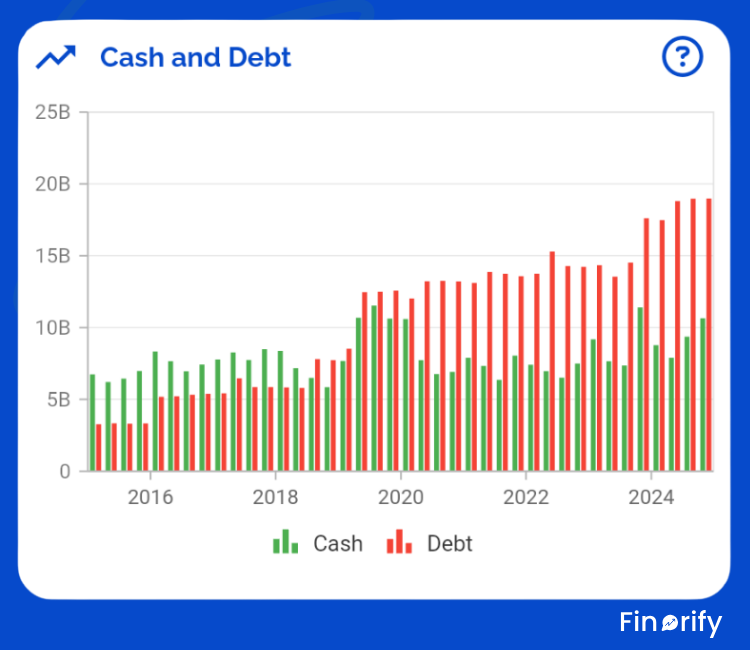
The chart above is a screenshot from the Finorify app, showing Mastercard’s cash position (green bars) alongside its total debt (red bars) over time. Looking at these two metrics together provides immediate context. It shows not only how much debt the company carries, but whether that debt is supported by sufficient liquidity and cash-generating power.
As of Q3 2025, Mastercard held approximately $10.6 billion in cash and cash equivalents, compared to around $19 billion in debt. On its own, that debt figure might appear sizable. In context, however, it is extremely manageable.
What the Finorify chart makes clear is that Mastercard has consistently maintained a strong cash buffer while allowing debt to rise in a controlled, deliberate way. Debt has primarily been used to optimize capital structure and fund shareholder returns, not to plug operational holes or finance risky growth.
This is reflected in Mastercard’s net debt to EBITDA ratio of roughly 0.4x, a level that would be considered conservative in almost any industry. In practical terms, the company could cover its net debt with roughly half a year of free cash flow.
That flexibility matters. It means Mastercard can continue investing in its network, repurchasing shares, and paying dividends without being forced into defensive decisions during economic slowdowns. It also means the company is not dependent on favorable credit markets to sustain its strategy.
Seeing cash and debt side by side over time highlights an important distinction. This is not a balance sheet under pressure. It is a balance sheet that supports long-term compounding while leaving room for uncertainty.
This kind of visual context is difficult to capture with isolated balance sheet figures. Charts like this are why I prefer reviewing fundamentals inside Finorify. When liquidity and leverage trends are visible at a glance, it becomes much easier to assess whether financial risk is increasing or quietly staying under control.
The most compelling part of the Mastercard story is not what the company has already achieved. It is the set of long-term forces quietly working in its favor, many of which are still in relatively early stages.
These are not trends that explode overnight or dominate headlines. They unfold slowly, often invisibly, but once in motion they are very difficult to reverse. Mastercard happens to sit at the intersection of several of them.
In developed markets, it is easy to assume the transition away from cash is already finished. Contactless payments, mobile wallets, and online commerce are part of daily life. But globally, this view is misleading.
Large parts of Latin America, Africa, Southeast Asia, and parts of Eastern Europe still rely heavily on cash. Even small improvements in payment infrastructure in these regions can result in meaningful increases in digital transaction volume. Every incremental shift from cash to card or digital wallet expands Mastercard’s addressable volume without requiring a change in consumer behavior beyond convenience.
Importantly, this shift tends to be structural rather than cyclical. Once consumers and merchants adopt digital payments, they rarely go back.
The front end of payments continues to evolve. Consumers tap phones, use wallets, subscribe to services, and increasingly pay with one-click experiences. This constant innovation can create the illusion that card networks are becoming less relevant.
In reality, the opposite is often true.
Behind many of these experiences, Mastercard remains embedded as the settlement layer. Whether the interface is a physical card, Apple Pay, a BNPL solution, or an online checkout flow, the underlying transaction frequently still runs on Mastercard’s rails. The consumer brand may change, but the network keeps getting paid.
This separation between front-end innovation and back-end infrastructure is a powerful position to occupy.
Cross-border payments benefit from two parallel trends. The first is digital globalization. Streaming services, software subscriptions, online marketplaces, and international services continue to expand beyond national borders. The second is physical mobility. Travel, migration, and international business activity remain long-term growth drivers.
For Mastercard, this matters because cross-border transactions typically generate higher fees than domestic payments. As a result, even modest increases in cross-border volume can have an outsized impact on revenue and margins.
Over time, this creates a natural mix shift toward higher-quality revenue.
There was a period when fintech was widely viewed as an existential threat to traditional card networks. That narrative has largely faded, and the reason is simple.
Building a global, trusted payment network is extraordinarily difficult.
Most fintech companies choose not to replace Visa or Mastercard. Instead, they build on top of them. Neobanks, corporate card startups, embedded finance platforms, and expense management tools all rely on existing card infrastructure to scale quickly and reliably.
Each new fintech product that gains adoption often becomes another source of transaction volume for Mastercard. Innovation at the edges strengthens the core rather than eroding it.
Artificial intelligence is currently one of the most crowded investment narratives in the market. For many companies, AI represents a massive capital commitment with uncertain returns.
Mastercard approaches AI differently.
Rather than building foundational models or competing in infrastructure, it uses AI as an internal efficiency tool. Fraud detection, transaction monitoring, network optimization, and risk scoring all benefit from better data and smarter algorithms.
The result is higher efficiency, better security, and improved margins without the need for massive capital expenditure. AI enhances the network instead of redefining it.
What ties all these tailwinds together is their pace.
They do not move quickly enough to generate hype. They do not produce dramatic quarter-to-quarter surprises. But over multi-year periods, they steadily increase transaction volume, improve revenue mix, and reinforce Mastercard’s competitive position.
This is the kind of environment where compounding thrives.
Owning Mastercard is not about predicting the next earnings report or timing short-term market rotations. It is about owning a piece of global financial infrastructure.
This is a business that benefits from economic activity itself rather than specific consumer preferences or technology cycles. It does not need to guess which app, device, or payment interface will win. As long as people and businesses continue to transact digitally, Mastercard remains embedded in the system.
That embedded position is what makes the business so resilient. It quietly participates in growth without requiring constant reinvention or speculative bets.
For this reason, Mastercard fits naturally as a long-term core holding rather than a short-term trade. It is designed to be held, not timed.
Mastercard combines a set of qualities that are difficult to find in a single business.
It benefits from global growth and inflation without taking on consumer credit risk.
It generates software-like margins at global scale.
It produces consistent, high-quality free cash flow.
It returns capital to shareholders with discipline and restraint.
When viewed through this lens, Mastercard is less about excitement and more about durability. It is the kind of business that compounds quietly while attention moves elsewhere.
For investors who want to understand these fundamentals visually, track how they evolve over time, and compare Mastercard with other high-quality compounders, this is exactly the type of analysis Finorify is built for. Seeing the full picture often leads to better long-term decisions than reacting to short-term market noise.
No posts
Comments
Nothing yet. Say the first thing.
Sign in to join the conversation.