
For me, understanding what has come before helps to (1) understand the sustainability of the current regime, (2) understand the instability of the current regime and (3) project forward.
We start with a simple flow of funds model can help us to understand the changes happening in the economy.
The flow of funds model is derived from the idea that the sources of funds in the economy roughly equals the uses of funds. The rates of changes of sources and funds roughly balance out.

Once the mRNA vaccines proved effective at guarding against severe illness, spending shot up by 25% year-over-year. Spending normally increases by around 3-5% per year. This unnatural rate of spending was financed largely from one overall source: central banks printing money and the government handing this money over to citizens.
As spending grew faster than our ability to supply the goods and services demanded, inflation rose. As inflation and spending rose, so did incomes.
Not all the money the government handed over was spent. Because a lot of the world continued to work remotely while locked down, much was saved.
The economy was running at full tilt during the Covid recovery. The direction and length of the arrows represent the size and direction of the rate of change:

In the following economic phase that we’ve just lived through, things started to get interesting. Historic relationships that held true for the last 50 to 60 years didn’t hold true in this cycle.
To fight inflation, central banks started to tighten monetary policy. As the cost of living went up and wage growth rates went down, savings were drawn down to support spending. This unique circumstance allowed spending growth to exceed the sum of credit and income growth.
Savings were also the cause of another unique circumstance during this cycle. As the Fed raised interest rates and reduced reserves, financial assets could still rise. This is because the stock of savings was drawn down and invested into both cash and financial assets. The stock of savings has been so big that it helped to support the economy and financial assets:
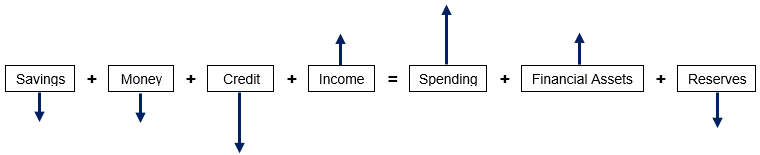
Financial assets could go up for a few reasons. The first reason, mentioned earlier, is that consumers and businesses, armed with excess cash and savings, bought financial assets. The second reason is because even though short-term interest rates went up, their impact on the economy was mild because much of the private sector had already fixed their interest rate exposures. The government took the large majority of the hit.
The third reason is because not all tightening is created equal. As we mentioned in our previous note, the liquidity drain from the Fed’s quantitative tightening process was having very little impact on the economy. As the Treasury issued short-term T-bills, net bond issuance declined substantially. There were enough buyers of long-term interest rate products to keep interest rates low.
The fourth reason is linked to the idea that not all tightening is created equal. Because the Treasury was issuing into short tenors, the money the Fed was taking out of the system came almost entirely from its reverse repurchase facility. The users of this facility simply switched out of reverse repo agreements with the Fed and into T-bills. This switch was easy because the two products have similar characteristics. The Fed’s quantitative tightening simply resulted in a smaller reverse repo facility. There was basically no tightening impact on the economy.
Not all tightening is created equal. Removing one dollar of income through a tax hike will have a much bigger impact on spending than removing one dollar of excess money at the Fed’s reverse repo facility.
While rising interest rates have had an impact on certain segments of the economy (home construction, car purchases and consumer credit in particular) like they always have, the impact was largely offset by (1) consumer savings, (2) the ability of the consumer to continue to borrow on their credit card because they paid so much off over Covid, (3) rising wage growth and (4) continued fiscal stimulus.
These circumstances were unique to this cycle. While credit has contracted like in past cycles, it didn’t lead to a decline in spending in this one. Financial assets were able to rise despite the tightening because there was enough savings to be directed into both cash as well as equities. At the same time, the sheer quantum of savings could support 3-4% spending growth despite the fastest interest rates in modern history and one of the largest costs of living increases in decades.
The natural question to ask is how sustainable is this arrangement? How long can it last for?
I think the current system is sustainable for quite some time yet. The reason is because the drags that are now operating on the economy are too small compared to supports.
Consider the following. We had one of the largest increases in the cost of living in post-World War II history and one of the fastest interest rate rises during that time too, but the savings pile still remains elevated in the US:
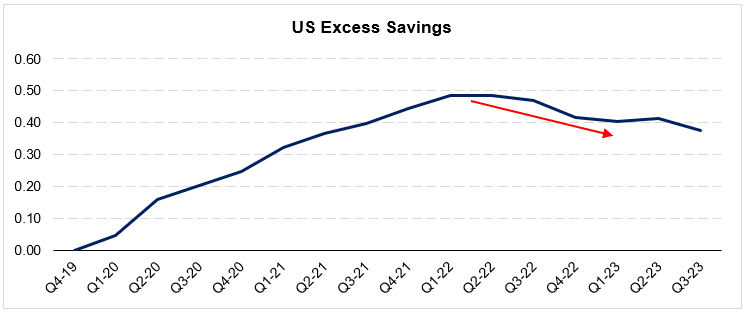
The increase in rates and cost of living resulted in about a 10% decline in excess savings, as represented by the red line in the chart above. Once the rise in commodity prices and supply chain issues ran its course, however, the decline in savings plateaued and income growth alone could support 3-4% nominal spending growth without the need to dip into savings. Savings plateaued.
One of the reasons we believe the current regime is sustainable is because the level of excess savings in the US economy remains elevated, and the rate of drawdown remains quite slow. In the last 6 months, excess savings have only fallen by around 2.4%. There’s still a lot of buffer to support spending.
The second reason we believe the current regime is sustainable for some time yet is because the impact from the Fed’s quantitative tightening program won’t be felt for another year. Not all reserve drain is equal. Draining reserves when there are none left will have a much bigger impact on the economy and financial system than simply draining money from the Fed’s reverse repo facility:
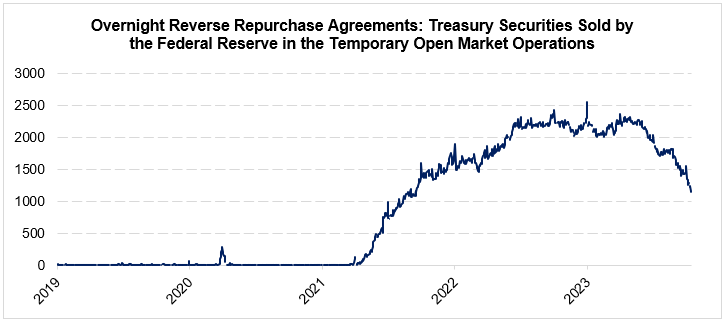
The money in this facility is basically money which doesn’t know what to do with itself. It’s excess money that doesn’t support any economic activity. From the chart above, the Fed has now drained around half of it, or $1.2 trillion so far. But there’s another $1.2 trillion to go and it will take at least another year to drain. Thereafter, the reduction in money supply will start to have a significant impact on the economy through the financial system.
But there’s one new force working now to slow the economy. As described in our previous note, this force has been the rise in bond yields. The rise is being driven by the Treasury’s large long-term issuance requirements and the mismatch between the short-term interest rate products demanded by the excess liquidity the Fed created versus the sale of longer-dated Treasuries under its quantitative tightening program.
While it will work to slow the economy, by our estimates, we think the impact will be slow and gradual. The large majority of borrowers locked in low rates when 10-year yields were near 1%. It was the Federal Reserve that, in effect, took the other side of this risk. Although large, the Fed can wear this mark to market loss through accrual accounting techniques.
And so, in our view, we believe the current economic regime can be sustained for some time yet. The central features that support the economy despite the moves higher in long-term interest rates are: (1) the consumer’s healthy savings stockpile and (2) only a small impact from the Fed’s quantitative tightening program.
The problem is that, while supporting the economy, the huge stockpile of savings is also supporting inflation. Inflation looks sticky to us at around 3-3.5%, which is too high for comfort.
Eventually, either income growth starts to accelerate to support more nominal spending growth and inflation rises, necessitating more Fed action, or inflation falls back to target because of a much weaker economy. Our judgment is that much weaker levels of wage growth are required for inflation to fall from here. And much weaker levels of wage growth will require much weaker levels of economic activity. For the time being, though, the system can sustain itself.
Until higher interest rates and money withdrawal creates an unsustainable situation, we think the next phase of the economy will likely look like the following:

Once the supports to the system are exhausted, then we think we’ll start to see a more traditional downturn:

But, as explained above, we’re still a while away from this situation yet.
No posts
Comments
Nothing yet. Say the first thing.
Sign in to join the conversation.