
We are back with another update on the precious metals complex, in the thick of the Summer Doldrums. This is a seasonally weak period for gold, silver, and the PM stocks, are often where an intermediate-term bottom will be plumbed and then pricing will start the climb back higher again in later summer and into a fall rally.
While the corrective action has been in place for the last 5-6 months in this sector, it really feels like sentiment has gone from disbelief to apathy to despondency coming into the second half of 2026; after starting the year in a euphoric fervor to all time highs.
Nothing goes down in a straight line though. It’s quite possible that we have hit peak pessimism, and peak Summer Doldrums frustration from resource investors.
This is the perfect environment for people’s recency bias to throw them off the trail of the longer-term trends in place.
This kind of souring sentiment and lack of participation as metals and mining stocks hit new recent lows, is the exact kind of environment that exhausts the selling, brings in fresh buying from the sidelines, and that can build the energy for the next rally higher again in the longer-term secular bull market.
In this article we’ll check in the technical price action in gold, silver, and the precious metals stocks, analyze seasonal data, and consider the fundamental patterns of newsflow in the sector as a potential sea change on the horizon.
So, let’s get into it…
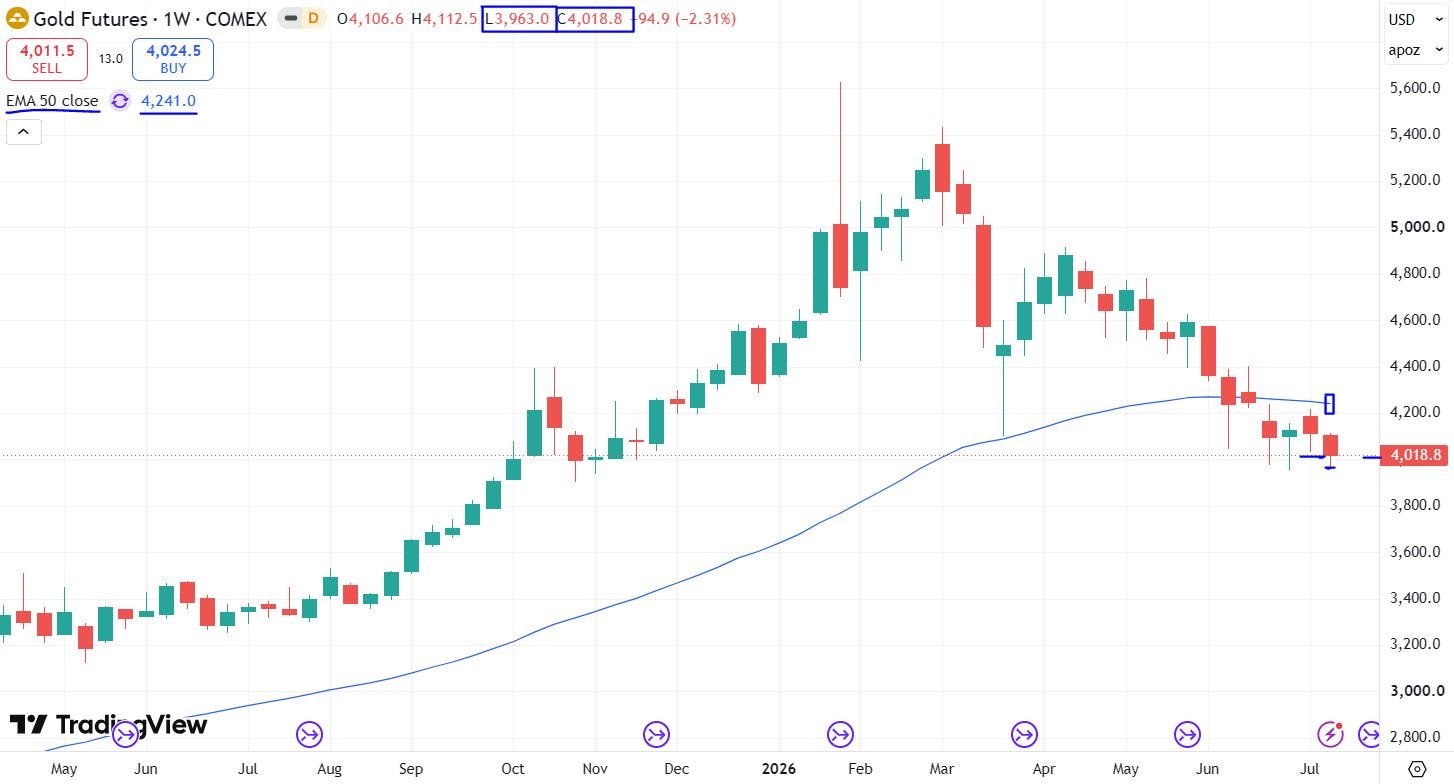
Gold futures price made a new “lower low” weekly close on Friday at $4,018.80. That is still a bearish technical signal.
Pricing hit an intra-week low of $3,963.00, which was still slightly above recent prior low from 2 weeks ago at $3,955.40. It’s good that a new intra-week low was not tagged, but the lower weekly close has more gravity.
Gold prices remain down below the 50-week Exponential Moving Average (EMA) - currently up at $4,241; keeping the yellow metal in a mildly bearish posture recently.
Gold bulls will want to see pricing get back above the 50-week EMA to regain a more bullish posture once again.
While the corrective pricing action for the last 5-6 months has been bearish in nature, it is still within the context of a longer-term uptrend; with pricing still well above the 200-week EMA, currently down at $3,148.50.
A break below the 200-week EMA would shift even the long-term posture for gold to bearish, but this seems far less probable, with so much underlying lateral price support on the weekly chart around $3,900 and $3,650.
One constructive thing we can say about the Gold futures price is that it still closed the week above the $4,000 key psychological support level, and has not closed down below that on a weekly basis thus far.
There seems to be a steady bid for gold coming in right under that level.
Again, there more underlying lateral price support around $3,900 and $3,650.
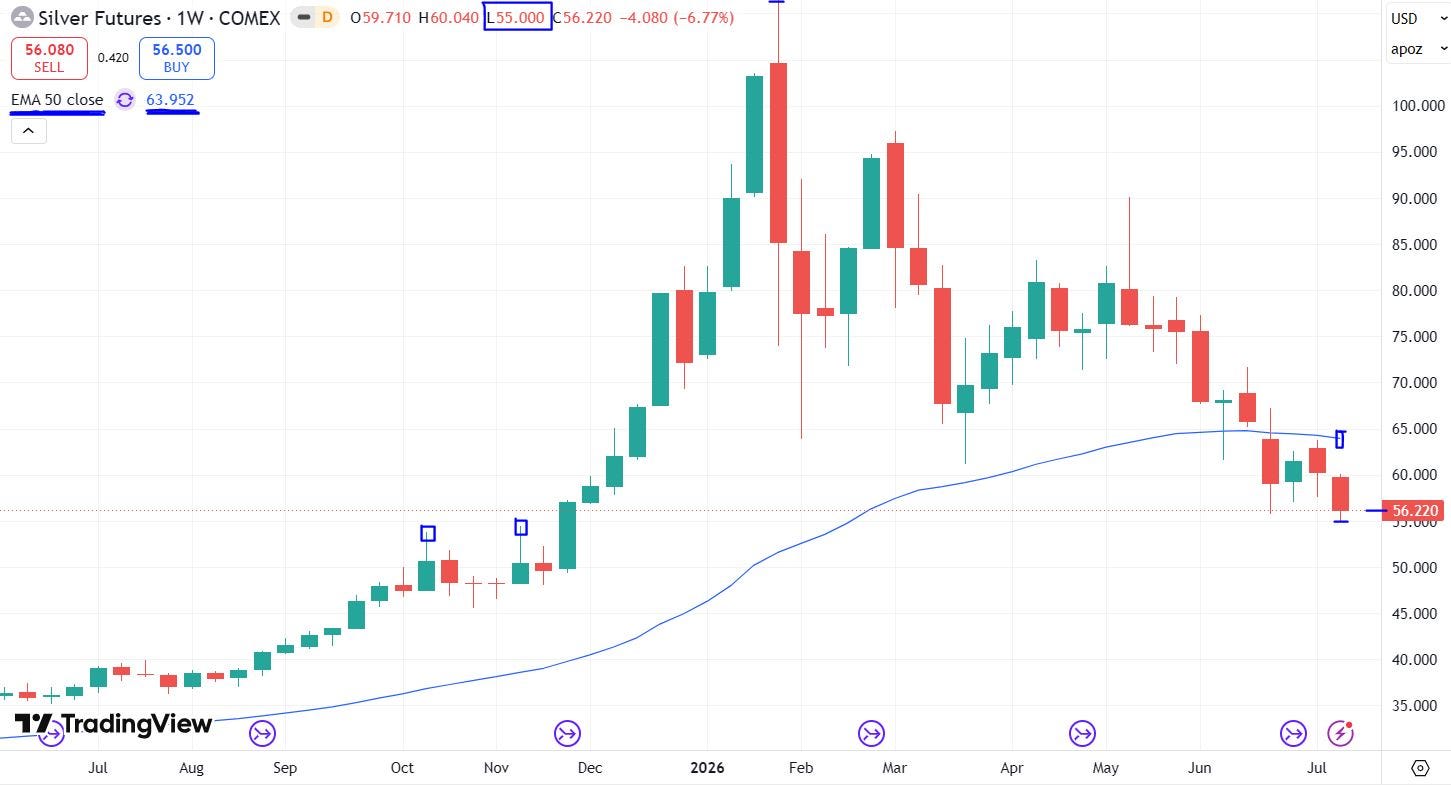
Silver futures price made a new “lower low” this week at $55.00, before closing the week at $56.22. Pricing hit a slightly lower level than recent prior low from 3 weeks ago at $55.695. A pattern of lower lows is another bearish technical signal, and silver bulls will want to see that pattern stop and reverse itself.
Silver prices over the last 4 weeks have remained down below the 50-week Exponential Moving Average (EMA) - currently up at $63.95; keeping silver in its bearish posture recently.
Silver bulls will want to see pricing get back above the 50-week EMA to regain a more bullish posture once again.
While the corrective pricing action for the last 5-6 months has been bearish in nature, it is still within the context of a longer-term uptrend; with pricing still well above the 200-week EMA, currently down at $42.65.
A break below the 200-week EMA would shift the long-term posture for silver to bearish, but this seems far less probable, with so much underlying support at $54, $50, and $48.
One constructive thing we can say about the Silver futures price is that it is still above the next key support at the $54 level on the daily and weekly charts.
This is lateral price support level, that is formed by the prior peaks from last October (peak at $53.76) and November (peak at $54.41). What was initially resistance last Autumn has now become support this Summer.
Should that $54 level be broken on a daily/weekly basis, then it brings back into focus the large round psychological $50 support level, which was also the nominal price ceiling for 45 years (from 1980-2025).
There should be a large supply of buyers that would come in roughly around that key $50 level, along with a large supply of silver bears that would cover their short positions around that area.
A back-test of the $50 break-out price would be quite normal, but silver bulls will not want to see that level breached strongly to the downside.
Below $50, there is some modicum of support around $48.22-$48.25.
Many gold and silver producers have already started to report solid production and operational metrics for the prior quarter (and first half of the year). It is quite a strange dichotomy to see how well the PM miners are doing fundamentally, and yet see how much they’ve corrected down in share price and market cap in tandem.
One thing that may change up that pricing trend lower in the coming weeks and months is when all the gold and silver producers start reporting their Q2 earnings, and when they give guidance for H2 2026.
Q2 earning season kicks off next week with that largest and most followed gold producer, Newmont Corp (NEM), reporting earnings at market close on July 23rd.
The market reaction to Newmont often sets the tone for earnings season, although they are notorious for under-delivering or having some metric miss in production, costs, or guidance that then gets investors and analysts all riled up.
While Q2 won’t be as robust as Q1, most participants still anticipate it being quite profitable for Newmont, and really all the gold producers.
Often resource investors will counterbalance the Newmont news against the best-run and 2nd largest gold producer, Agnico Eagle (AEM); reporting the week thereafter on July 29th.
Their costs have traditionally been lower, while production growth has been more constructive - so I anticipate (AEM) will still report a very lucrative Q2.
In full disclosure I don’t have a position in either Newmont or Agnico Eagle, because they are too large, too widely followed, and don’t offer the kind of alpha or torque that the mid-tier and small producers do.
That doesn’t change the fact that each earnings season most sector specialist interviews and newsletter writers will endlessly pontificate on both (NEM) and (AEM) earnings and guidance to paint those points across the whole gold sector. Sometimes this causes investors to miss the rest of the gold producer forest for the 2 big trees up front though, because I remember plenty of times where Newmont disappointed but the mid-tier and small producers still blew it out of the water.
Additionally, those 2 sector bellwethers have outsized weightings in the (GDX) ETF, with Newmont at 10.66% and Agnico Eagle at 9.94% at present.
As a result of those 2 stocks making up over 20% of the (GDX), they tend to have a disproportionate effect on the sector overall, as well as investor sentiment in the space. It is quite similar to how huge MAG-7 stocks like Nvidia (NVDA) and Apple (AAPL) skew the S&P 500 weighted indexes.
I’m still fairly optimistic that we may see some upside surprises and earnings beats from these Q2 earnings reports as they start to come in. The average metals prices weren’t as high as Q1, but they were still the 2nd highest average quarterly prices of all time.
Gold Q2 average quarterly price estimate is ~$4,350
Silver Q2 average quarterly price estimate is ~$73.50
Can you imagine going back in a time 1-2 years and reporting to PM investors that in the future those would be the average gold and silver prices, but yet resource investors will be depressed, and the sentiment will be horrible towards producers; chopping them in half in share price and market cap.
Here in mid-July we are already in the heart of the seasonally weak Summer Doldrums period for the precious metals sector. The good news is that month of July often marks a turn up out of a low intermediate point of consolidation in this space; before the gold stocks then move higher; rallying into the late summer and early fall. We saw that same pattern last year from June through September
This is a composite of 16 years (up through December of 2025), crammed onto one seasonality chart from EquityClock.com. They are data trends, not a crystal ball.
It should be obvious that no 2 years are identical. However, this year has respected seasonal trends like the “Q1 Rally,” the “PDAC Curse” in March, the “Spring Fling” in April/May, and the move to a low point in the “Summer Doldrums.”
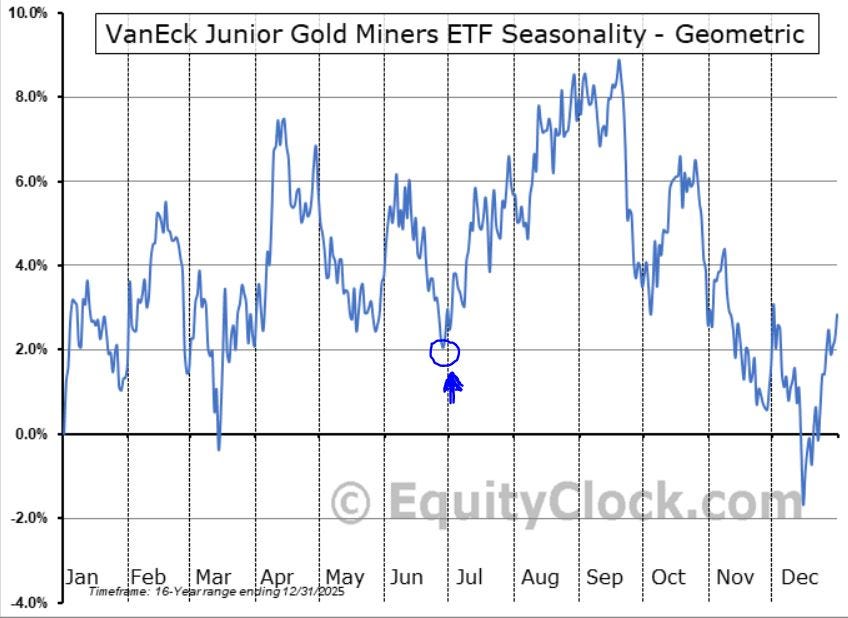
Note on the (GDXJ) that late June or early July is average low point in the summer doldrums. Here in mid-July, we saw new lower levels this last week, but that also may have just been the low point.
This low point in the Summer Doldrums often marks not just an intermediate low point in pricing, but also low investor sentiment and volume/participation, before seeing the PM complex start rallying again into late July, August, and September.
We’ll need to see how things play out over the next few months, and again, this is not carved in stone, but seasonality can act like a headwind or tailwind.
With those potential seasonal tailwinds at the back of the precious metals miners, and combined with the negative investor sentiment from Q2, and strong underlying operational and financial fundamentals for the producers; then we may actually have a perfect storm of factors to see a compelling tradable rally in this space.
This dichotomy between how well the producers are doing operationally and how bearish the markets have become in price and valuations may end up being a positive divergence.
If one tunes into the mainstream financial media, or even many resource sector outlets, financial analysts and sector pundits have really been harping on both the falling gold and silver prices and rising energy prices as cost inputs. Yes, when these 2 factors get combined together then they equate to margin contraction for the second quarter. However, that is also MORE than priced in at this point.
We’ve seen the best-of-the-best PM producers down 30%-40%, and the best-of-the-rest down 40%-60%, from their January/February highs to their present lows.
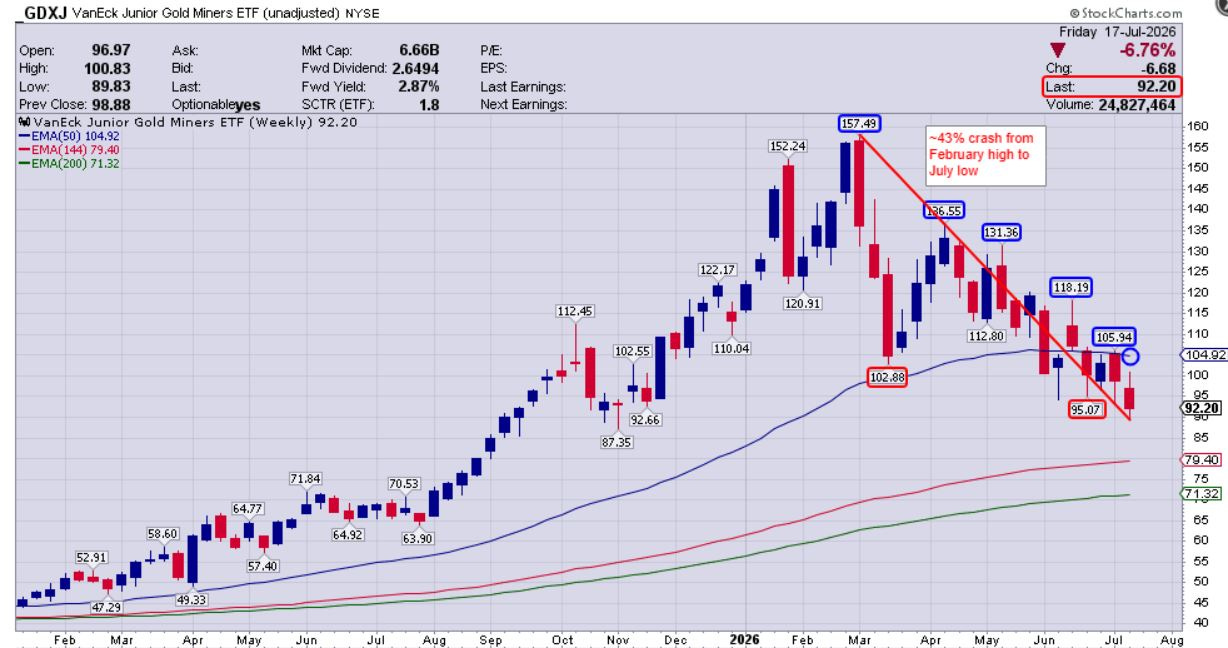
(GDXJ) has corrected almost 43% from its February high of $157.49 down to its July low point of $89.83 just yesterday on July 17th. Most people note a sector is in a bear market if it corrects more than 20% for a sustained period. This more than qualifies.
(GDXJ) has put in a pattern of “lower highs” and “lower lows” = technically bearish price pattern.
(GDXJ) pricing is still down below the 50-week EMA, as well as below the 200-day EMA, which is also bearish price action.
It’s easy to understand why the Daily Sentiment Index in gold miners plumbed the low reading of “10” 2 weeks back, and why many traders finally threw in the towel over the last 2 months. There is not much positive one can say about price action like that.
However, just as “the cure for high prices is high prices.” - Conversely, “the cure for low prices is low prices.”
Bottoms don’t form when investors have high sentiment, or when they are bubbling over with excitement.
Bottoms form when sector sentiment sours, when pricing is in the basement, and when people start crying uncle and exiting their positions. That is the precise backdrop we find the precious metals sector in right now in early July.
It is into this bearish and bleak environment that gold and silver producers are about to release their 2nd best earnings quarter in history. Many people have noted “Well, these Q2 earnings aren’t going to be as good as Q1 earnings.”
Fine, that is obvious; but that expectation is also more than priced in at this point. Nobody is pricing in just how well these companies actually did do in Q2.
What is also obvious on the charts is that these PM producers have crashed back down all the way to where they were trading back in Q3 and Q4 of 2025. The average metals price for Q2 of 2026 was notably higher in both gold and silver; and their margins were notably fatter… Yes, even with their higher energy input costs.
The year-over-year comparables, from Q2 of 2025 vs. Q2 of 2026, are going to show a stark contrast; and this will likely raise a few eyebrows and reframe market perceptions.
With regards to the higher energy prices: Yes, higher input costs absolutely mattered in Q2, and still matter here in Q3… but just not as much as people pounding on the table of catastrophic margin contraction would lead you to believe.
The war in Iran and chokepoints in the Strait of Hormuz, did shoot oil prices up from the mid-$60s to briefly over $100, and then did a round trip back into the high-$60s by the end of the quarter. As a result, most analysts are painting all the gold and silver miners with the same broad brush and expecting them to have seen 40% increases in their costs in Q2; but this is ridiculous on many levels.
There are several problems with this type of blanket analysis on this sector:
1) There is variation in mining method: Not every producer has the same energy cost inputs. Energy costs can vary wildly depending on if they are a massive open pit with huge fleets of big yellow trucks driving around, or if they are smaller open pits with less equipment, or underground mining operations with even less equipment.
2) Some companies hedge forward their energy costs, and thus were partially insulated from the supply shock spike to oil and diesel in Q2.
3) There is a lot of nuance regarding on-site power generation: Yes, some companies generate power off diesel generators in more remote locations; but some also run power off very cheap hydroelectric or natural gas power, or augment their energy needs with solar installations.
4) Some mining equipment is migrating over to battery-powered fleets: More and more companies are implementing some battery-powered rolling equipment into their worksites, and thus they are more sensitive to kilowatt hours than the price of oil/diesel.
5) Direct fuel and oil costs typically make up 5% to 15% of a mining company’s total operating expenses, though this varies heavily based on the commodity, the mine type (open-pit vs. underground), and how remote the project site is.
6) While direct diesel consumption is the primary focus, oil price movements also ripple through indirect costs, such as shipping, explosives (like ammonium nitrate), lubricants, and tires.
7) So all-in the oil price may affect 10%-20% of costs, but you sure wouldn’t know that by listening to the dire prognostications in the mainstream financial media.
8) Now, after renewed conflict between the US and Iran, the oil price moved back into the low $80s. This could play a factor with investor sentiment looking into the future.
9) It will be most important to pay attention to Q3 and H2 guidance from producers, and get a sense for how they are looking at cost inputs for the balance of the year.
With regards to the pre-revenue junior gold and silver stocks, we are about to get a deluge of positive news over the next few months. This newsflow will range from from early-stage mapping / sampling initiatives and drill results, to resource estimates and economic studies.
The juniors are more cashed up today than they have been in over a decade, after the favorable 2024-2025 and even early 2026 capital markets window was wide open.
Many companies are right in the middle of their largest drill programs ever, and have only started, or in some cases not even started, reporting assay results.
This coming wave of news from the sector, which should be mostly constructive, is highly anticipated by investors that are positioned accordingly or many that are watching with keen interest from the sidelines.
For the earlier stage explorers, the current price of gold or silver is largely irrelevant, because they are 5-10 years from moving towards production (if ever). Yes the overall price affects what results may be economic far down the line, but it is really more about executing on deliverables or making a new discovery. Yes, the metals price direction is a headwind or tailwind, but these stocks can absolutely move to the beat of their own drums, depending on if news is value accretive / value destructive.
We are entering a seasonally favorable period for late July, August, and September for a rally in the precious metals and PM equities. That’s a positive tailwind.
The gold and silver producers have already crashed by 40%-60% from their Q1 highs into Q2, simultaneously as they had one of their best operational and financial quarters on record. They are generating robust profits even if their corresponding shareprices don’t reflect that.
Pricing action on the charts has been decisively bearish for the last 4-5 months, and investor sentiment has leveraged that weakness lower to become quite despondent. That is fuel for selling exhaustion, capitulation, and a bottoming process.
Q2 earnings have the potential to surprise to the upside because many investors have lost the plot. Q2 2026 was far more profitable than Q2 of 2025, and while it will be lower than Q1 2026, the numbers should still come in better than Q3 and Q4 of 2025; even though that is where the price and valuations have returned to.
Forward guidance for Q3 2026 will be key data to pay attention to.
There will be a coming wave of sector newsflow from the junior pre-revenue precious metals companies over the next few months. This could provide multiple alpha catalysts in a myriad of the gold and silver explorers and developers.
This weekend edition of The KE Report explores the contrasting dynamics within the commodities sector. In the first segment, Brien Lundin, editor of the Gold Newsletter, breaks down the current correction in the precious metals market, explaining why short-term macro headwinds are overpowering strong, inescapable long-term fundamentals.
In the second segment, energy experts Josef Schachter and Nathan Richie analyze recent volatility in crude oil and natural gas, offering a detailed forecast on global demand trends, geopolitical risk factors, and under-the-radar growth stocks.
The Nature of the Precious Metals Correction
Key Insights: The current downturn in gold (under $4,000) and silver ($56) is a classic “weak hands” shakeout typical of a secular bull market. The correction is being driven by temporary near-term factors, specifically a hawkish Federal Reserve narrative and a stronger US dollar, which are masking long-term structural tailwinds.
Notable Quotes: “These are the kinds of things we get in a real bull market... that test your convictions and drop the weak hands out of the market.” — Brien Lundin
Market Trends/Data: While western speculative capital has backed off, sophisticated investors at recent conferences (like the Rick Rule conference) are treating the bottoming process as a major buying opportunity rather than a cause for panic.
Actionable Takeaway: Investors should use the current seasonal weakness over the next 2–4 weeks to accumulate high-quality precious metals assets at a 20% to 30% discount before a potential fall rally.
The Binary Reality of Mining Stock News Flows
Key Insights: In a bearish sentiment environment, standard “good” or “solid” drill results are often ignored or subject to immediate selling. Only truly eye-popping, extraordinary data will be rewarded by the market right now, making upcoming earnings and drill results high-stakes binary events for explorers.
Notable Quotes: “If the news is good but not great... they’re going to suffer. If the news is great, I think we’ll be okay.” — Brien Lundin
Market Trends/Data: High-profile drill programs face high market expectations. Meanwhile, companies with proven, substantial resource ounces in the ground are holding up significantly better than pure explorers.
Actionable Takeaway: Look for advanced development-stage companies with embedded value (proven ounces in the ground) that are currently muted by a bad market, as they represent the highest coil potential when the cycle turns.
Thanks for reading and may you have prosperity in your trading and in life!
Shad
Investment disclaimer:
This content is for informational and educational purposes only and does not constitute investment advice, an offer, or a solicitation to buy or sell any security. Investing in equities and commodities involves risk, including the possible loss of principal. Do your own research and consult a licensed financial advisor before making any investment decisions.
Comments
Nothing yet. Say the first thing.
Sign in to join the conversation.