
Hey, it’s been a while since my last report. Price action has been kinda boring (in a good way), and I’ve been going deep down the AI rabbit hole. But it’s been an interesting week, so let’s catch up on the markets and get a game plan together, starting with Bitcoin:
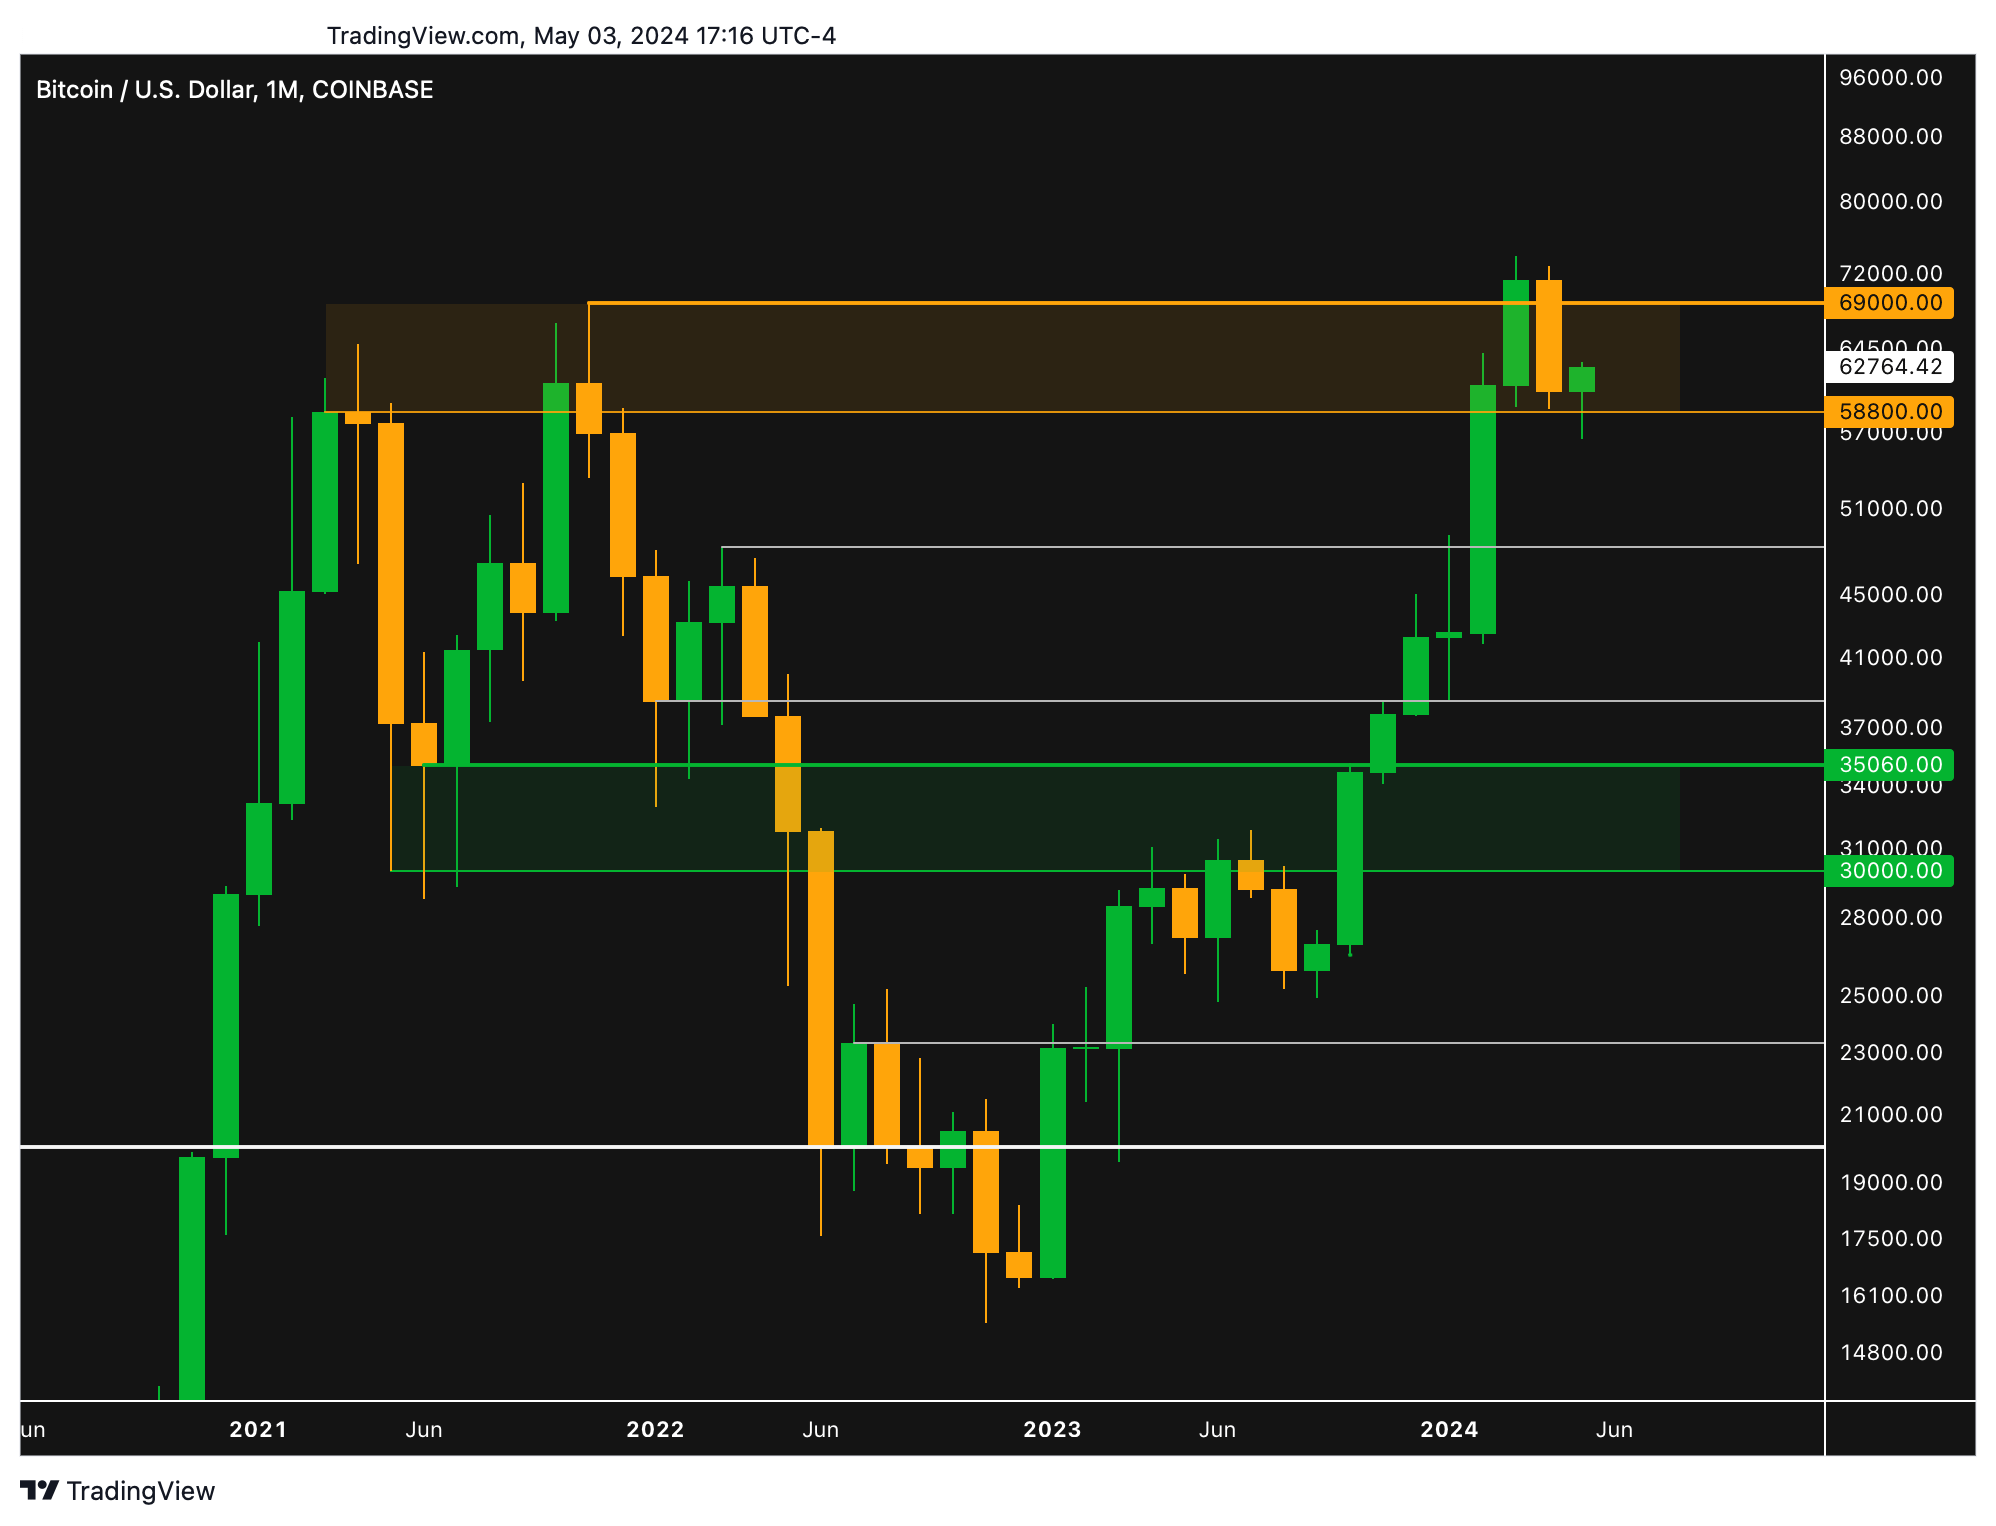
The monthly chart looks fine. It broke out super hard, super fast from $30K in October because of the spots ETFs, then hit the the orange resistance zone at around $60-70K in February-March. That’s about 175% in six months. That’s a lot. It’s perfectly healthy for this orange resistance zone at prior all-time high levels to be serving as resistance for a few months.
However, the technical picture is murky right now. There are bullish signals and bearish signals, but none of them are strong right now.
I could argue that monthly chart is bearish because March and April candles represent a failed break out. The 2021 bull market topped with a failed breakout on the monthly chart and lead to a brutal bear market.
I could argue that the monthly chart is neutral because the March candle wasn’t really a break out, it was within margin of error of prior all-time highs at $69K, so it’s just temporarily pausing at resistance.
I could argue that the monthly chart is bullish if I said “actually, $69K wasn’t the break out point, $60K was, and March was actually a strong break out, April was the retest, and now May looks extremely strong because it briefly broke down below $60K and has quickly reclaimed it and showed strength this week.
In addition, I don’t think the same technical signals—that worked so well at getting me out of the market around the top of the last bull market and back in starting at the bottom of the last bear market at $16K—will work as well now because the spot ETFs have changed the entire market structure:
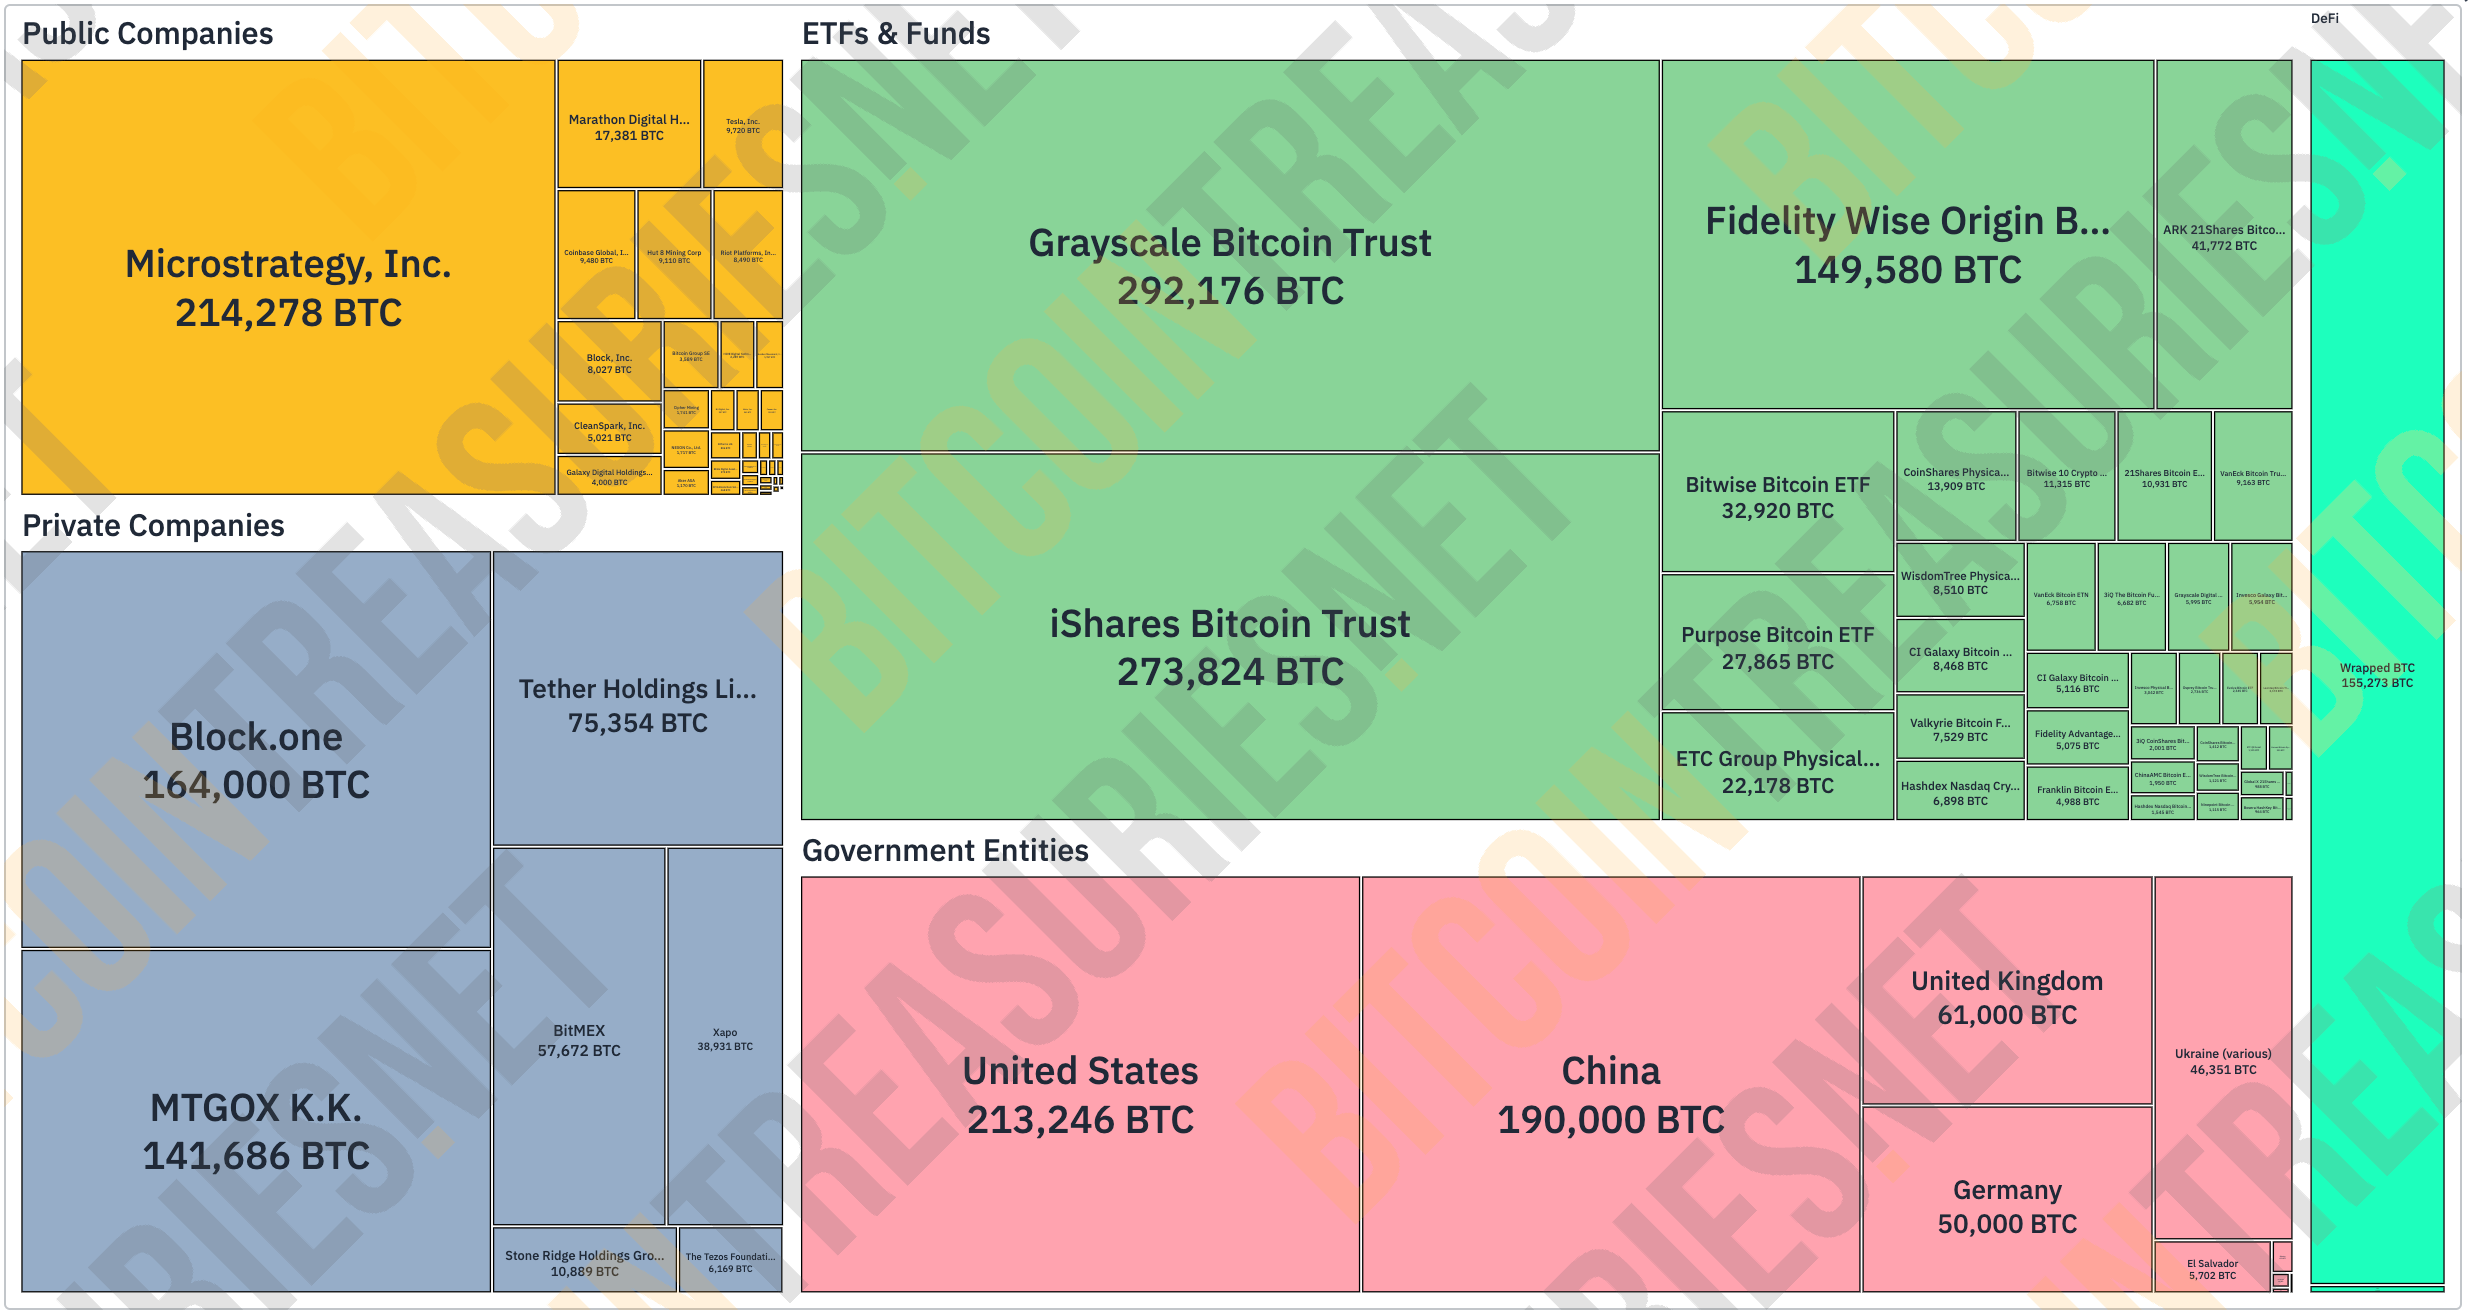
I suspect the Wall Street traders will wipe out the crypto natives because they have more money to push around the markets. That’s why I’m not swing trading anymore, just investing. I don’t want to compete with office floors full of nerds staring at charts all day, every day. There are better opportunities out there in the world right now.
Net-net, the monthly chart looks neutral to me in the medium-term (the next few months), but bullish to me long-term (the next few years). So I’d be happy to be dollar cost averaging and holding here.
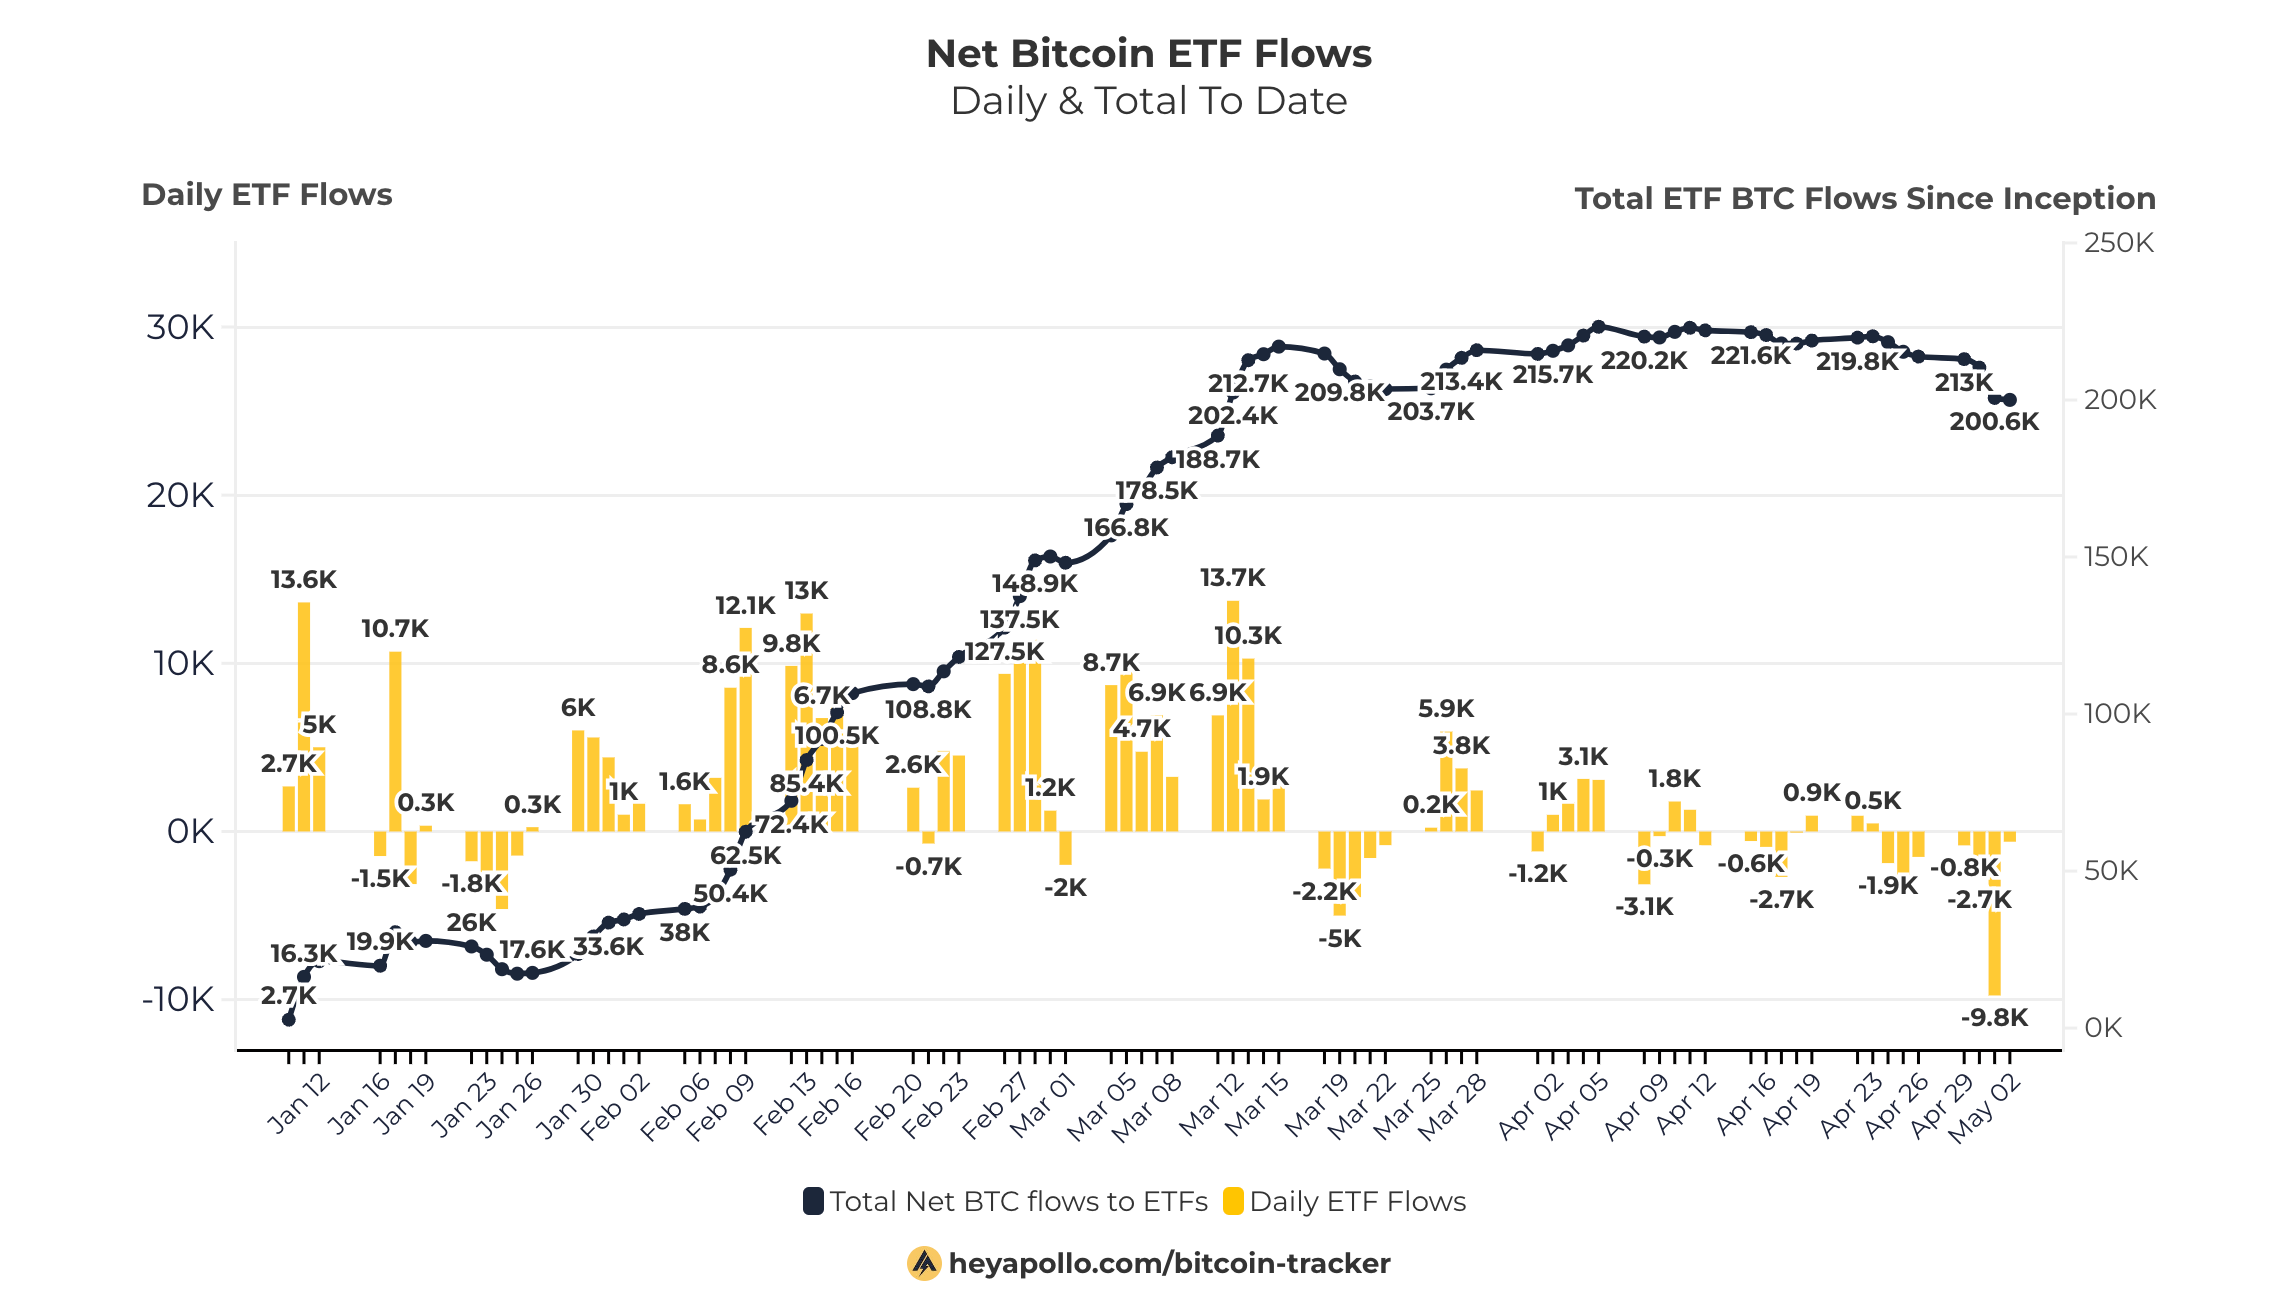
ETF inflows have slowed a bit. It makes you wonder if all the people who wanted buy the spot ETFs have already bought as much as they wanted to. The next marketing phase is to get new people interested in buying Bitcoin (spot ETF or otherwise).
On a bullish note, national debt is still through the roof and it’s probably only a matter of time before they start printing money again.
Every once in a while, you get a trade opportunity that’s just obviously a great one to take, but this doesn’t seem like one of those time. I don’t have much conviction in either direction right now. Sometimes the best trade is not taking one and waiting for better opportunities. I’m fine with holding long-term though.
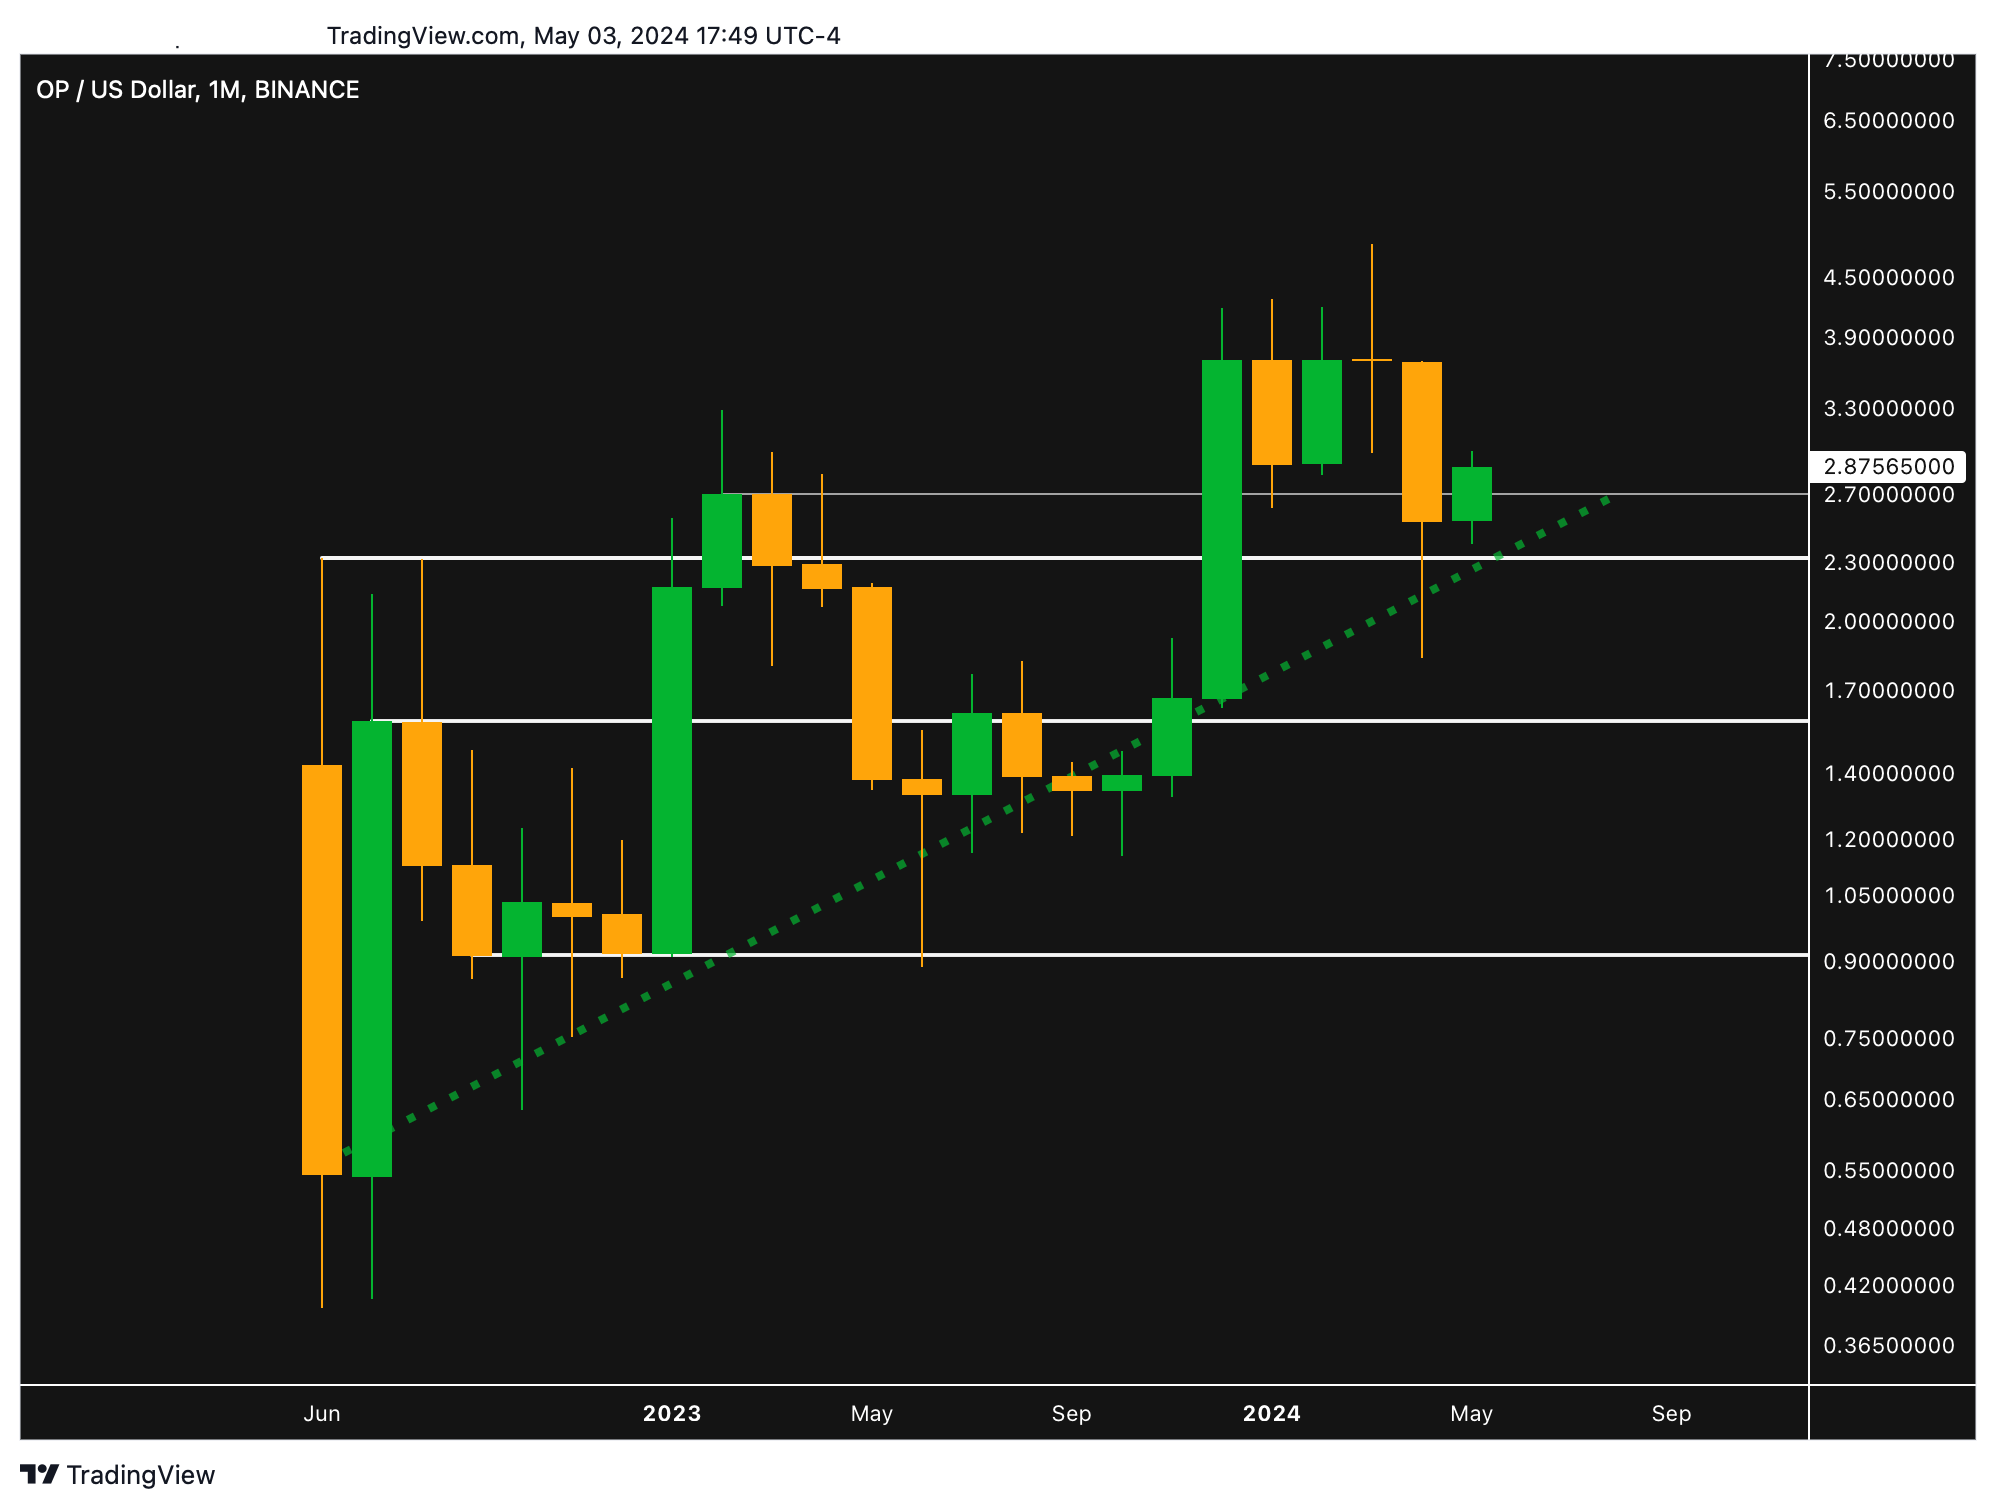
The Optimism monthly chart has been in a clear uptrend since it was listed on exchanges in June ‘22. As is often the case with diagonal lines, the dotted green line doesn’t perfectly align with every support point, but you can see that OP has been making a series of higher-highs and higher-lows. There’s more money buying it than selling it. Looks long-term bullish to me. I’d flip to bearish it if goes below 2.32 though.
Comments
Nothing yet. Say the first thing.
Sign in to join the conversation.