
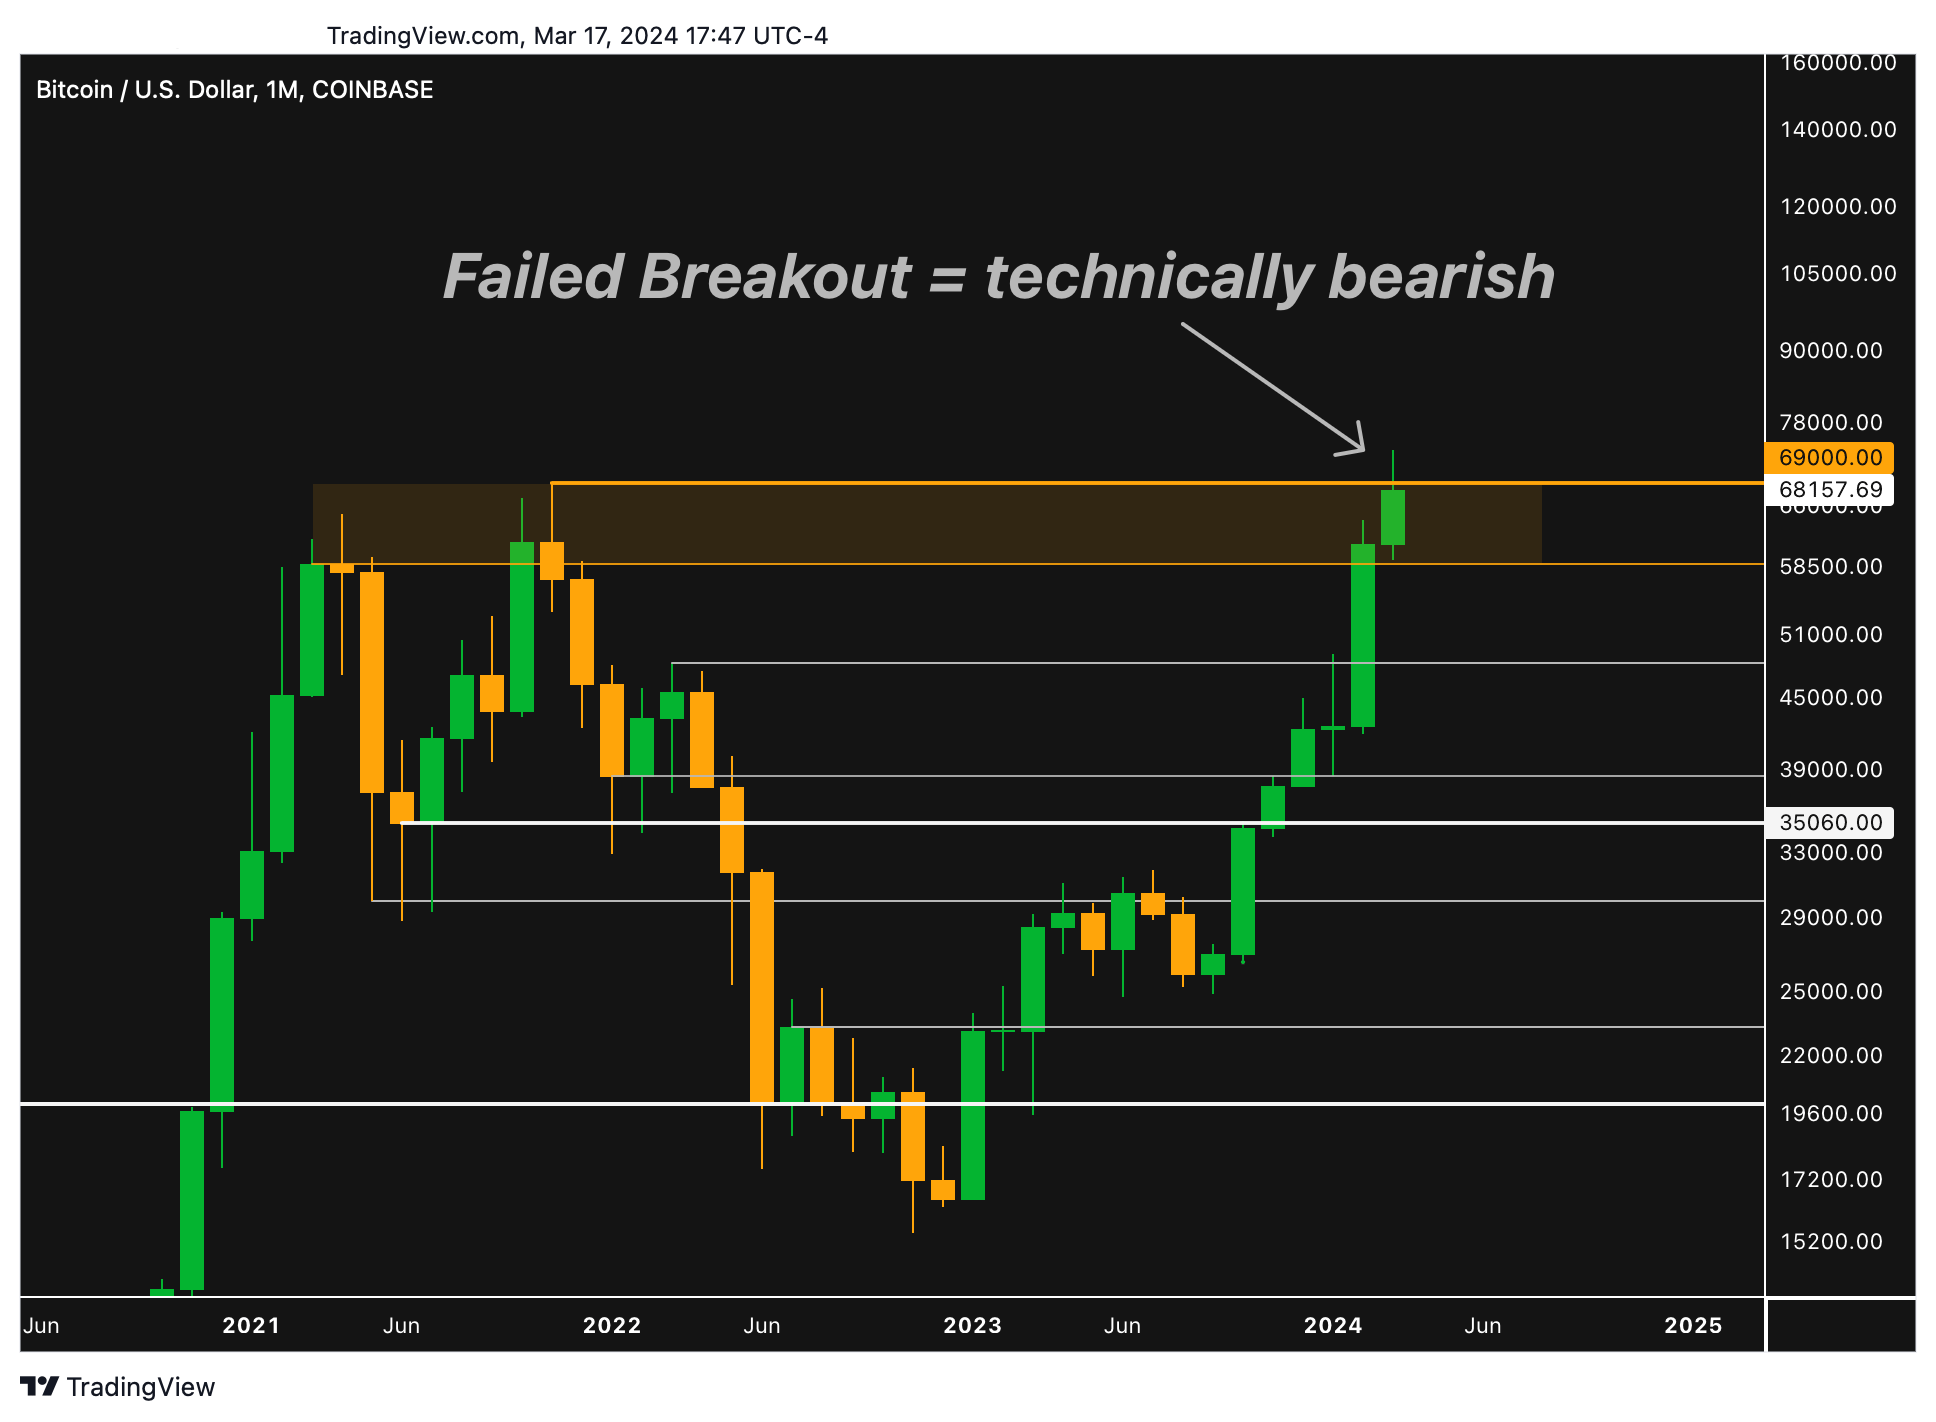
Bitcoin entered a resistance zone, the orange box around prior all-time highs, last month. Now, it’s giving me two conflicting signals:
Bearish: Bitcoin broke above the top of the resistance zone at $69K, but failed to sustain it, and is now back below it. In the pre-Wall Street era of Bitcoin, this would make me quite bearish, but the entire structure of the market is different now, so I’m not that worried about it.
Bullish: Bitcoin has not had a meaningful pullback despite hitting this significant area of resistance, it’s just consolidated. The absence of weakness in a scenario where I’d expect to see weakness signals strength.
I expect Bitcoin to eventually break through this area of resistance and perform well throughout 2024, my only question is how long it takes, and if there’s going to be a major pullback first.
When ETF inflow data started exceeding expectations, a couple of weeks after the ETFs launched, I shifted my strategy from long-term swing trading and timing market cycles, to dollar cost averaging and holding. Therefore, I don’t care if Bitcoin pulls back, consolidates for longer, or breaks through soon.
I’m buying and holding unless there’s some sort of black swan event like a problem with ETF custody.
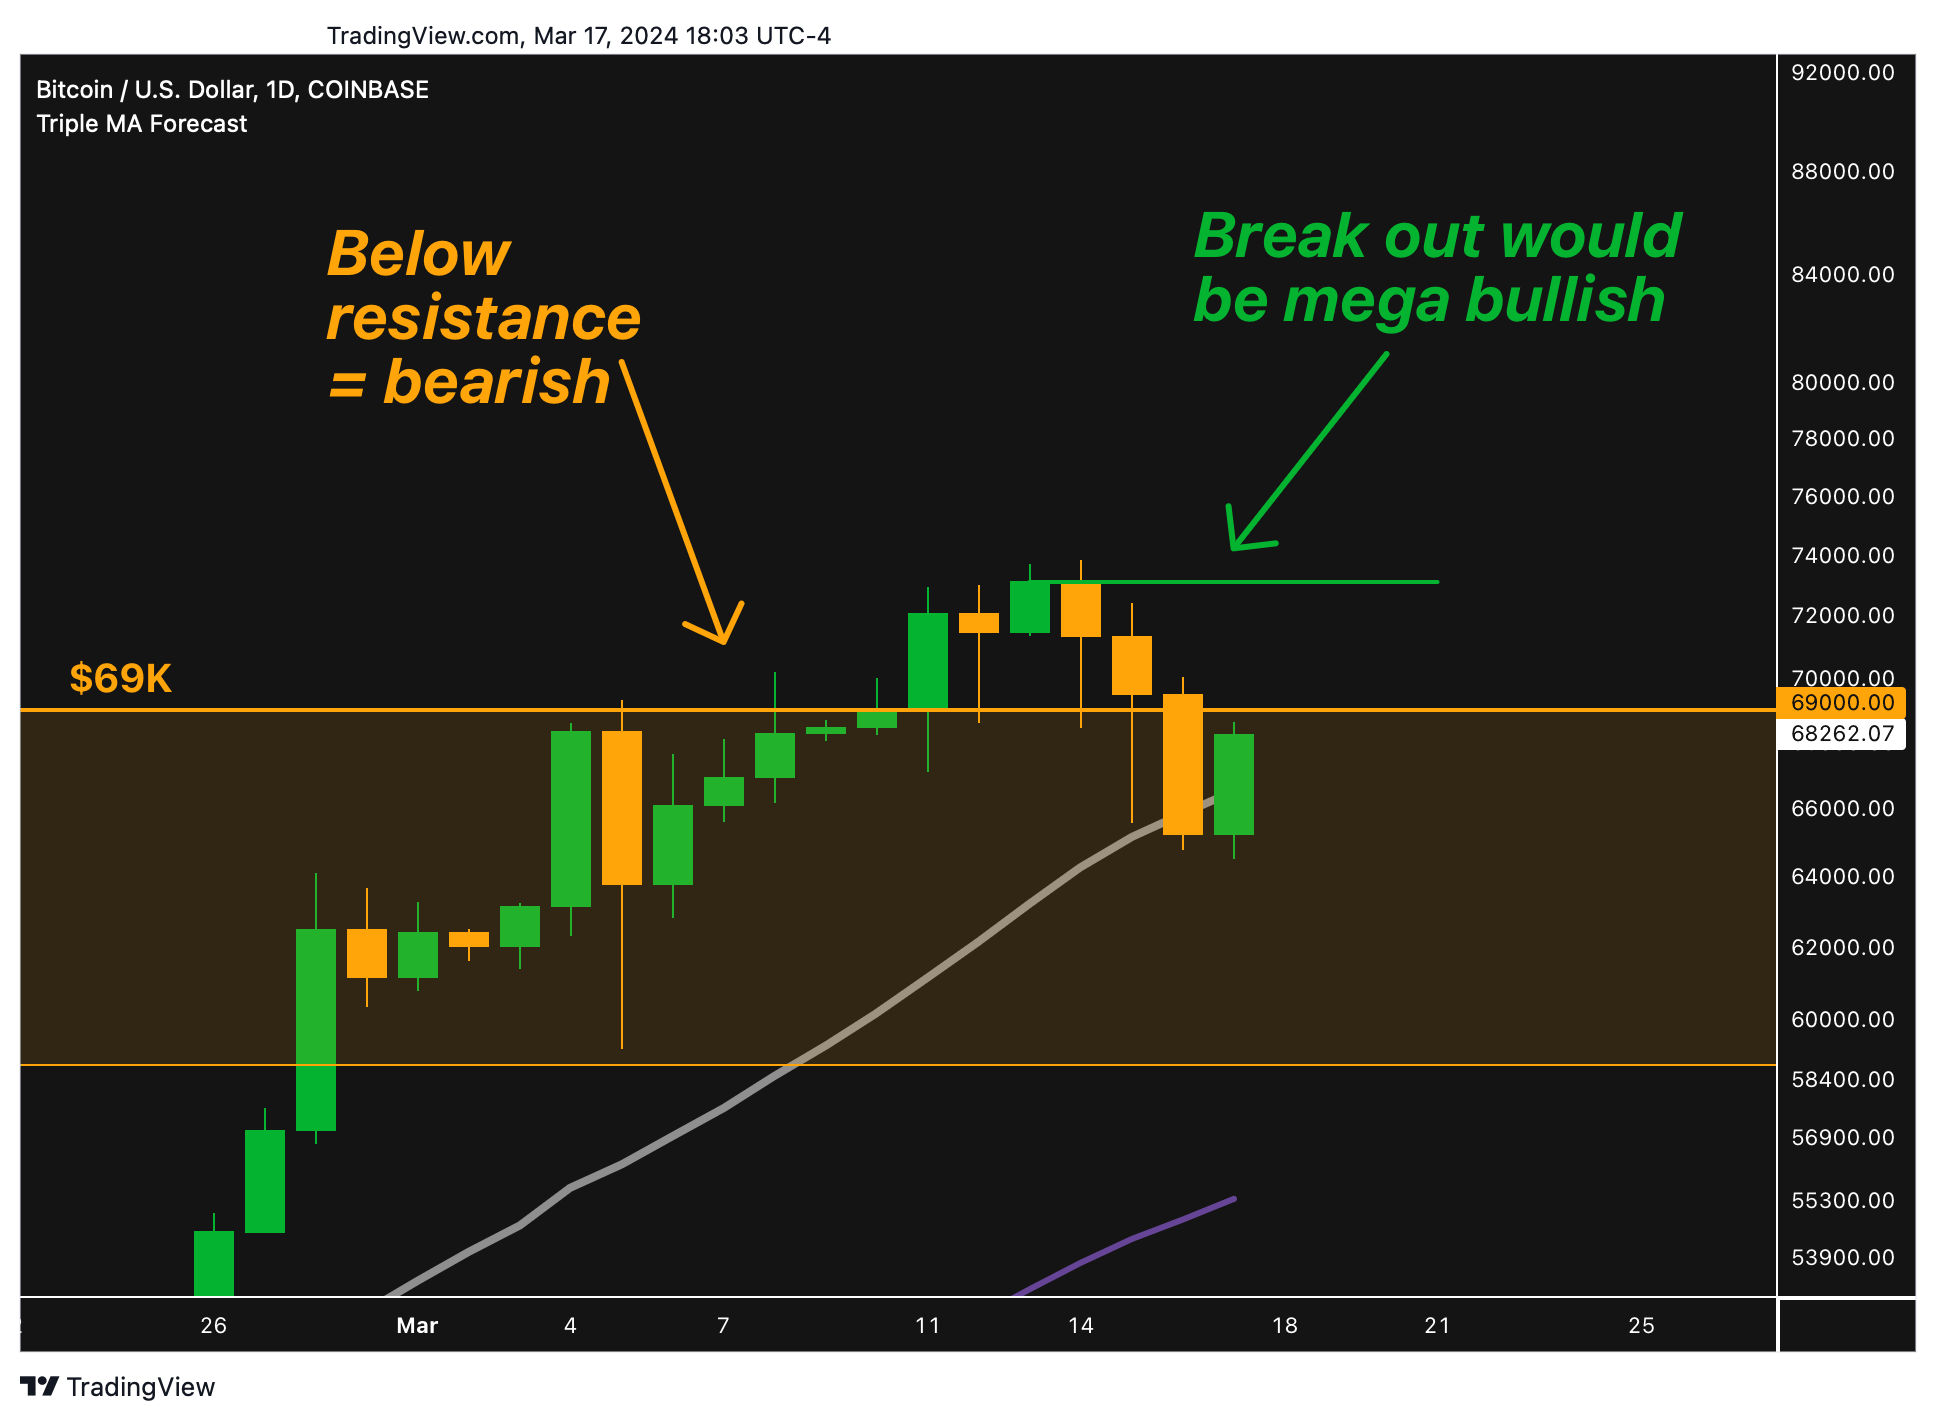
Zooming into the daily chart, you can see Bitcoin has been oscillating around the key $69K level for about two weeks. It’s clear that bulls and bears are in a raging war for the territory.
After breaking above $69K on Monday, Bitcoin dipped back down to the 20-day moving average (rounded grey line) on Friday. At the end of the day, Bulls went heroic to get the daily candle to close back above $69K. The bears took over on Saturday, but today the bulls are back to try to close the weekly candle on a bullish note.
Sentiment is starting to get a bit euphoric, so there’s a lot of leverage in the market, which means that small down moves can lead to forced selling which causes further downside.
My criteria for getting short-term bullish on Bitcoin and Altcoins:
Daily candle close above $73.5K
Weekly candle close above $69K
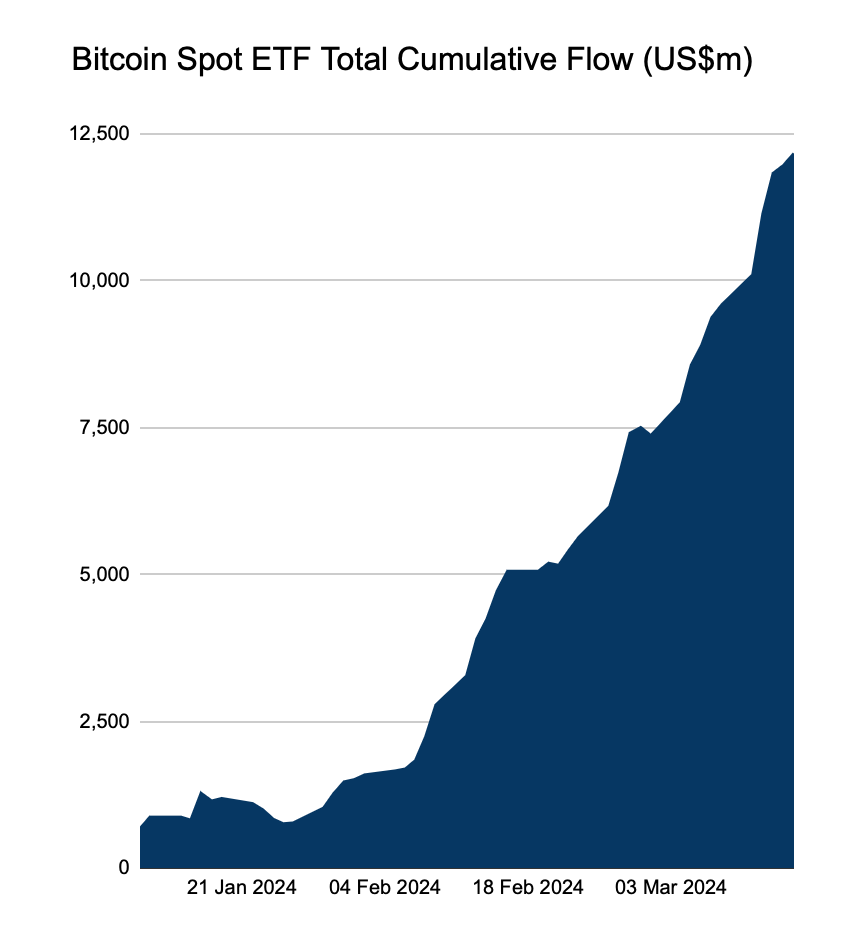
Bitcoin spot ETF inflows remain extremely strong. Inflows have exceeded expectations, and so has Bitcoin’s price.
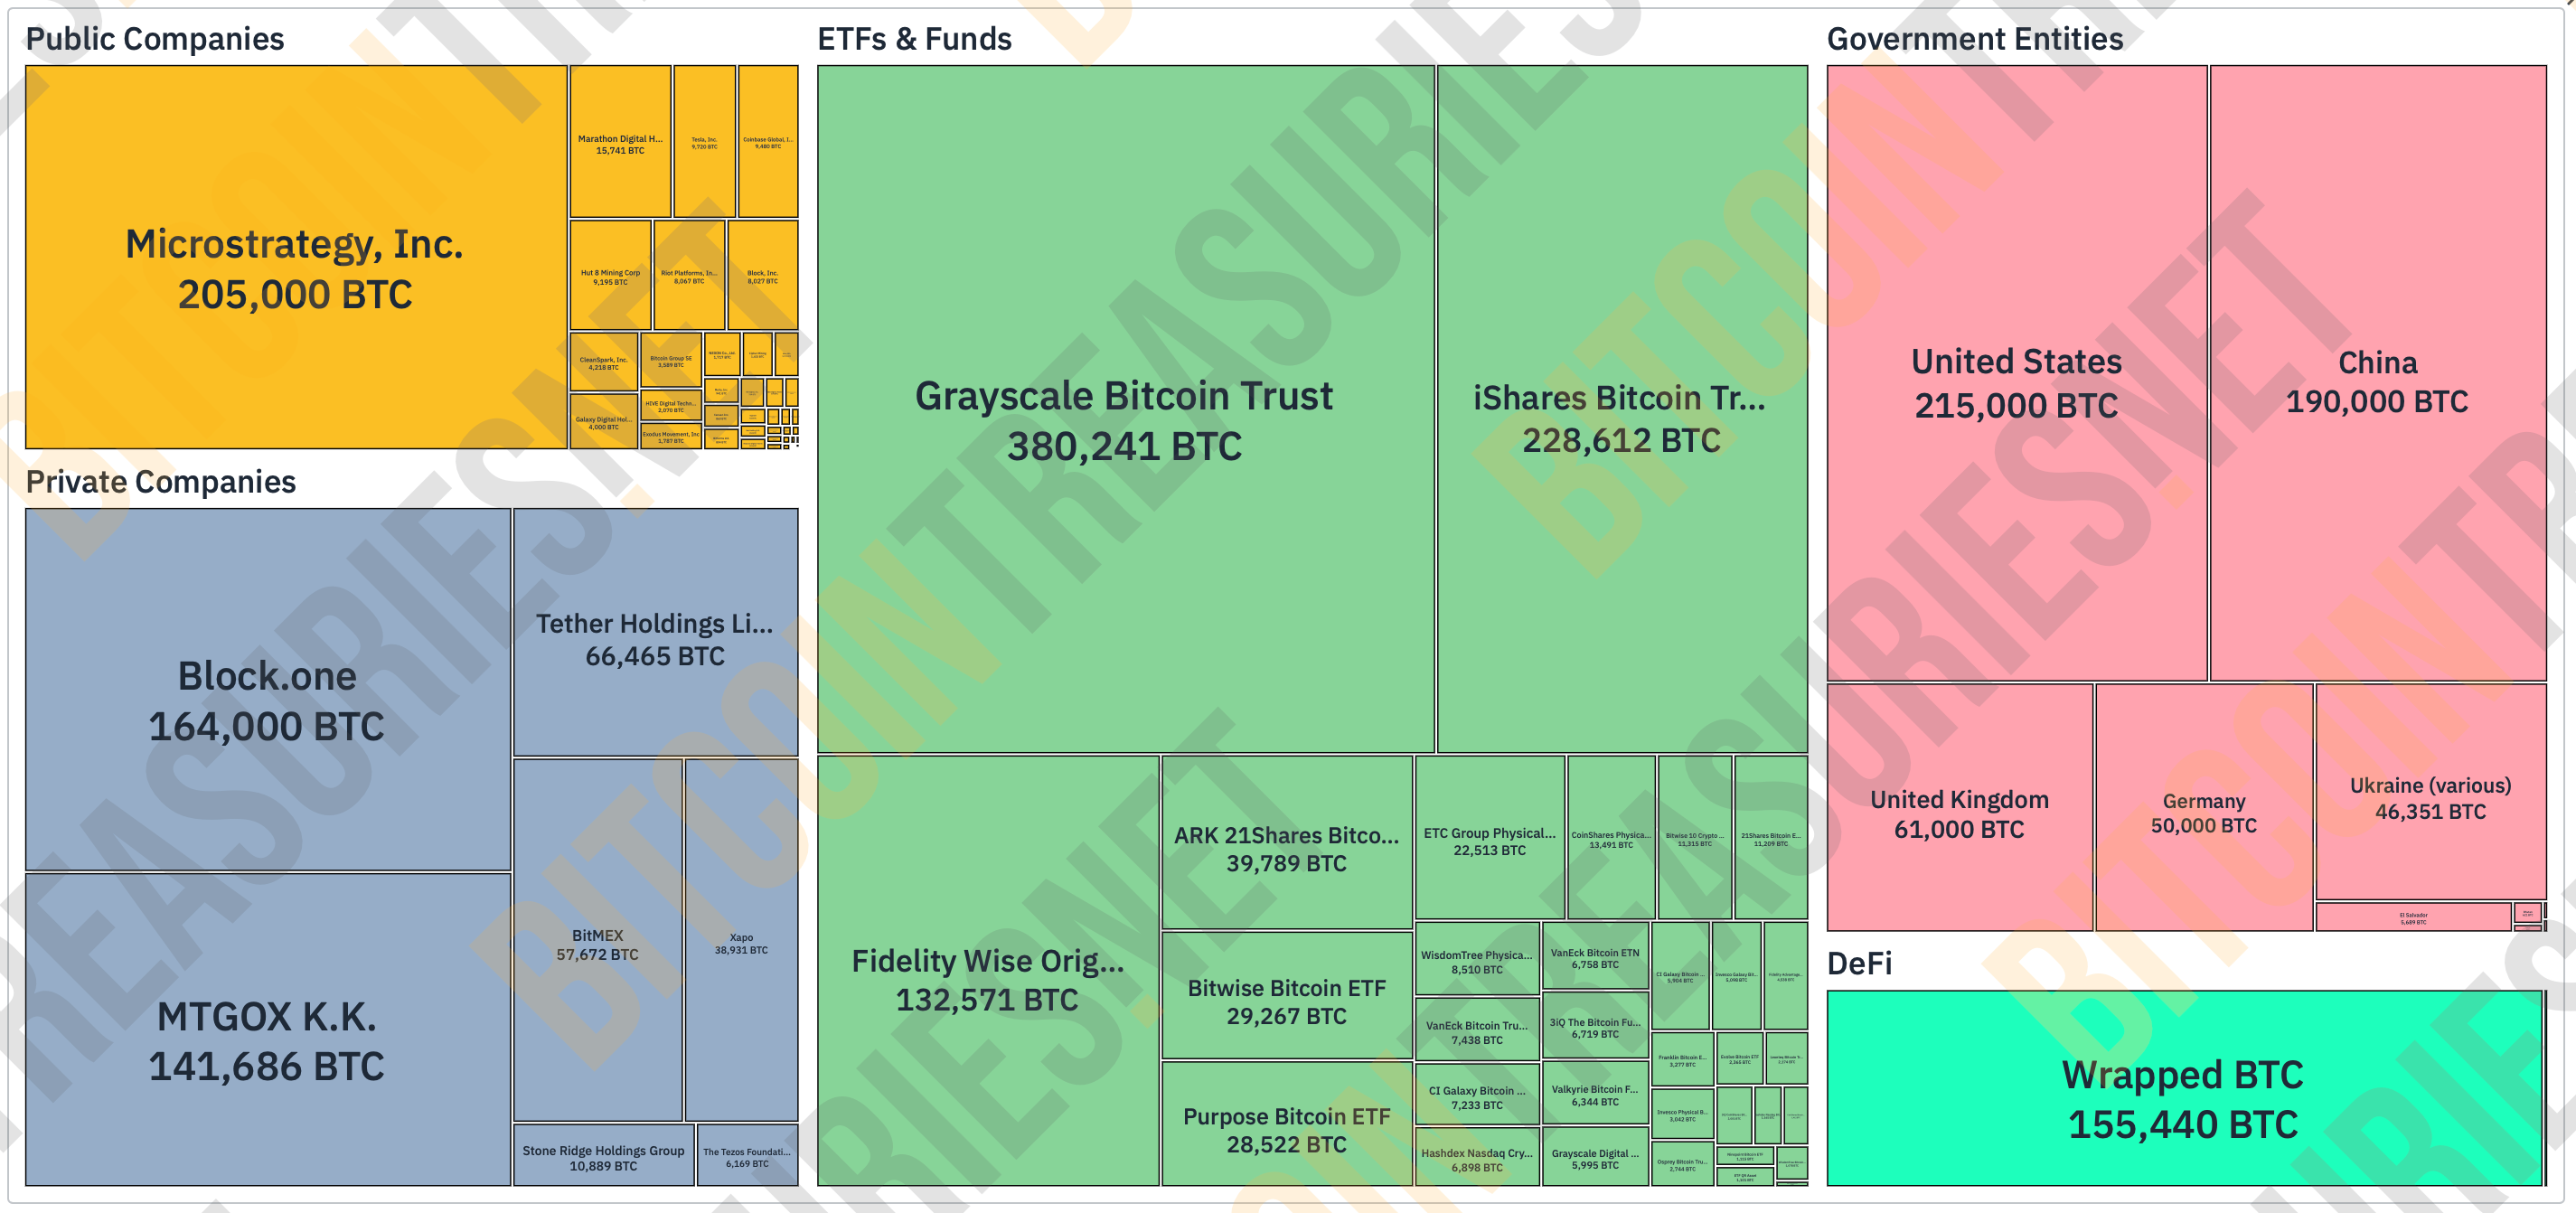
The market structure of Bitcoin has completely changed. The chart above shows the treasuries with the largest Bitcoin holdings. You can see iShares, Blackrock’s ETF, now owns more Bitcoin than Microstrategy.
Meanwhile, Microstrategy has found a glitch in the matrix where they can raise money to buy Bitcoin, which drives up the price of Bitcoin, which allows them to raise more money to buy more Bitcoin, which drives up the price of Bitcoin even more.
With these new market dynamics, I don’t expect technical set ups to play out the same way the used to before. That’s why I’m not that worried about Bitcoin’s failed break out.
There are also two bullish macroeconomic forces at play:
The Fed is expected to cut interest rates this year despite inflation still being quite high.
We’re now adding $1 trillion of national debt every 90-120 days. It took 63% of all personal income taxes in February just to pay the interest on the debt.
You can get more of my fundamental analysis here.
Maybe we get a pullback or further consolidation in the short-term, but this is literally the perfect storm to be long-term bullish on Bitcoin. But as always, I could be wrong, and I’m willing to change my mind pending bad fundamental news or bearish price action. This report is not financial advice.
No posts
Comments
Nothing yet. Say the first thing.
Sign in to join the conversation.