
Hey Folks, here at EquityEdge Research, we make Small-Cap Investing easy for you by Backing you up with Robust & Full-Fledged Research.
Yes, we do use AI in our articles, but only to create a structure. We fact check and write the drafts on our own. If you find anything that seems suspicious/ erroneous, please feel free to comment below the article.
Please fill the form below if you are interested to know and would like a Free Sample Report showcasing what we offer in our Premium Services!
Check out our Previous Report here:
Table of Contents:
Key Highlights.
Company Price Chart Analysis.
About the Company.
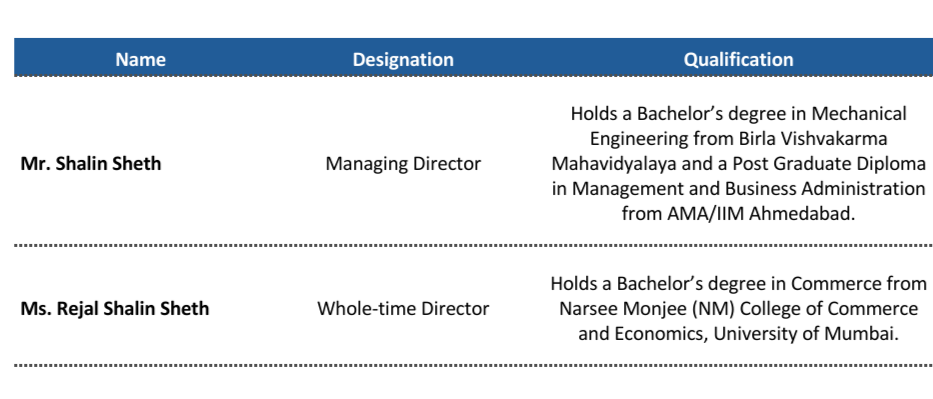
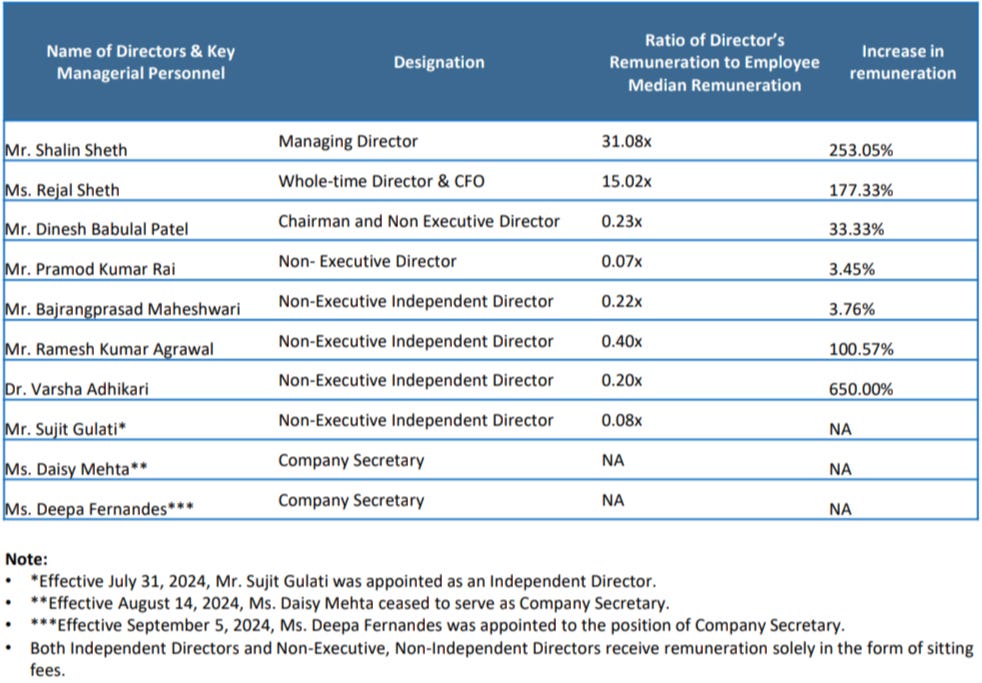
Management Analysis.
Financial Analysis
Ratio Analysis.
Shareholding Analysis.
SWOT Analysis.
Competitors.
Global Electrical Equipment Industry.
Indian Electrical Equipment Industry.
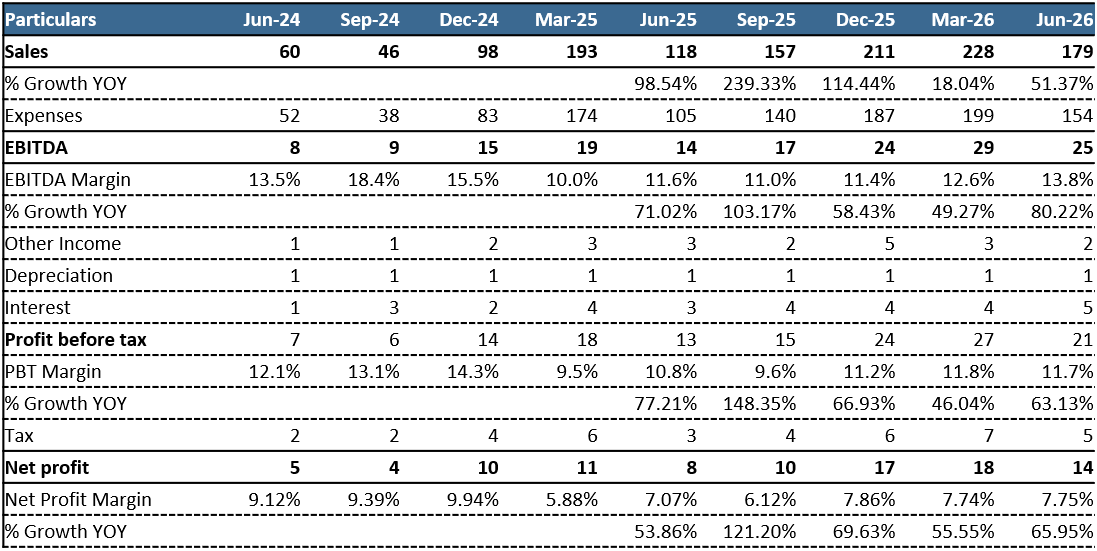
Financial Analysis- Quarterly.
Segment Wise Data.
Competitive Analysis- Bio & Financials.
Daily Share price trend TTM- Peer comparison.
FY26
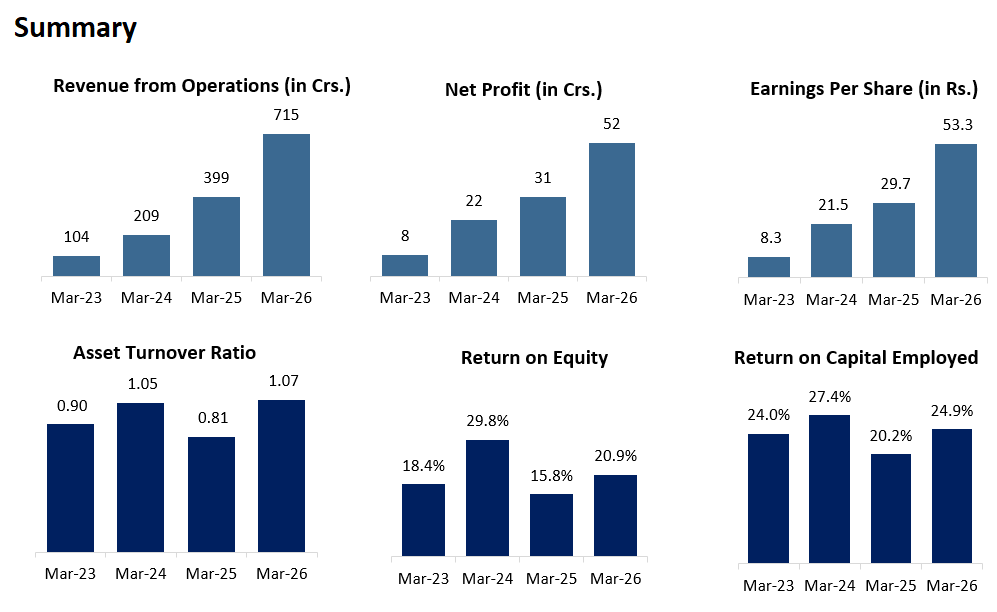
REVENUE: ₹ 715 Cr. (+79.2% YoY)
EBITDA: ₹ 84 Cr. (+61.54% YoY)
EBITDA MARGIN: 12% (-100 bps YoY)
PAT: ₹ 55 Cr. (+71.88% YoY)
Q1FY27
REVENUE: ₹ 179 Cr. (-21.49% QoQ, +51.69% YoY)
EBITDA: ₹ 25 Cr. (-13.79% QoQ, +78.57% YoY)
EBITDA MARGIN: 14% (+100 bps QoQ, +200 in YoY)
PAT: ₹ 15 Cr. (-21.05% QoQ, +66.67% YoY)
OTHER HIGHLIGHTS:
Record Order Book: The unexecuted order book crossed ₹1,330 Crore as of June 30, 2026, reflecting a 97% YoY growth.
Segment Mix: The order book is diversified, with 71% from Power Transmission Solutions (PTS) and 29% from New and Renewable Energy (NRE).
Order Inflow: Secured fresh orders worth approximately ₹255 Crore during the quarter, including L1 positions (lowest bidder) across segments.
Expected Inflows: The company anticipates an order inflow of ₹1,600–1,650 Crore for the full fiscal year FY27.
Power Transmission (PTS): Completed major projects for GETCO and DGvCL (Gujarat). Received product supply approval from Power Grid Corporation of India (PGCIL) for OPGW cables. Secured EPC orders worth ₹256 Crore from Gujarat DISCOMs.
New & Renewable Energy (NRE): Successfully completed a 67.5 MW Solar EPC project in Khawda. Secured a 150 MW / 300 MWh BESS project in Junagadh, Gujarat (besides a 50 MW/100 MWh project in Radhanpur).
Green Hydrogen: Became the first Indian company to successfully demonstrate live testing of a 5 MW electrolyser, achieving a verified Specific Energy Consumption (SEC) score.
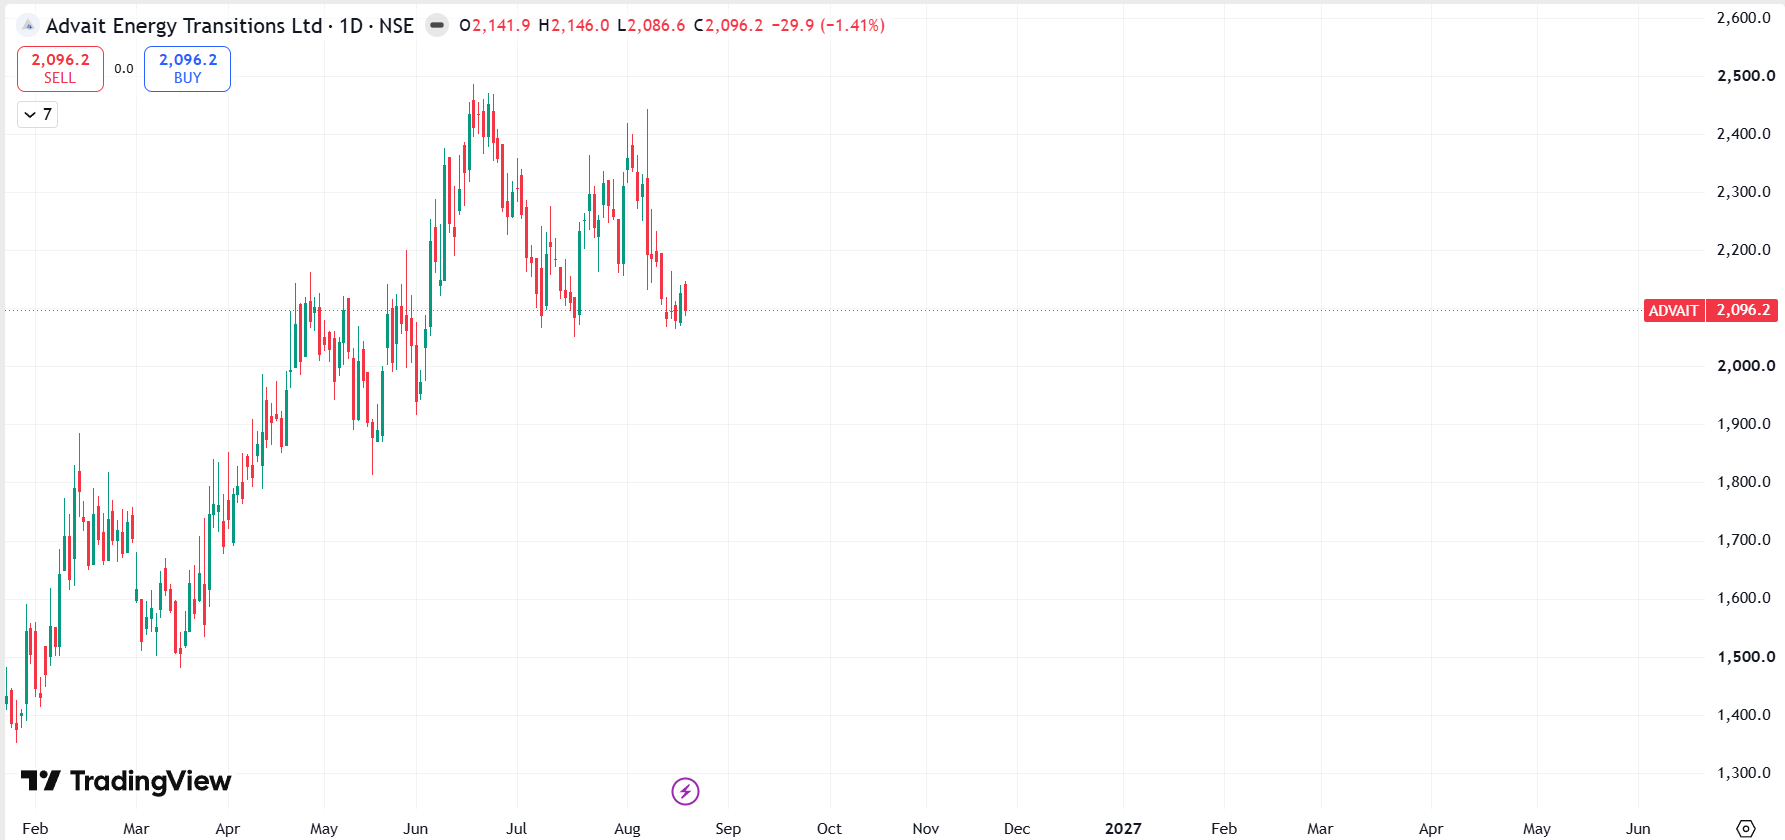
2.1 Advait Energy Transitions Limited Performance:
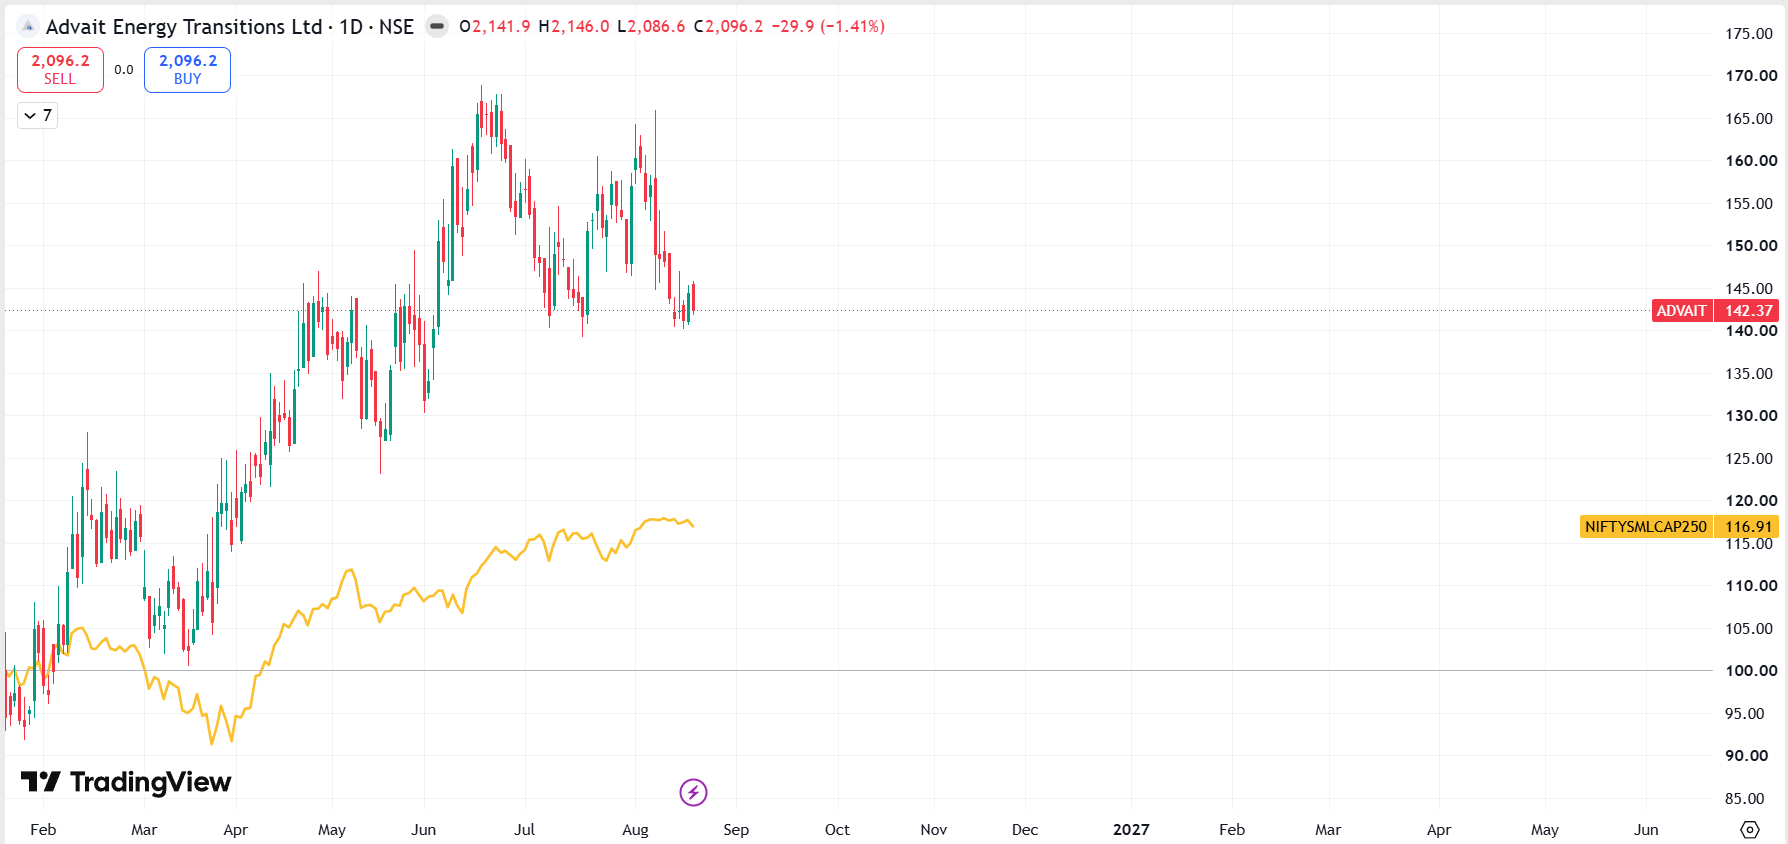
2.2 Advait Energy Transitions Limited Vs. NFTYSMLCAP250:
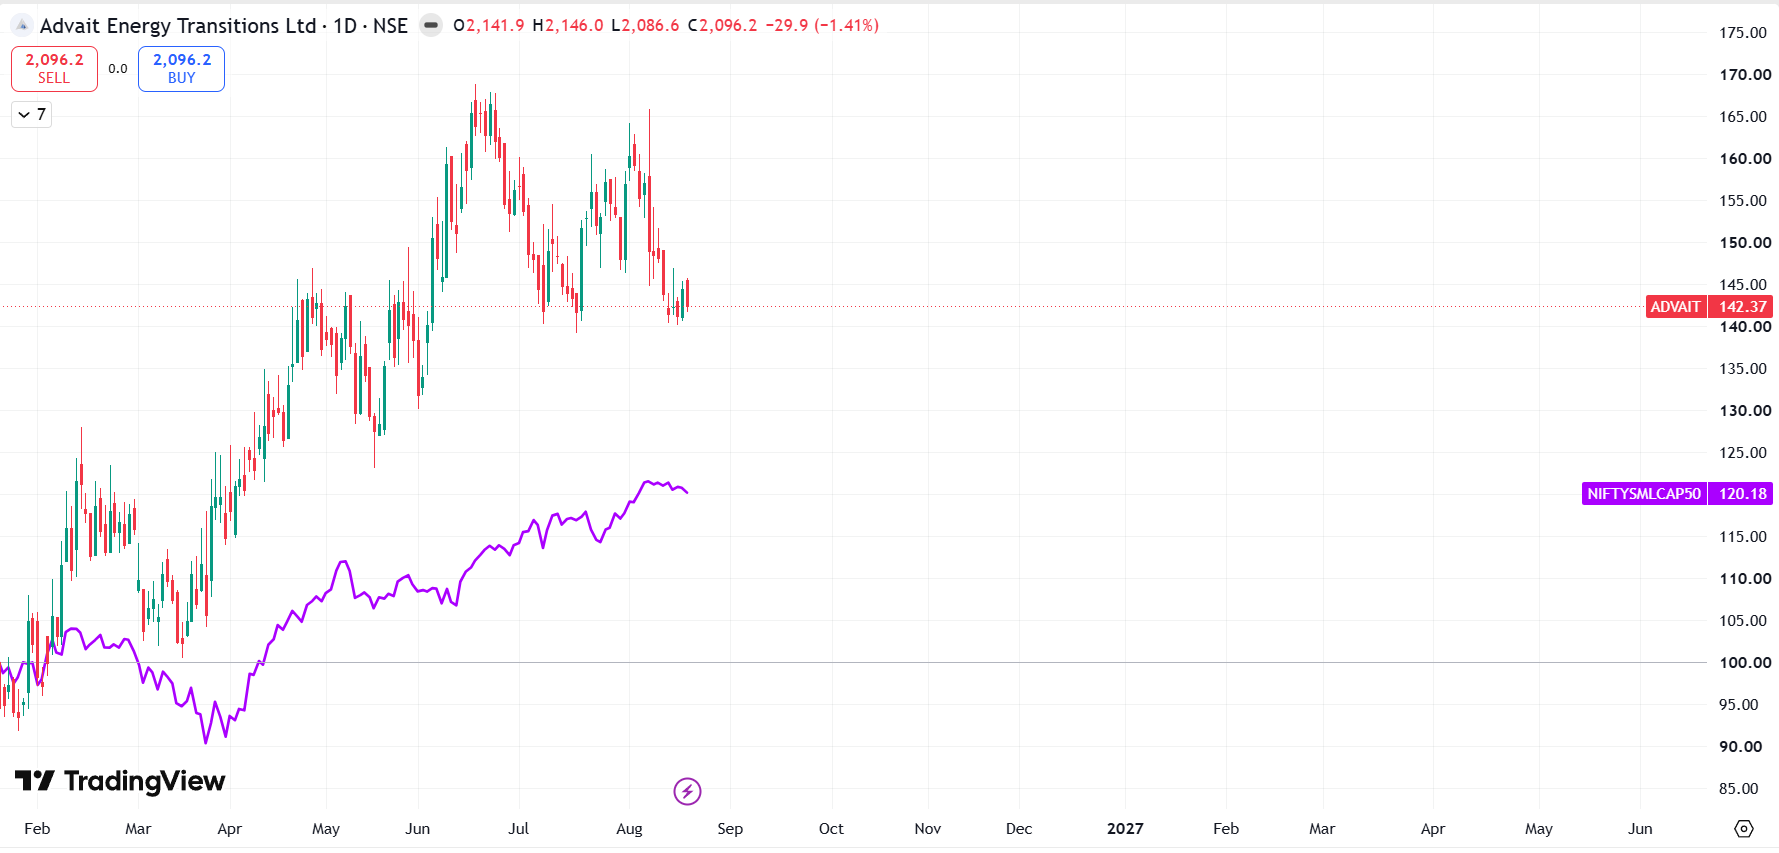
2.3 Advait Energy Transitions Limited Vs. NFTYSMLCAP50:
Advait Energy Transitions Ltd. is an integrated power transmission and clean-energy solutions company that provides products and end-to-end solutions for power transmission, substations and renewable energy. The company has evolved from its traditional transmission-infrastructure business into newer areas such as solar EPC, battery energy storage and green hydrogen.
3.1 BUSINESS SEGMENTS:
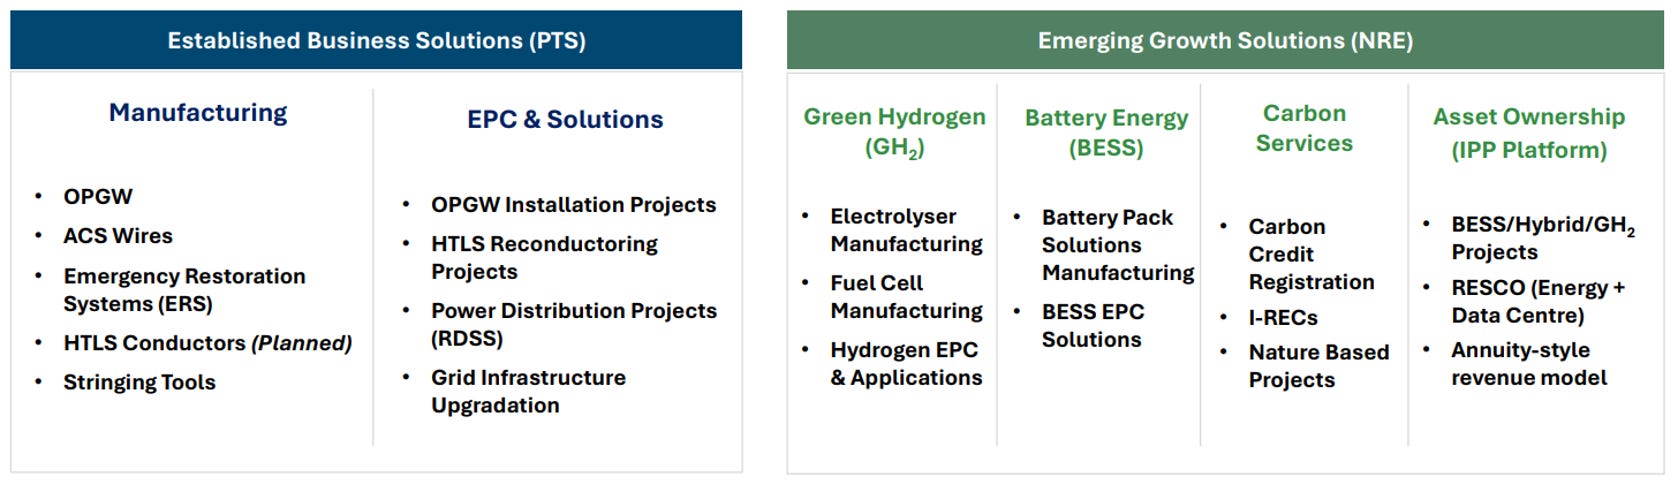
The company can broadly be understood through two primary segments: Power Transmission Solutions (PTS) and New & Renewable Energy (NRE).
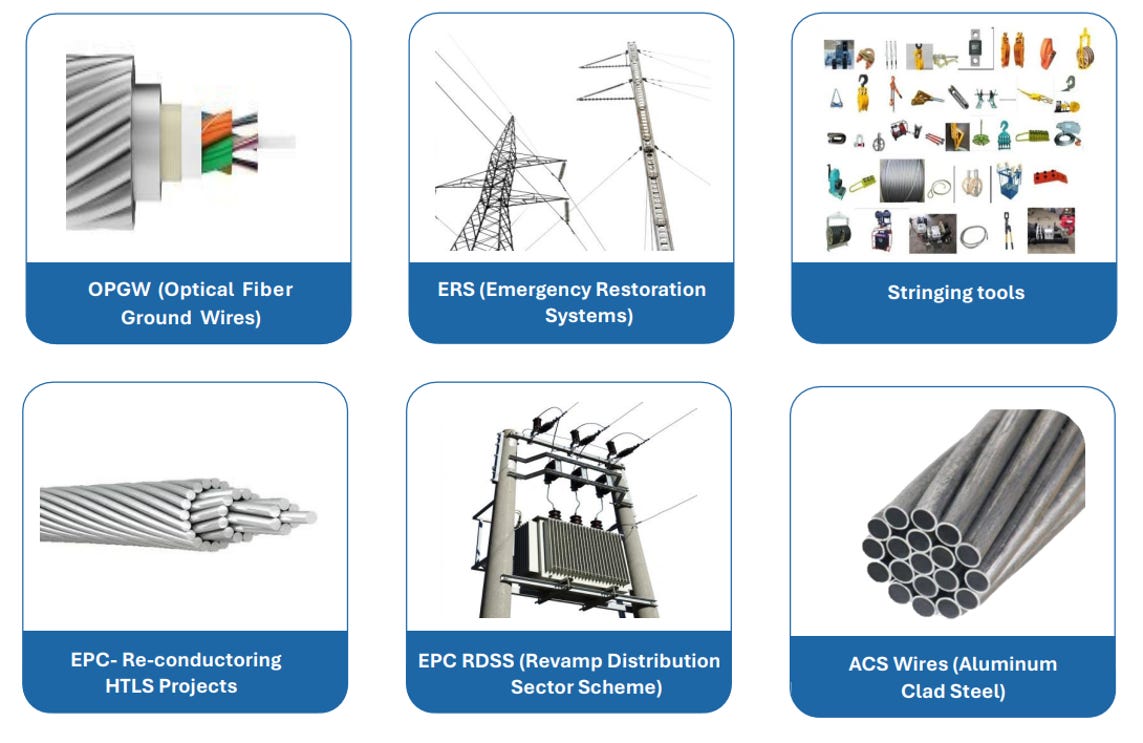
1. Power Transmission Solutions: The Power Transmission Solutions segment focuses on products and EPC services used in electricity transmission and distribution infrastructure. It covers the manufacturing and supply of products such as OPGW, aluminium-clad steel wires, emergency restoration systems and stringing tools, along with specialised EPC services for activities such as OPGW installation, HTLS reconductoring and distribution-system projects. In simple terms, this segment helps build, strengthen, maintain and restore power transmission networks.
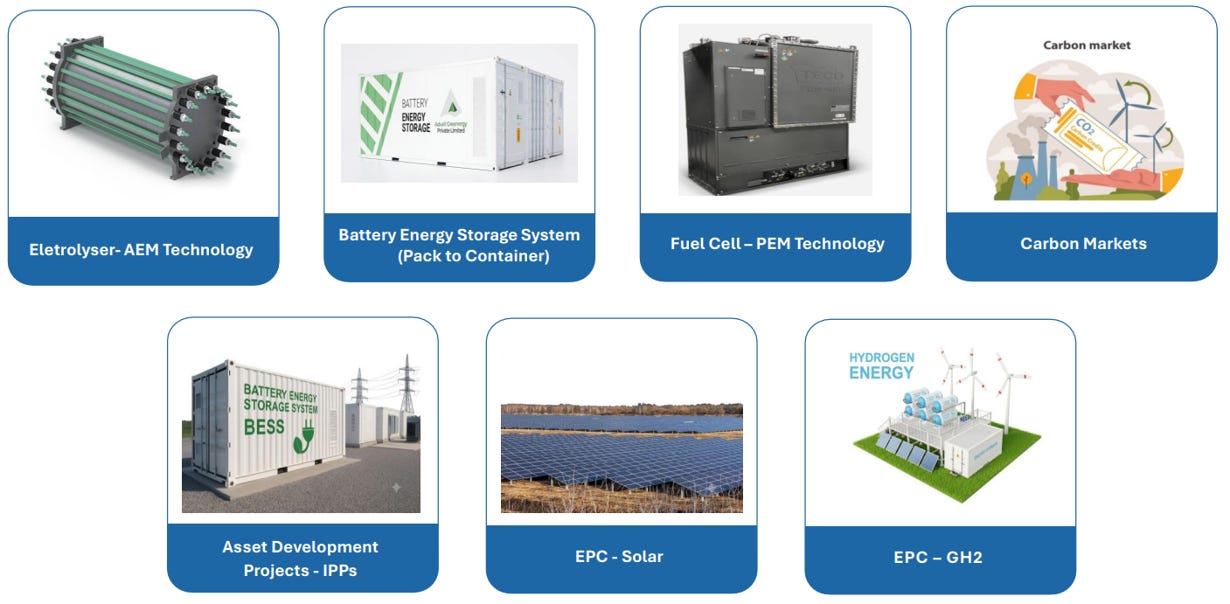
2. New & Renewable Energy: The New & Renewable Energy segment focuses on clean-energy technologies and solutions. It includes solar EPC projects, battery energy storage systems, green hydrogen solutions involving electrolysers and fuel cells, and sustainability-related services such as carbon-market solutions. The segment is aimed at providing solutions across the emerging renewable energy and energy-transition ecosystem.
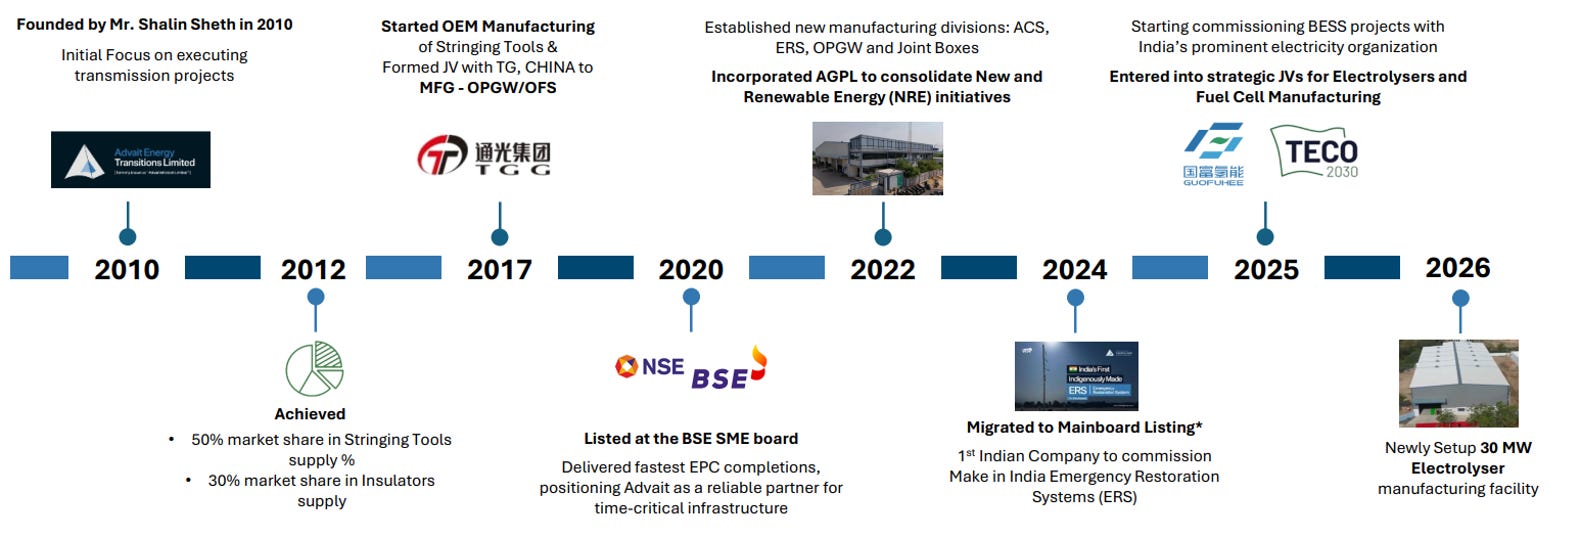
3.2 Company Journey
3.3 Business & Subsidiary Structure
3.4 Business Segments
3.5 Power Transmission Solutions (PTS)
3.6 New and Renewable Energy (NRE)
3.7 Production Facilities
(Read detailed Quarterly Analysis in the Premium Version)
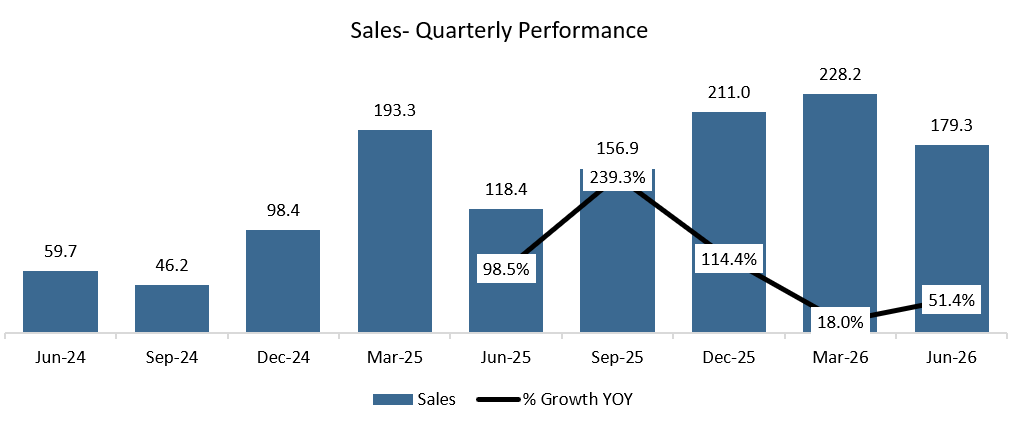
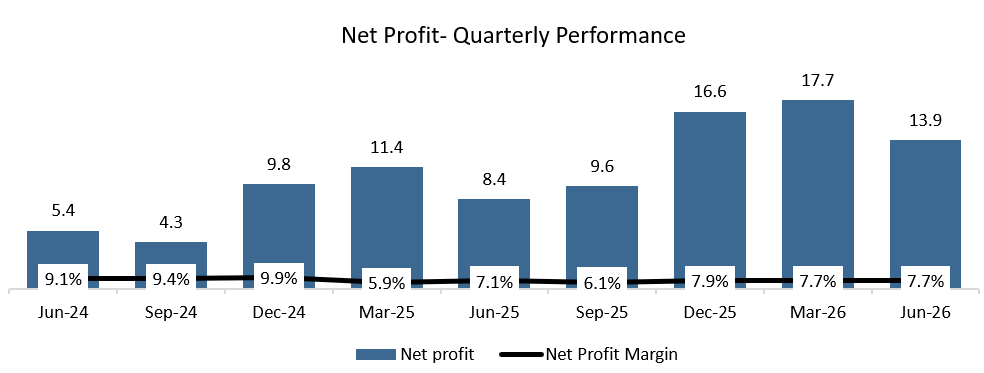
Growing at a CGR of 14.7% in last 9 Quarters.
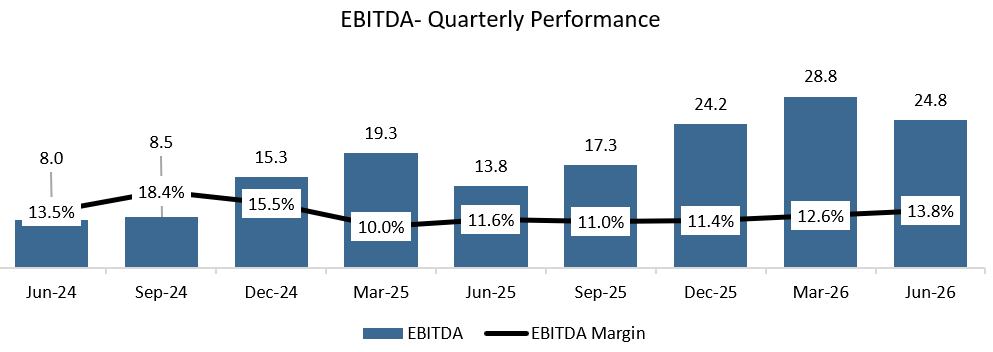
Growing at a CGR of 15.1% in last 9 Quarters.
Growing at a CGR of 12.4% in last 9 Quarters.
(Read detailed Annual Analysis and Forecasts in the Premium Version)
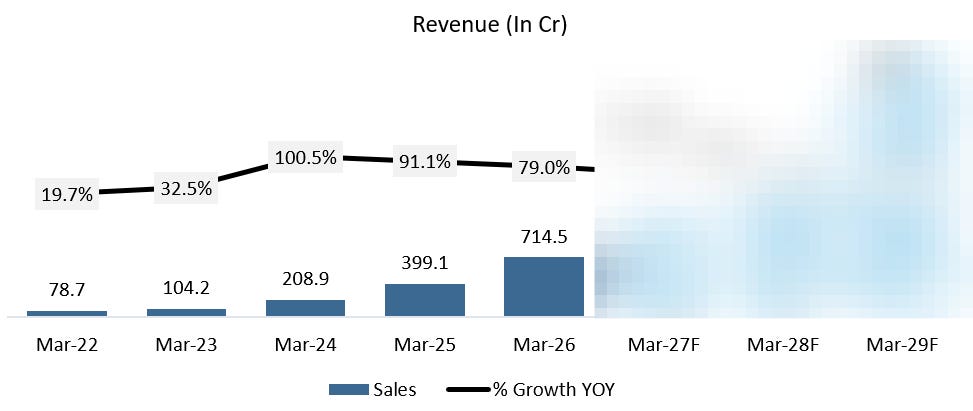
5Y CAGR: 73.6%
Reason behind exponential revenue growth over these 5 years
The order book has scaled in step with revenue, crossing ₹1,000 cr through FY26 and growing 159% YoY in FY26 alone, giving management strong forward visibility to convert into billing. The single largest driver within this has been the DISCOM EPC business. Power DISCOM projects alone contributed ₹223 cr in FY26, up 145% YoY, and now account for 50% of PTS division revenue. Management has flagged DISCOM EPC as the key growth driver for the group, contributing 46% of the incremental revenue growth in FY26.
Alongside this, the company steadily broadened its product and project base within PTS, from stringing tools and insulators (its original niches) into manufactured products like OPGW, ACS wires, ERS and HTLS reconductoring, each of which opened new revenue pools. The NRE division layered on top of this from FY24 onward, adding solar EPC and BESS EPC revenue that did not exist in the base years.
Essentially, the growth is a combination of secular tailwinds in India’s grid and distribution capex (RDSS, DISCOM upgrades), the company’s own capacity and qualification building that allowed it to bid for larger EPC tickets, and diversification into the NRE vertical layered on top of an already scaling PTS base.
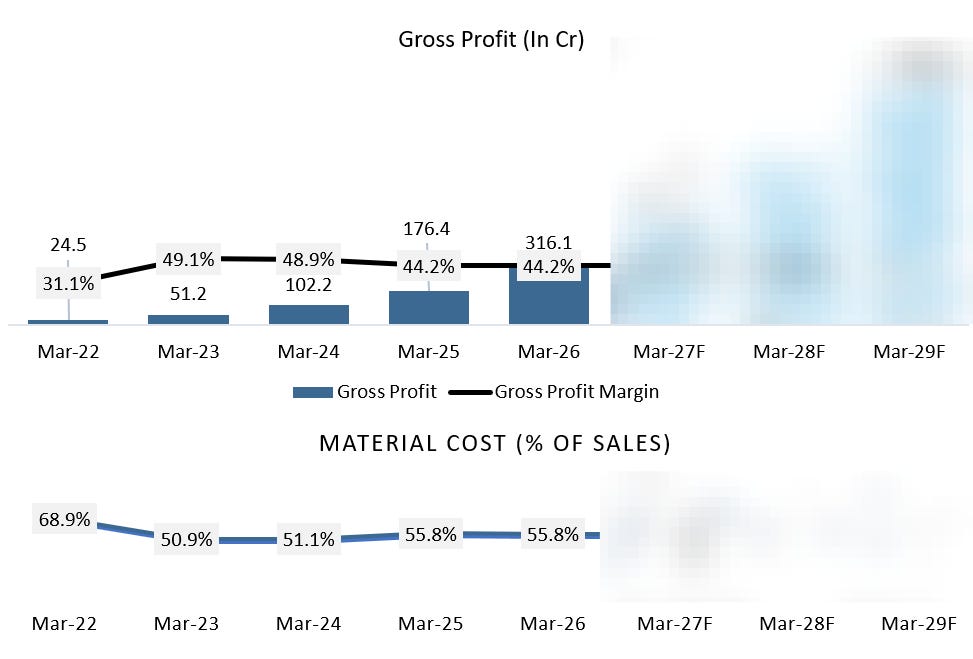
5Y CAGR: 89.6%
Gross margin (based on material cost) moved from 48.9% in FY24 to 44.2% in both FY25 and FY26, with material cost as a percentage of sales rising from 51.1% to 55.8% over the same period.
This is primarily a mix effect. As DISCOM EPC and other execution-heavy, materials-intensive project revenue (Power DISCOM projects, OPGW live line installation) grew to dominate the PTS revenue base, replacing manufactured, higher value-add products in the mix, material cost intensity naturally rose. EPC and installation work is inherently more pass-through in nature, with the company supplying and installing bought-out or lower-margin components, compared to manufactured products like ACS, OPGW cables, and stringing tools where in-house processing adds more value per rupee of revenue.
Management has also pointed to commodity cost inflation as a contributing factor. On the Q4FY26 call, they specifically noted that FY26 saw very high growth in the prices of metals, fuel, and other input costs, which compressed industry-wide margins, and that pass-through clauses for commodity price increases exist in some businesses (conductor, transformer supply) but not others (OPGW supply specifically was called out as lacking this clause).
The FY22 figure of 68.9% material cost (and correspondingly high 31.1% gross margin reading, which is unusual given it’s the lowest revenue year) reflects the smaller, more trading-oriented base in that year and shouldn’t be read as part of a consistent trend; the more relevant comparison is the FY24 to FY26 mix shift toward EPC-heavy, materials-intensive revenue.
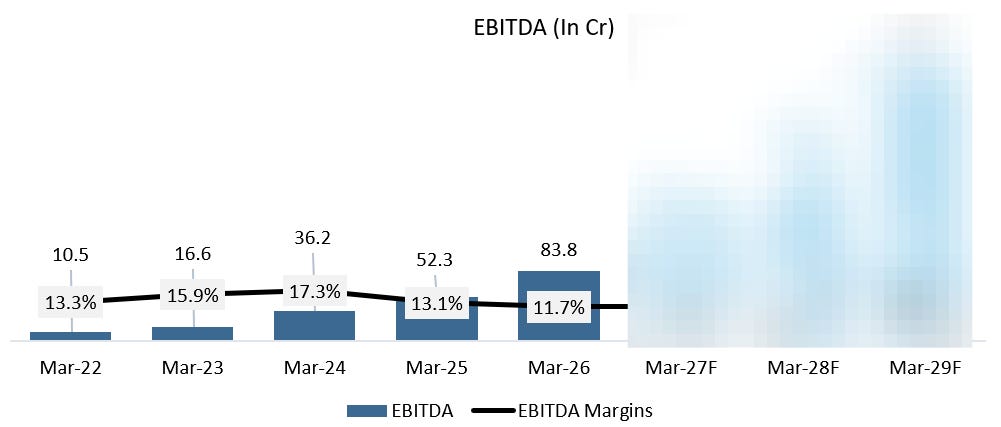
5Y CAGR: 68.1%
EBITDA margin declined from 17.3% in FY24 to 13.1% in FY25 and further to 11.7% in FY26, a cumulative drop of roughly 5.6 percentage points.
This decline flows directly from the gross margin compression discussed above, since a materials-intensive, EPC-heavy revenue mix carries through to the EBITDA line unless offset by cost efficiencies elsewhere. Management has also repeatedly attributed part of this to the NRE division being in a deliberate capability and qualification building phase.
Getting qualified for larger EPC tenders (solar, BESS) has required taking on early projects at compressed or even sub-scale margins to build the track record needed for better-margin work later. Management guided on the Q3FY26 and Q4FY26 calls that this qualification-building phase is largely behind the company now, with the group targeting roughly 1 percentage point of margin improvement in FY27 and a return toward the 13% to 17% historical EBITDA margin band over the next two to three years as the mix normalizes and new in-house manufacturing capacity (Gangad facility, expected Q4FY27) reduces reliance on lower-margin outsourced or trading-type work.
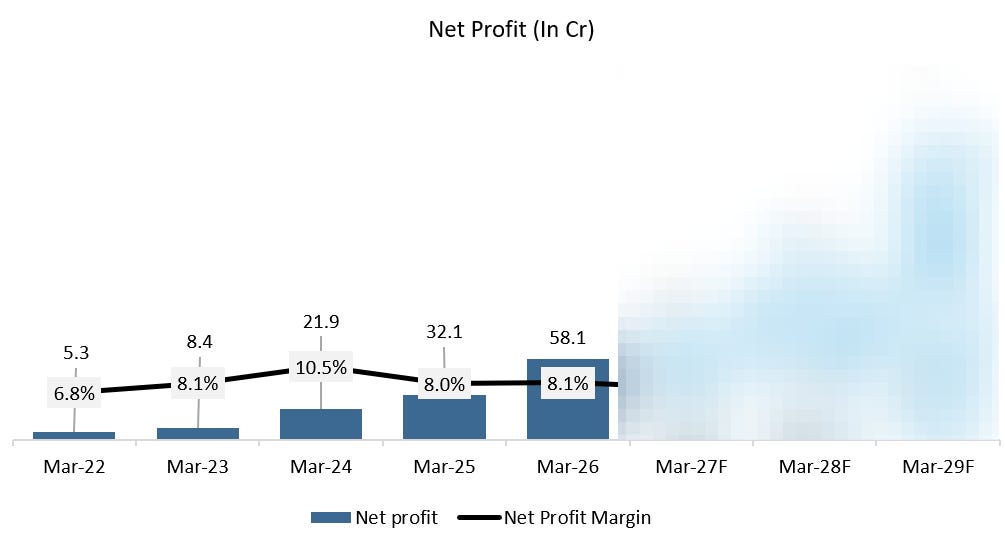
5Y CAGR: 81.8%
PAT margin has been notably more resilient than EBITDA margin, moving only marginally from 8.0% in FY25 to 8.1% in FY26, despite EBITDA margin falling by 1.4 percentage points over the same period, and standing only modestly below the 10.5% seen in FY24 even though EBITDA margin fell by 5.6 percentage points since then.
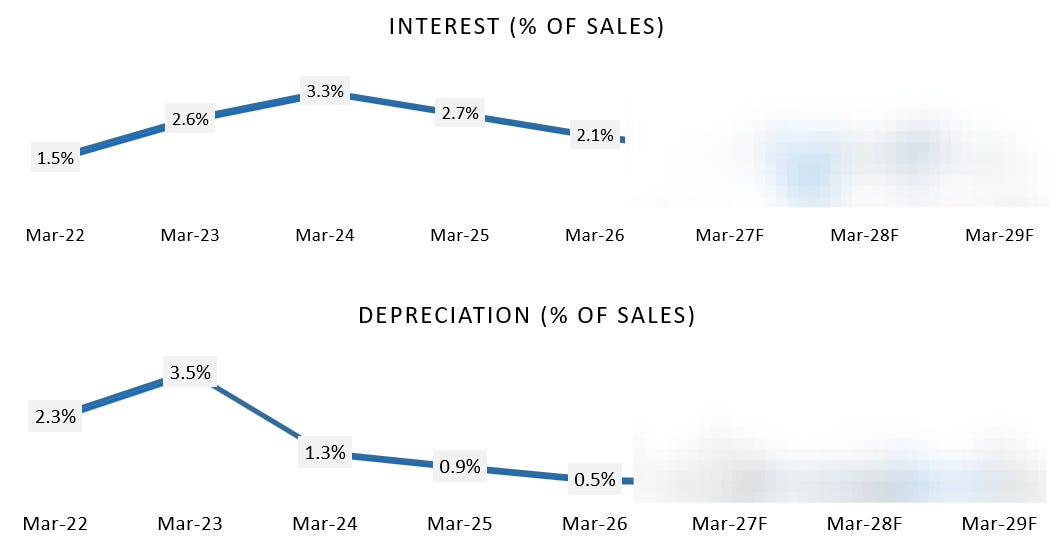
A few factors explain this gap. Other income has grown faster than revenue, from ₹7 cr (1.7% of sales) in FY25 to ₹13 cr (1.8% of sales) in FY26, and has nearly doubled since FY24, providing a cushion below the operating line. Depreciation and interest have also grown slower than revenue in percentage terms; depreciation fell from roughly 1.4% of sales in FY24 to under 1% in FY26, since the asset base has not scaled at the same pace as billings, an effect of the company running relatively asset-light through this growth phase. This operating leverage below EBITDA has partly offset the margin pressure sitting at the gross and EBITDA level.
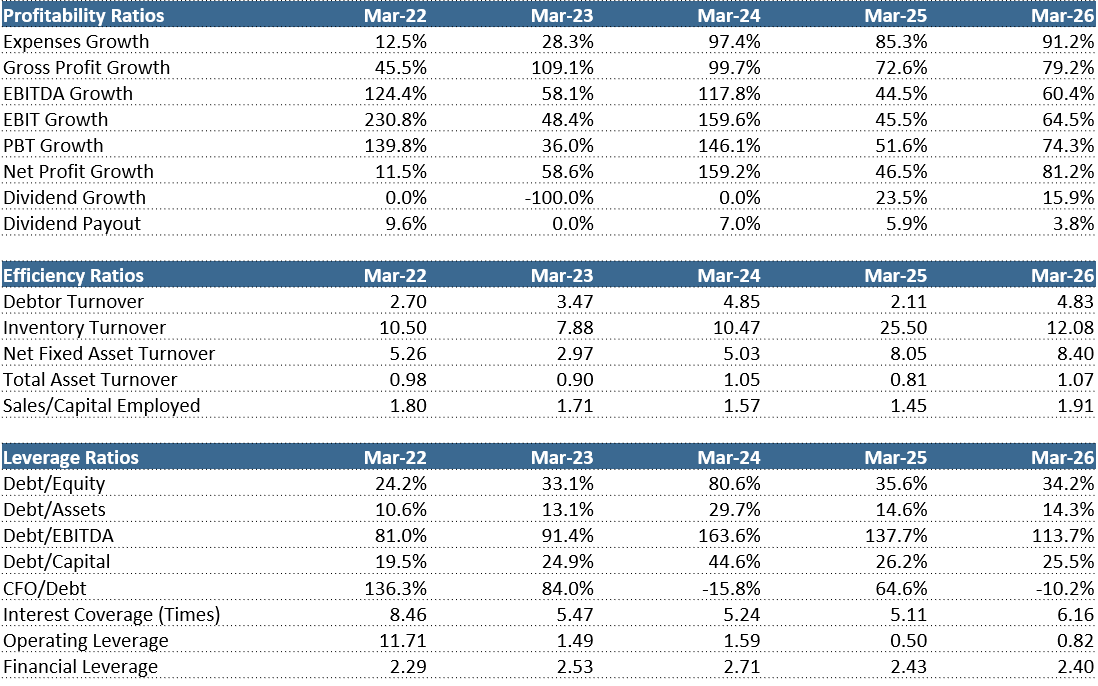
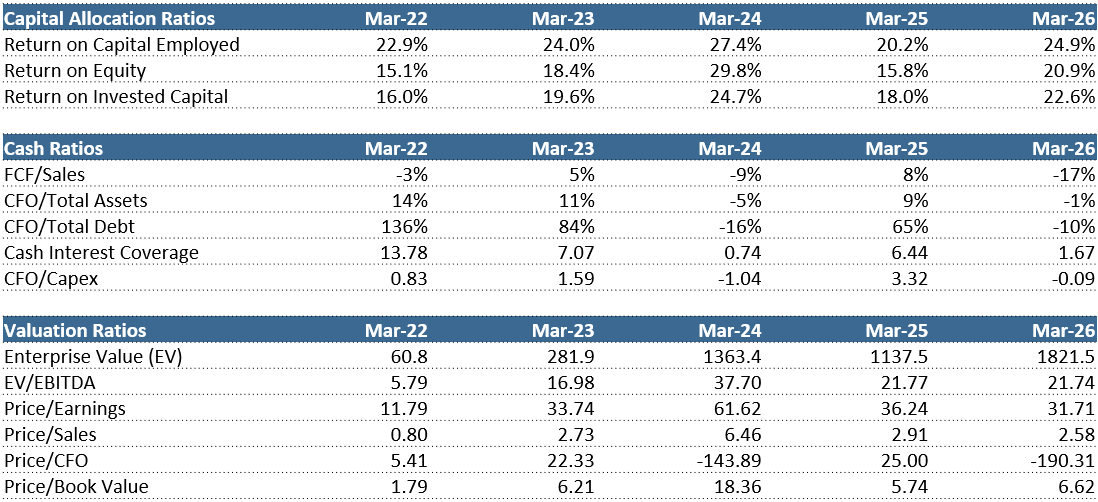
That said, this cushion is likely to compress going forward. The Gangad facility (₹300 to 350 cr of FY27 capex) and the debt taken to fund it (debt to equity already moved from 0.23x to 0.46x through FY26) will bring higher depreciation and interest charges into the P&L from FY27 and FY28 onward. So while PAT margin has held up well through FY26, we would flag it as more a function of below-the-line cushioning than genuine operating strength, and its trajectory will depend on whether the anticipated EBITDA margin recovery in FY27-28 outpaces the coming step-up in depreciation and finance costs from the new capacity.
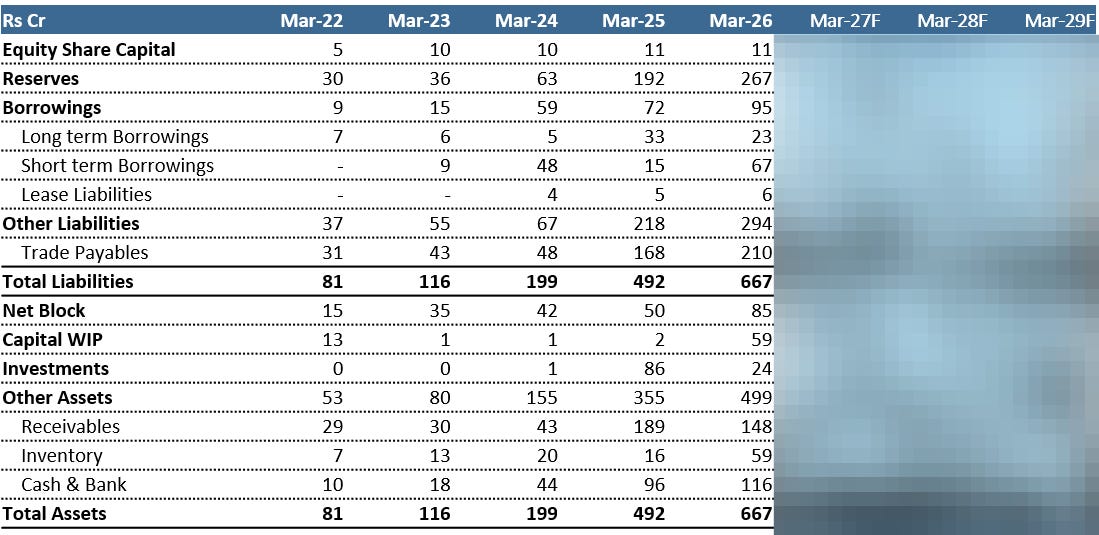
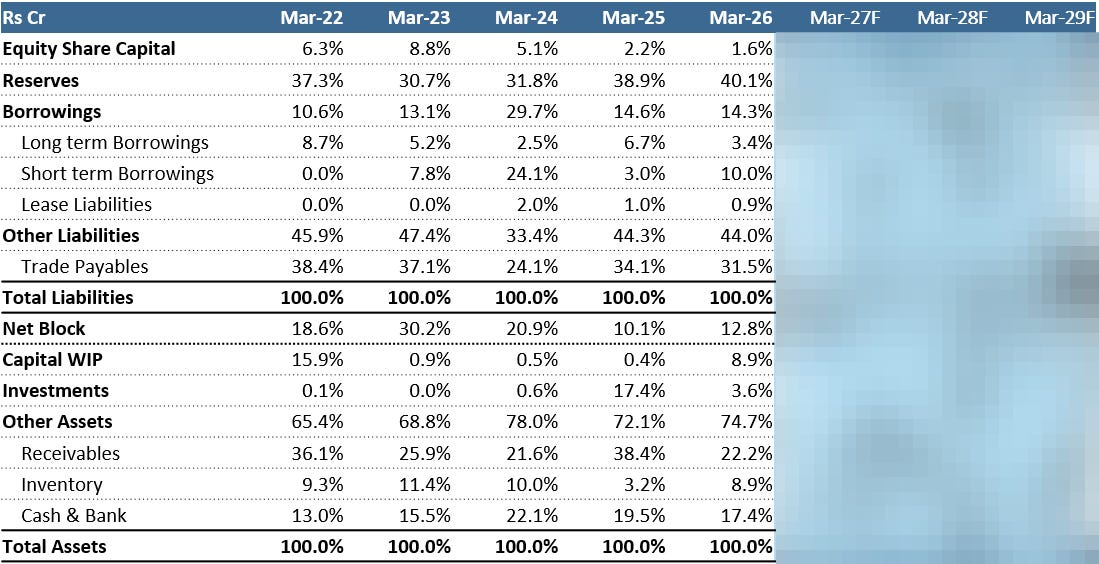
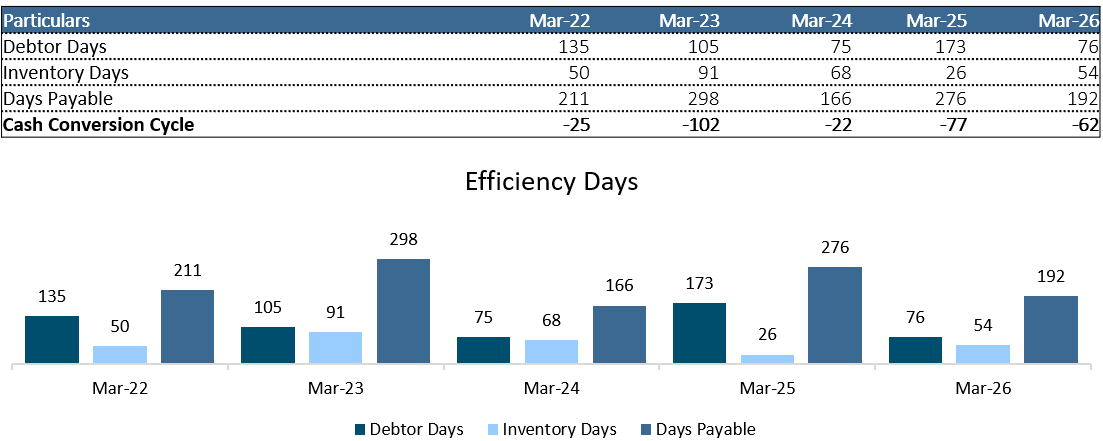
The Balance sheet is quite stable. Nothing to Point out which is out of the ordinary.
Some Positives:
The company sets on a cash surplus thus has stayed net debt negative for last 2 years.
Receivables as % of total Assets has gone down which is good for the business. This means there is not much issues in receiving payments from the customers, freeing up cash for future opportunities.
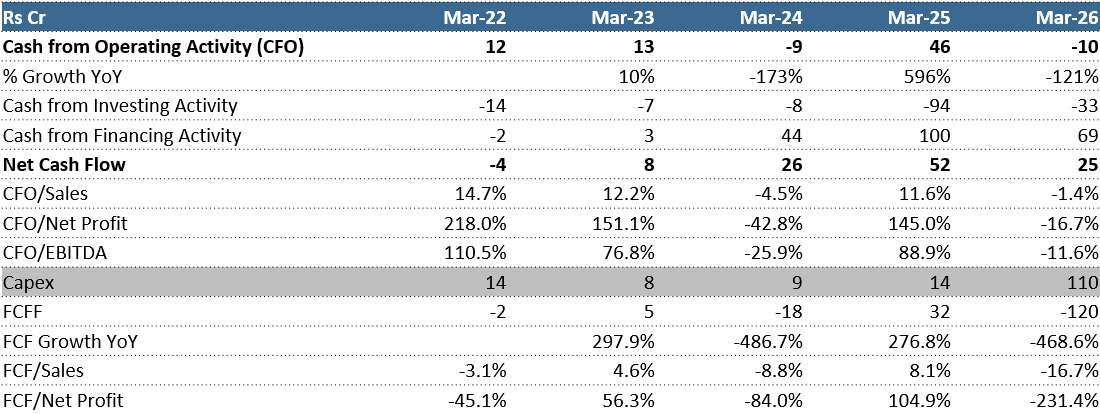
Cash from Operating Activities
Net CFO turned negative to -₹9.68 cr in FY26 from ₹45.59 cr in FY25, even as operating profit before working capital changes improved to ₹87.50 cr from ₹56.27 cr. The entire reversal sits in working capital. Other current assets swung to a -₹77.92 cr outflow (from just -₹0.55 cr), the single largest drag, alongside inventory reversing to a -₹45.35 cr build (from +₹8.11 cr) and other non-current assets moving to -₹41.90 cr (from +₹1.60 cr).
Trade receivables actually improved to +₹39.35 cr (from -₹23.59 cr), and payables rose to +₹52.34 cr (from -₹9.07 cr), but neither was enough to offset the buildup elsewhere. Income tax paid also stepped up to -₹16.82 cr from -₹1.03 cr. This mirrors the standalone pattern but is amplified at the consolidated level, largely reflecting AGPL’s own working capital build as it scaled BESS and solar EPC execution.
Cash from Investing Activities
CFI outflow narrowed to -₹33.33 cr from -₹63.11 cr, but the composition changed sharply. Capex jumped to -₹112.57 cr in FY26 (from -₹6.92 cr), consistent with active spend on Gangad and PTS/NRE capacity expansion group-wide. This was funded by ₹60.66 cr from sale of investments, redeploying the -₹60.50 cr invested in FY25, alongside a much smaller fresh investment outflow of -₹8.91 cr (from -₹60.50 cr).
Cash from Financing Activities
CFF inflow was broadly stable at ₹68.51 cr versus ₹63.93 cr, but the funding mix shifted toward debt. Equity share capital and premium inflows fell to ₹27.68 cr from ₹93.20 cr (FY25 included the larger group-level equity raise), while short-term borrowings contributed ₹52.07 cr (from a -₹26.70 cr repayment in FY25). Finance costs paid rose to -₹15.09 cr from -₹9.56 cr.
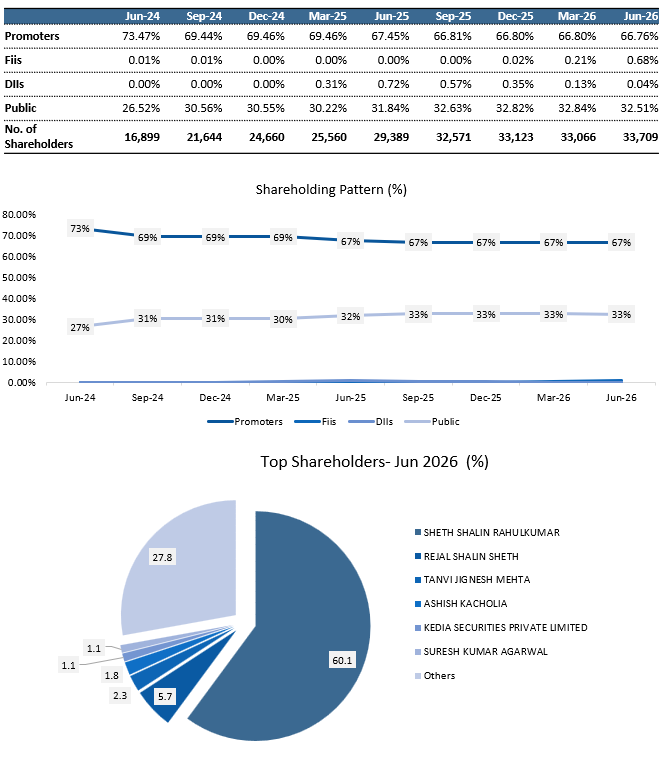
In Last 2 years, majority of liquidation from Management has been absorbed by Pubic. Although there is nothing to worry here but a concern would be there as high public holding means more volatility.
You know, we have 3 Tiers to Our Offerings:
I am just starting out! – ₹999/month (Monthly Plan)
I know what I am doing! – ₹2,699/quarter (~₹899/month, Best Value)
I want to create wealth – ₹11,999/year (~₹999/month, Plus You get all access to all reports prepared till date)
You can start with any and can upgrade in between with no additional charges.
To know more, you can reach out to us at:
Email: team@equityedgereaearch.in
Ph No: +91 88590 79630
Please Continue….
1. Strategic Initiatives & Growth Levers
Advait is executing its “Phase III” playbook (2026 onwards) to target high-margin opportunities across energy transition value chains.
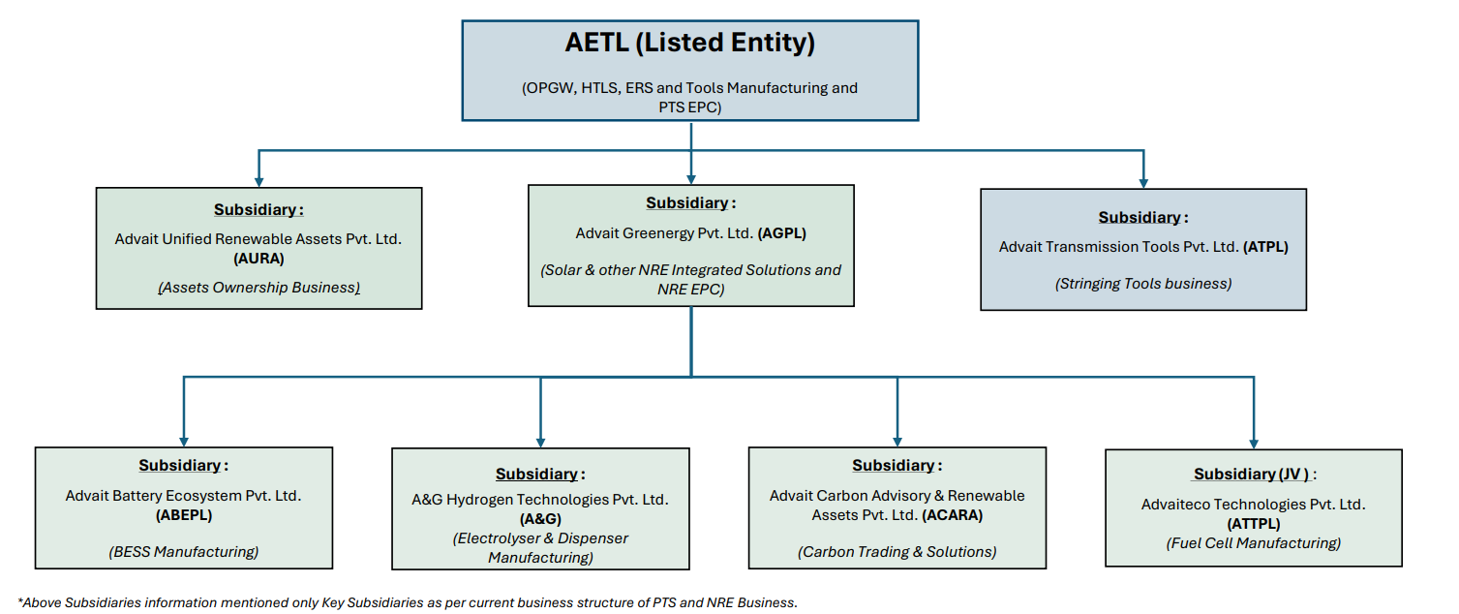
Restructured Group Platform: Advait Energy Transitions Limited (AETL) remains the listed entity focusing on core OPGW, HTLS, ERS, Tools manufacturing, and PTS EPC.
Key dedicated subsidiaries are established for focused execution:
Advait Greenergy Pvt. Ltd. (AGPL): Handles Solar and New & Renewable Energy (NRE) EPC.
Advait Unified Renewable Assets Pvt. Ltd. (AURA): Manages the Asset Ownership Business.
Advait Battery Ecosystem Pvt. Ltd. (ABEPL): Dedicated to Battery Energy Storage System (BESS) manufacturing.
A&G Hydrogen Technologies Pvt. Ltd.: Focuses on electrolyser and hydrogen dispenser manufacturing.
Advaiteco Technologies Pvt. Ltd. (Strategic JV): Targets localized Fuel Cell manufacturing.
Unexecuted Order Book (UOB) Expansion: The total order book crossed Rs. 1,330.1 crores as of June 30, 2026, representing a 97% YoY growth from Rs. 676.6 crores in Q1 FY26. The composition of the order book is well-balanced: PTS Division (71%) and NRE Division (29%). During Q1 FY27, the company secured a fresh order inflow of approximately Rs. 255 crores (including L1 positions), with an expected order inflow target of Rs. 1,600 - 1,650 crores for the full year FY27.
Technological Capabilities and Verifications: Successfully localized the Balance of Plant (BOP) engineering of electrolyser systems up to 100 MW. Successfully demonstrated live testing of a 5 MW electrolyser test batch to over 13 leading green hydrogen players in India, making AETL the first Indian company to conduct such testing and achieve a verified Specific Energy Consumption (SEC) score.
2. Capacity & Manufacturing Facilities
To support the next phase of growth, AETL is constructing a new fully integrated, automated manufacturing facility in Gujarat.
Existing Production Units:
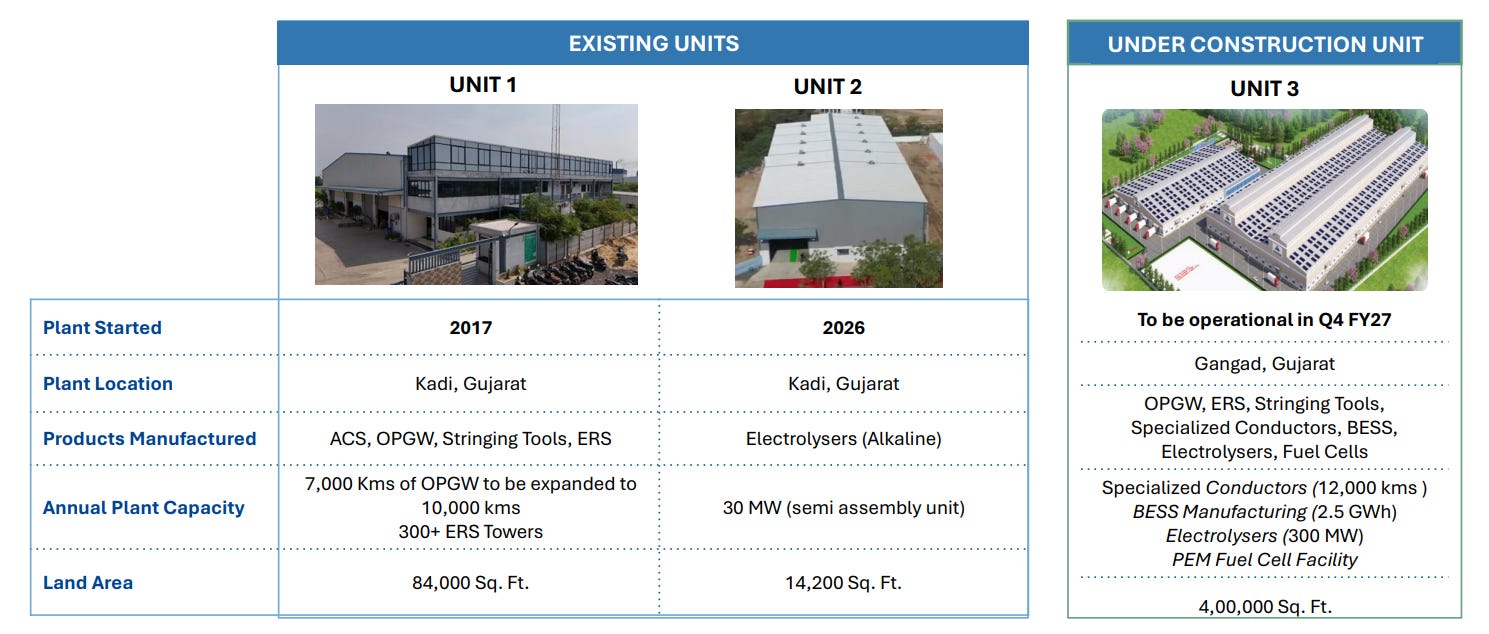
Unit 1 (Kadi, Gujarat): Operational since 2017 (84,000 sq. ft. land area). Produces ACS, OPGW, Stringing Tools, and ERS. Plant capacity is being expanded from 7,000 km to 10,000 km of OPGW and can produce 300+ ERS towers annually.
Unit 2 (Kadi, Gujarat): Opened in 2026 (14,200 sq. ft. land area). Houses a 30 MW semi-assembly unit for Alkaline Electrolysers.
Under-Construction Consolidation Unit:
Unit 3 (Gangad, Gujarat): Expected to be fully operational by Q4 FY27 across a land area of 4,00,000+ sq. ft.
This facility will consolidate manufacturing for both PTS and NRE businesses, creating capacity for Specialized Conductors (12,000 ckm), BESS Manufacturing (2.5 GWh), Electrolysers (300 MW) & PEM Fuel Cell Facility.
3. Segmental Analysis & Key Developments
The company’s performance is split across its established Power Transmission Solutions (PTS) division and the emerging New and Renewable Energy (NRE) division.
Power Transmission Solutions (PTS) Divisional Performance:
Power DISCOM Projects: Generated Rs. 49.50 crores (38% of segment revenue, +97% YoY). Completed projects covering ~800 ckm for DGVCL under the VKY-II Scheme (order value of Rs. 50 crores).
Reconductoring HTLS Projects: Generated Rs. 34.34 crores (27% of segment revenue, +41% YoY). Completed GETCO projects covering ~29 ckm (order value of Rs. 18 crores).
Stringing Tools: Contributed Rs. 19.36 crores (15% of segment revenue, +61% YoY). Secured a healthy pipeline of Rs. 14.3 crores during the quarter.
OPGW Live-Line Projects: Generated Rs. 11.67 crores (9% of segment revenue, +119% YoY). Completed GETCO projects covering 1,590 km (order value of Rs. 58 crores).
ACS - OPGW (Product): Contributed Rs. 9.82 crores (8% of segment revenue, +47% YoY). Received OPGW product supply approval from PGCIL and a fresh supply order from MPPTCL (Rs. 4.7 crores).
Emergency Restoration Systems (ERS): Contributed Rs. 2.53 crores (2% of segment revenue). Successfully participated in major ERS supply tenders for GETCO, BSPTCL, and MPPTCL with a combined value of Rs. 134 crores.
New & Renewable Energy (NRE) / AGPL Standalone Performance:
AGPL recorded standalone revenue of Rs. 49.94 crores (+11% YoY from Rs. 44.98 crores in Q1 FY26). EBITDA stood at Rs. 3.90 crores (7.8% margin), and PAT was Rs. 3.03 crores (+78.7% YoY).
NRE Divisional Breakdown:
BESS EPC: Contributed Rs. 46.58 crores (93.27% of NRE revenue).
Solar EPC: Contributed Rs. 3.13 crores (6.27% of NRE revenue, down 92.86% YoY). Successfully completed a 67.5 MW Solar EPC project at Khavda, with commissioning planned for Q2 FY27.
Green Hydrogen EPC: Contributed Rs. 0.23 crores (0.46% of NRE revenue).
Carbon Advisory Division: Registered active clients across mobility, textile, and paper industries, and issued 63,000 I-RECs in a single month for a Nepal-based client.
4. Asset Ownership & Standalone BESS Projects
AETL is expanding its utility-scale battery energy storage business under a tariff-based competitive framework backed by Ministry of New and Renewable Energy (MNRE) Viability Gap Funding (VGF).
Radhanpur BESS Project (Ongoing):
Capacity: 50 MW / 100 MWh.
Location / Client: 220 kV Substation, Radhanpur, Patan (Gujarat) / GUVNL.
Technology / Connectivity: Advanced Lithium-ion Batteries (2 cycles/day) with 66 kV grid connectivity.
Government Support: Rs. 27 lakh/MWh Viability Gap Funding.
Expected COD: November 2026.
GUVNL BESS Project (Ongoing):
Capacity: 150 MW / 300 MWh.
Location / Client: 220 kV Substations, Bhesan, Junagadh (Gujarat) / GUVNL.
Connectivity: 220 kV Level.
Government Support: Rs. 18 lakh/MWh Viability Gap Funding.
Expected COD: November 2027.
5. Strategic Collaborations & MoUs
During the period, AETL entered into three critical MoUs to localize production and target large-scale energy transition tenders.
Cospower MoU: Entered into a strategic partnership to establish localized BESS container and battery pack manufacturing capabilities in India. The joint venture combines AETL’s capital and market presence with Cospower’s technology transfer capabilities.
Adaptive Engineering MoU: Advait Battery Ecosystems partnered with Adaptive Engineering to establish an integrated BESS manufacturing and solutions platform in India. This collaboration aims to localize battery assembly, EMS, SCADA integration, and lifecycle support.
Megha Engineering & Infrastructures Limited (MEIL) MoU: Formed a partnership to jointly bid for and execute domestic and international projects across transmission and distribution, BESS, green hydrogen, electrolysers, fuel cells, and solar EPC.
Strengths
Dominant Market Position: Holds ~50% domestic market share in stringing tools and ~30% in insulators, backed by 450+ completed projects, 25,000+ ckm of installations, and a presence across 45+ countries.
Indigenous ERS & Testing Capabilities: Pioneer in domestic ERS manufacturing for 33 kV–800 kV lines, supported by NABL-accredited testing facilities and vendor approvals from 10+ major utilities.
Scaled Manufacturing Infrastructure: Operates two Kadi facilities with expanding OPGW and ERS capacity, while the upcoming 400,000+ sq. ft. Unit 3 will consolidate operations and significantly enhance automation.
Global Technology Partnerships: Strategic MoUs and JVs with international and domestic players provide access to technology, manufacturing capabilities, BESS integration, fuel-cell expertise, and large-scale EPC opportunities.
Weaknesses
Public-Sector Concentration: Heavy dependence on state utilities and DISCOMs exposes the business to tender delays, administrative cycles, and prolonged RoW clearances.
High Working Capital Intensity: Project cycles of 6–18 months across transmission and distribution projects lock up working capital before milestone collections are realized.
Long Fuel-Cell Commercialization Cycle: Fully automated indigenous fuel-cell manufacturing requires 2–3 years to operationalize, delaying the transition to high-volume commercial production.
Executional Stretch Across Verticals: Simultaneous expansion across conductors, electrolysers, BESS, fuel cells, and renewable assets places considerable demands on management and engineering resources.
Opportunities
Ultra-High-Voltage Grid Expansion: India’s planned 1,150 kV transmission network creates significant demand for HTLS conductors, OPGW, ERS towers, and specialized stringing equipment.
Utility-Scale BESS Expansion: The planned 2.5 GWh BESS manufacturing base, scalable to 5 GWh, positions the company for large standalone storage and BOO opportunities.
Fuel Cells for Data Centers: Rising demand for green backup and continuous power could create a sizeable opportunity for PEM fuel-cell systems as data centers reduce diesel dependence.
BOO Renewable Asset Platform: Scaling AURA toward 1 GW initially and 5 GW eventually can build long-term annuity-like revenues through FDRE projects combining solar, wind, and storage.
Threats
Raw-Material & Energy Volatility: Unhedged exposure to aluminum-clad steel, alloys, structural steel, and fuel prices can pressure margins where contracts lack price indexation.
Regulatory & Localization Risks: Tightening domestic-content requirements for solar, BESS, and electrolysers could create supply bottlenecks, raise input costs, and delay projects.
Intense Competitive Bidding: Aggressive pricing from established infrastructure groups and global technology providers could compress margins across BESS, Solar EPC, and grid projects.
Grid Connectivity Delays: Delays in substations, grid approvals, and transmission connectivity could postpone CODs and affect returns from BOO renewable projects.
10.1 Paramount Communications Ltd.

Market Cap: ₹ 2,136 Cr.
Paramount Communications Ltd., headquartered in New Delhi, operates in the Wires & Cables Industry. The company manufactures power cables, railway cables, telecom cables, domestic wires, special cables and optical fibre cables, serving power, railways, telecom, infrastructure, defence, renewable energy and residential markets.
Business Model:
Paramount follows a manufacturing-led B2B and B2C model, supplying cables to infrastructure companies, government bodies, utilities, OEMs, distributors and retail customers.
Its portfolio covers power, railway, telecom, domestic and specialized cables, along with turnkey infrastructure services.
What Sets Them Apart:
Diversified Cable Portfolio: Presence across power, railways, telecom, renewables and domestic applications.
Railway Expertise: Established supplier of specialized railway signalling and power cables.
Export Presence: Supplies products to international markets, including the USA.
Integrated Capabilities: Combines cable manufacturing with specialized turnkey infrastructure solutions.
10.2 Dynamic Cables Ltd.
Market Cap: ₹ 2,182 Cr.
Dynamic Cables Ltd., headquartered in Jaipur, Rajasthan, operates in the Wires & Cables Industry. The company manufactures low, medium and high-voltage power cables, conductors, control & instrumentation cables, aerial bunched cables and railway signalling cables, serving utilities, EPC contractors, industrial customers and export markets.
Business Model:
Dynamic Cables follows a manufacturing-led B2B model, supplying cables and conductors for power transmission, distribution, railway and industrial applications.
Its product portfolio includes LV/MV/HV power cables, conductors, control & instrumentation cables and railway signalling cables.
Revenue is generated through:
Supplies to government and private DISCOMs.
Sales to EPC contractors and industrial customers.
Railway infrastructure projects.
Export sales to international markets.
What Sets Them Apart:
Power Infrastructure Focus: Strong presence in cables and conductors used across power transmission and distribution.
Diversified Applications: Exposure to power, railways, industrial and infrastructure sectors.
Integrated Manufacturing: Capability to manufacture a broad range of cables and conductors.
Export Presence: Supplies products to customers in international markets.
Comments
Nothing yet. Say the first thing.
Sign in to join the conversation.