
For all the attention data centres have received lately, it may surprise you to know that the average Australian data centre demand across Australia’s entire National Electricity Market (SA, Vic, Tassie, ACT, NSW, Qld) was around 63% (600 MW) that of one aluminium smelter’s average load (Tomago, 950 MW1).
We talk about data centres so much because aluminium load isn’t on track to 6x in the next 24 years.
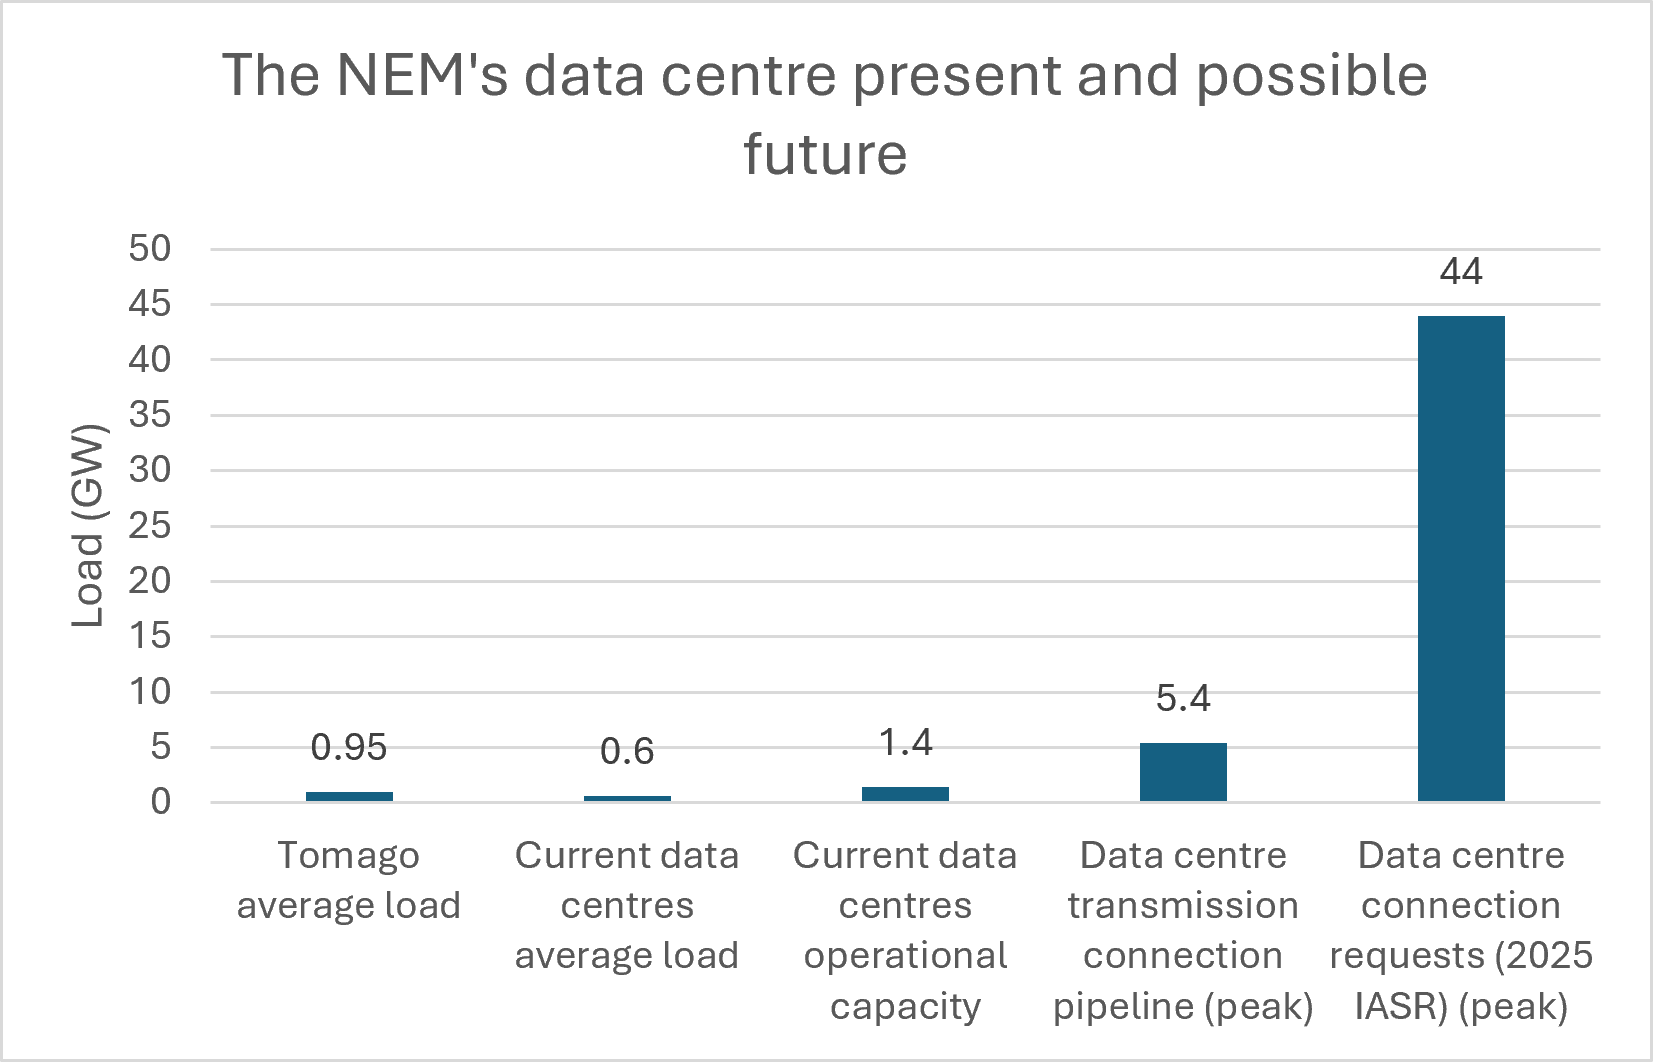
Tomago average load, current data centres load, current data centre operational capacity2, transmission connection pipeline numbers, connection requests numbers3.
For the first time, AEMO’s Quarterly Energy Dynamics report now includes data centre connection insights. As of the end of Q1 2026, 11 large-scale projects representing 5.4 GW of maximum demand were progressing through the transmission connection process — roughly 60% in NSW and 40% in Victoria.
Most of these projects are early stage — seven of the eleven (4.1 GW) are still at the application phase. If you’ve read my phantom demand post, you know how to discount a connection pipeline: Oxford Economics estimated 6 in every 7 MW of requests won’t materialise. Even the ones that connect will take time. AEMO says large data centres are targeting roughly two years from application to energisation, then ramping to full load over 5–10 years.
A key distinction between these two large loads are that smelters have a track record of providing flexibility to the grid. Tomago is interruptible. It can and has shed up to 600 MW within minutes under its supply contract with AGL during system stress events such as during heatwaves when everyone is running their air conditioner.
The jury is still out on how flexible data centres can and want to be. The most-cited case for optimism is Norris et al.’s Rethinking Load Growth, which estimated the existing US grid could absorb 76–98 GW of new large loads if those loads curtailed just 0.25–0.5% of their annual load. AEMO’s own analysis expects them to operate as relatively inflexible loads that prioritise uptime and reliability.
But flexibility doesn’t have to come from compute. Onsite generation (gas or diesel, but there are restrictions to where and how often these can run in Australia) or batteries can reduce grid draw without impacting compute, training runs could pause in ways you wouldn’t want for inference, and there’s potential to shift inference demand itself with incentive-based behaviour change, as I explored when I analysed Anthropic’s off-peak Claude promotion.
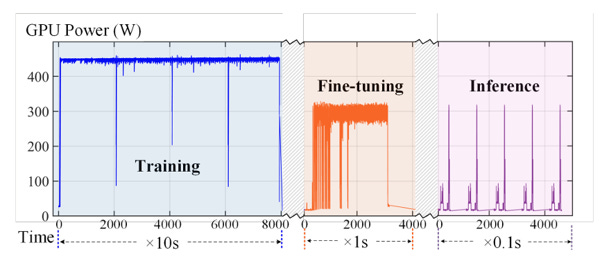
Illustration of the patterns of AI compute load (GPU power). From Chen et al 2025.
Thanks for reading! Subscribe for free to receive new posts and support my work.
All views are my own, and do not represent my current or previous employers. This analysis only uses publicly available information.
Operational capacity is the total IT load of data centre facilities that are fully built, fitted out, and available for use — a measure of installed capacity, not of how much power is actually being drawn at any given moment.
No posts
Comments
Nothing yet. Say the first thing.
Sign in to join the conversation.