
An Energy Nation simulation of new federal policies for major projects reveals they could provide a nudge rather than a fundamental shift for Canada’s major project pipeline. The combined impact of a two-year approval cap and enhanced Indigenous participation adds a potential $10.1 billion in total expected value (EV) across 364 projects in the Major Projects Inventory (MPI), but the benefits are highly concentrated.
Top-Line Impact: The combined policies produce an average project probability uplift of 2.4 percentage points and increase total MPI portfolio EV by approximately $10.1 billion (9 percent).
Approval Cap is Key Driver: The Major Projects Office (MPO) two-year approval cap is the more powerful policy lever, accounting for an $8.7 billion estimated EV uplift on its own, compared to $2.1 billion for the Indigenous participation overlay.
Energy and Oil & Gas Win Big: Modelled benefits are overwhelmingly concentrated in the Energy sector, which captures $9.3 billion of the total combined EV uplift. Oil and gas projects appear the clear winner, with upstream and downstream operations accounting for nearly half of all gains.
Alberta Sees Largest Gains: Geographically, Alberta stands out in every scenario, realizing the largest probability uplifts and dominating the EV gains.
Focus on “Marginal” Projects: The policies appear most effective for marginal projects that start with a 40 to 50 percent probability of success. The modest uplift is often enough to push these projects into better than even-money odds. This cohort alone accounts for 36 percent of the overall EV gains.
Limitations: All estimates are from counterfactual simulations, not predictions. The policies interventions do not turn a low-probability underdog into a favourite. The two-year cap guarantees only a decision, not an approval, and the reforms are unlikely to transform the entire project pipeline overnight.
On September 11, Prime Minister Carney laid out a deceptively simple promise. Canada will identify “nation-building” projects and run them through the new Major Projects Office (MPO) with a “one project, one review” approach and a firm two-year cap on federal approval decisions. In parallel, Ottawa is scaling up Indigenous equity participation by creating an Indigenous Advisory Council to guide the MPO and by doubling the federal Indigenous Loan Guarantee Program from $5 billion to $10 billion, alongside $40 million over two years to support Indigenous capacity to engage early and consistently on major projects. Together, these measures are meant to turn political ambition into steel-and-concrete results.
The key question is whether these policy initiatives will make a meaningful difference. To explore this, Energy Nation ran a series of simulations using its Unified Overlay Runner, a post-estimation tool that applies counterfactual policy overlays to the Major Projects Inventory (MPI). At its core, the model generates a probability-weighted measure of expected value (EV) and then applies policy “shocks” to estimate how those probabilities and values might shift.[1]
Two interventions were tested in the simulations. The first, the Indigenous participation overlay, modeled projects with Indigenous ownership or partnership as benefiting from a one-year reduction in time-to-construction timelines and a modest “hazard” multiplier, representing smoother passage through key regulatory milestones.[2] The second, the MPO approval cap overlay, applied a hard two-year limit on federal approval decisions, reflecting the “one project, one review” policy aim. The simulations tested three scenarios across 364 projects in the 2024 MPI preconstruction cohort: an Indigenous-only overlay, an MPO-only cap, and a combined run applying both in sequence.
In the Indigenous-only scenario, the average uplift was 0.8 percentage points, with 60 projects crossing a Breslow “knot,” a threshold where small time shifts can produce outsized effects. The mean increase in EV was $5.7 million per project, while the median was just $0.5 million, showing that most of the gains came from a handful of projects. Applied across the portfolio, the total EV uplift reached about $2.1 billion.
In the MPO-only scenario, projects were capped at a two-year federal approvals window. This produced an average probability uplift of 2.0 percentage points, with 223 projects crossing a knot. The mean increase in EV was $23.8 million per project, though the median was only $0.9 million, again underscoring the outsized role of a few projects. Scaled across the portfolio, the total EV uplift of the two-year cap was approximately $8.7 billion.
Finally, the combined scenario layered both interventions, applying the Indigenous overlay first and the MPO cap second. It produced the largest average uplift, 2.4 percentage points, with 223 projects crossing a knot, the same count as in the MPO-only case. The mean EV increase was $28 million per project, and the median rose to $3 million. On a portfolio basis, the total uplift reached about $10.1 billion.[3]
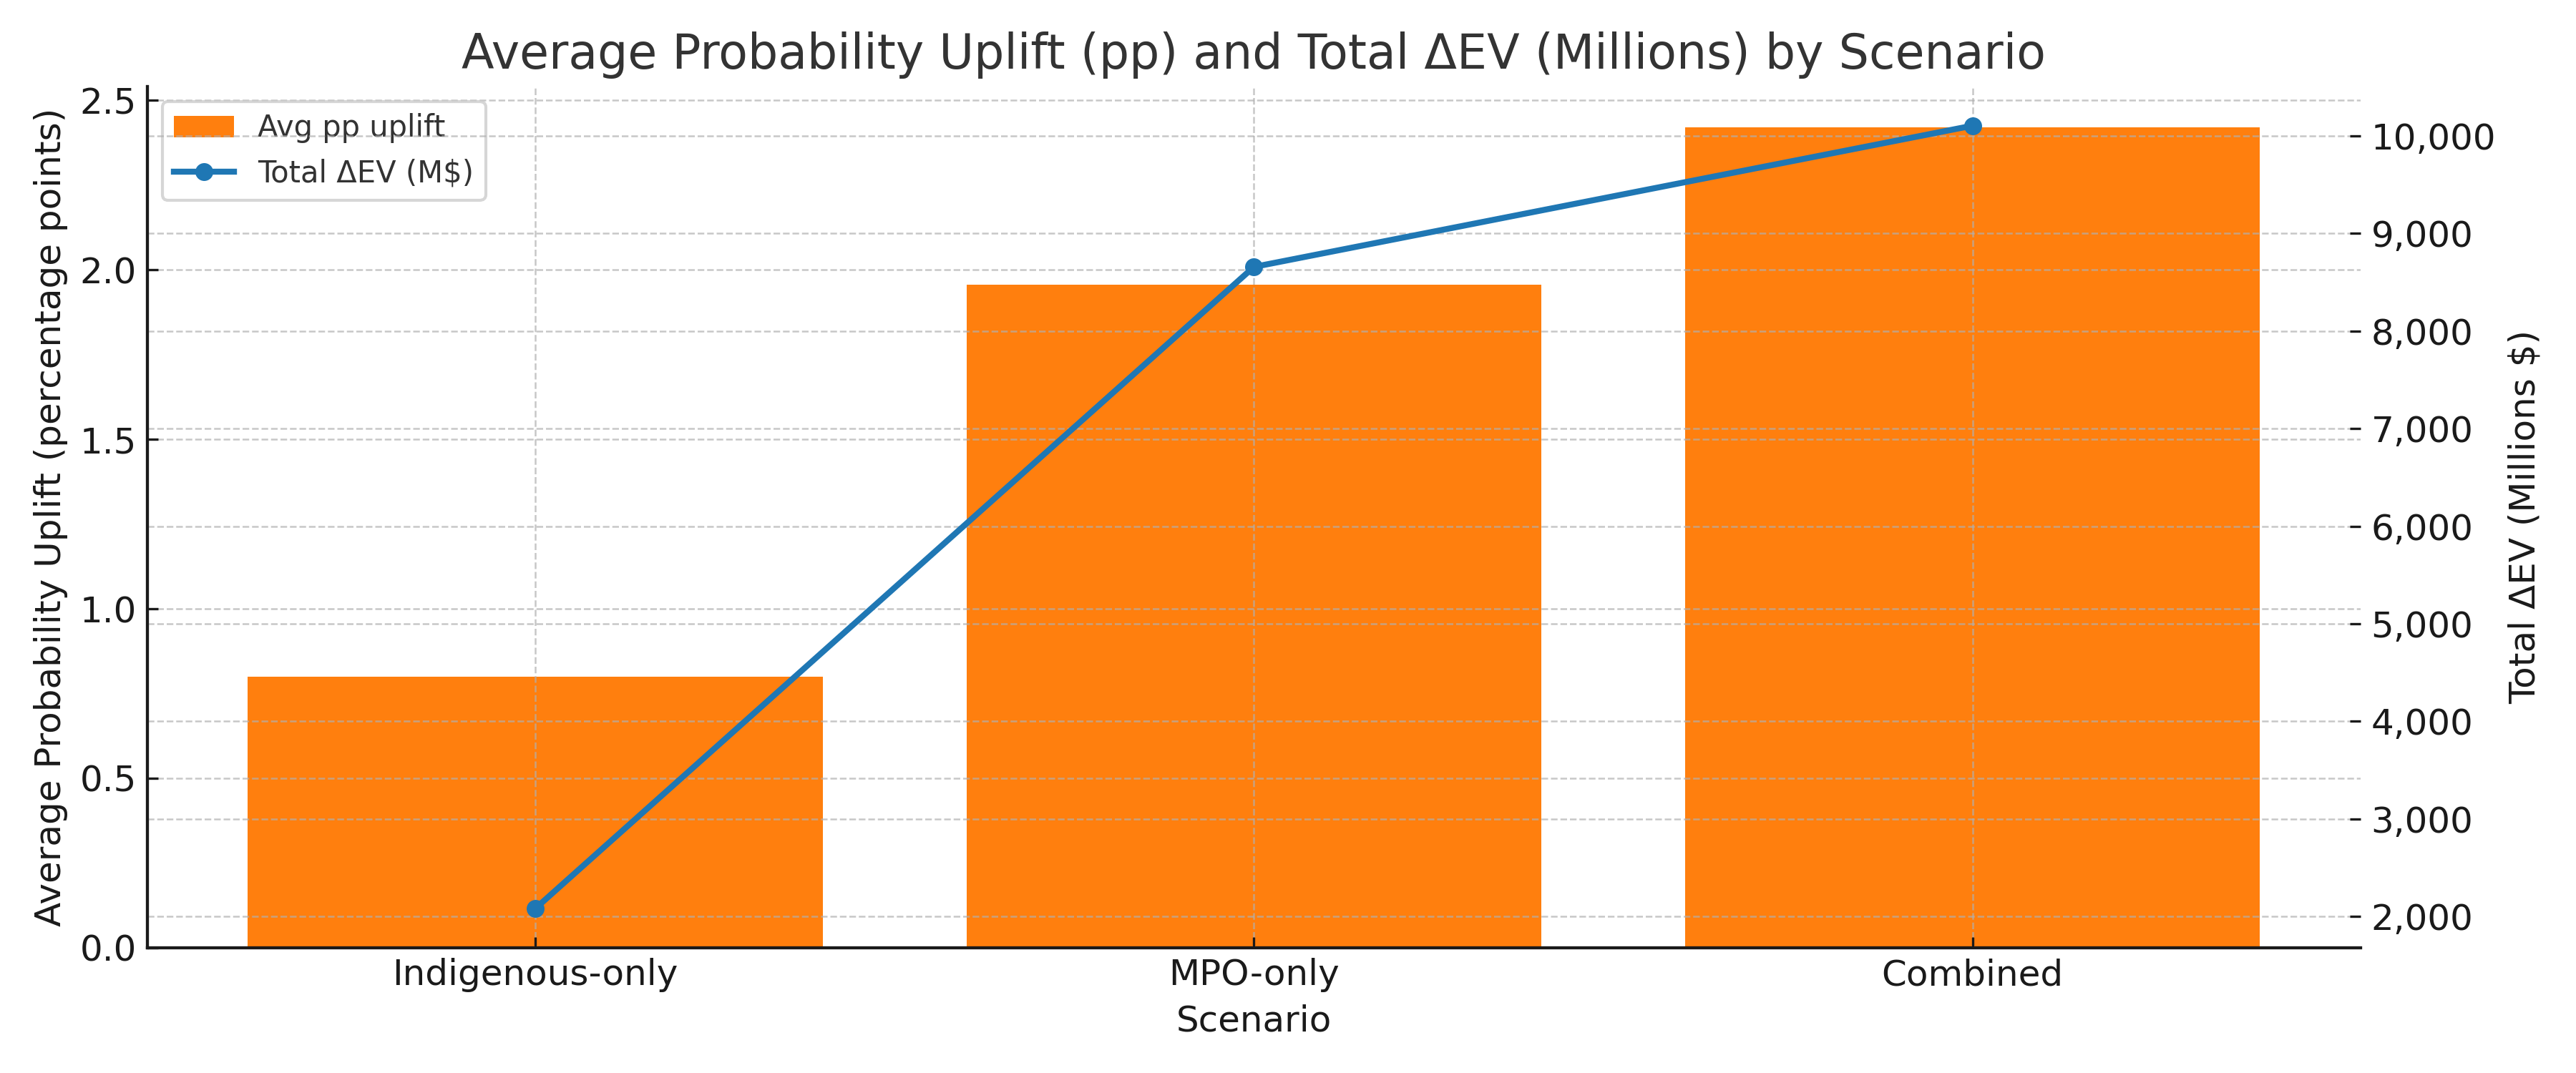
Figure 1: Average probability uplift (percentage points) and total expected value (ΔEV, millions of dollars) under three policy scenarios—Indigenous-only, MPO-only, and combined. While Indigenous participation produces modest gains, the MPO cap delivers larger effects, and the combined overlay has the strongest portfolio-wide impact.
The sectoral breakdown shows where policy impacts are most concentrated. Energy projects, the largest cohort at roughly 235 files, saw the strongest absolute gains. Blended probabilities rose by 1.1 percentage points under the Indigenous overlay, 2.5 points under the MPO cap, and 3.0 points under the combined scenario. These shifts correspond to EV increases of about $8.0 billion under MPO alone and $9.3 billion under the combined overlay.
Forestry projects, a much smaller group of 17 projects, gained 1.3 points under Indigenous, 1.6 points under MPO, and 2.3 points under the combined overlay. The EV impact was approximately $21 million under MPO and $51 million under the combined run. Here, the Indigenous effect was relatively more pronounced, nearly matching the MPO uplift.
Mining projects, numbering more than 100, barely moved under the Indigenous overlay (0.2 points), but gained 1.0 point under MPO and 1.1 points under the combined overlay. These shifts translated into EV uplifts of roughly $633 under MPO and $729 million under the combined scenario.
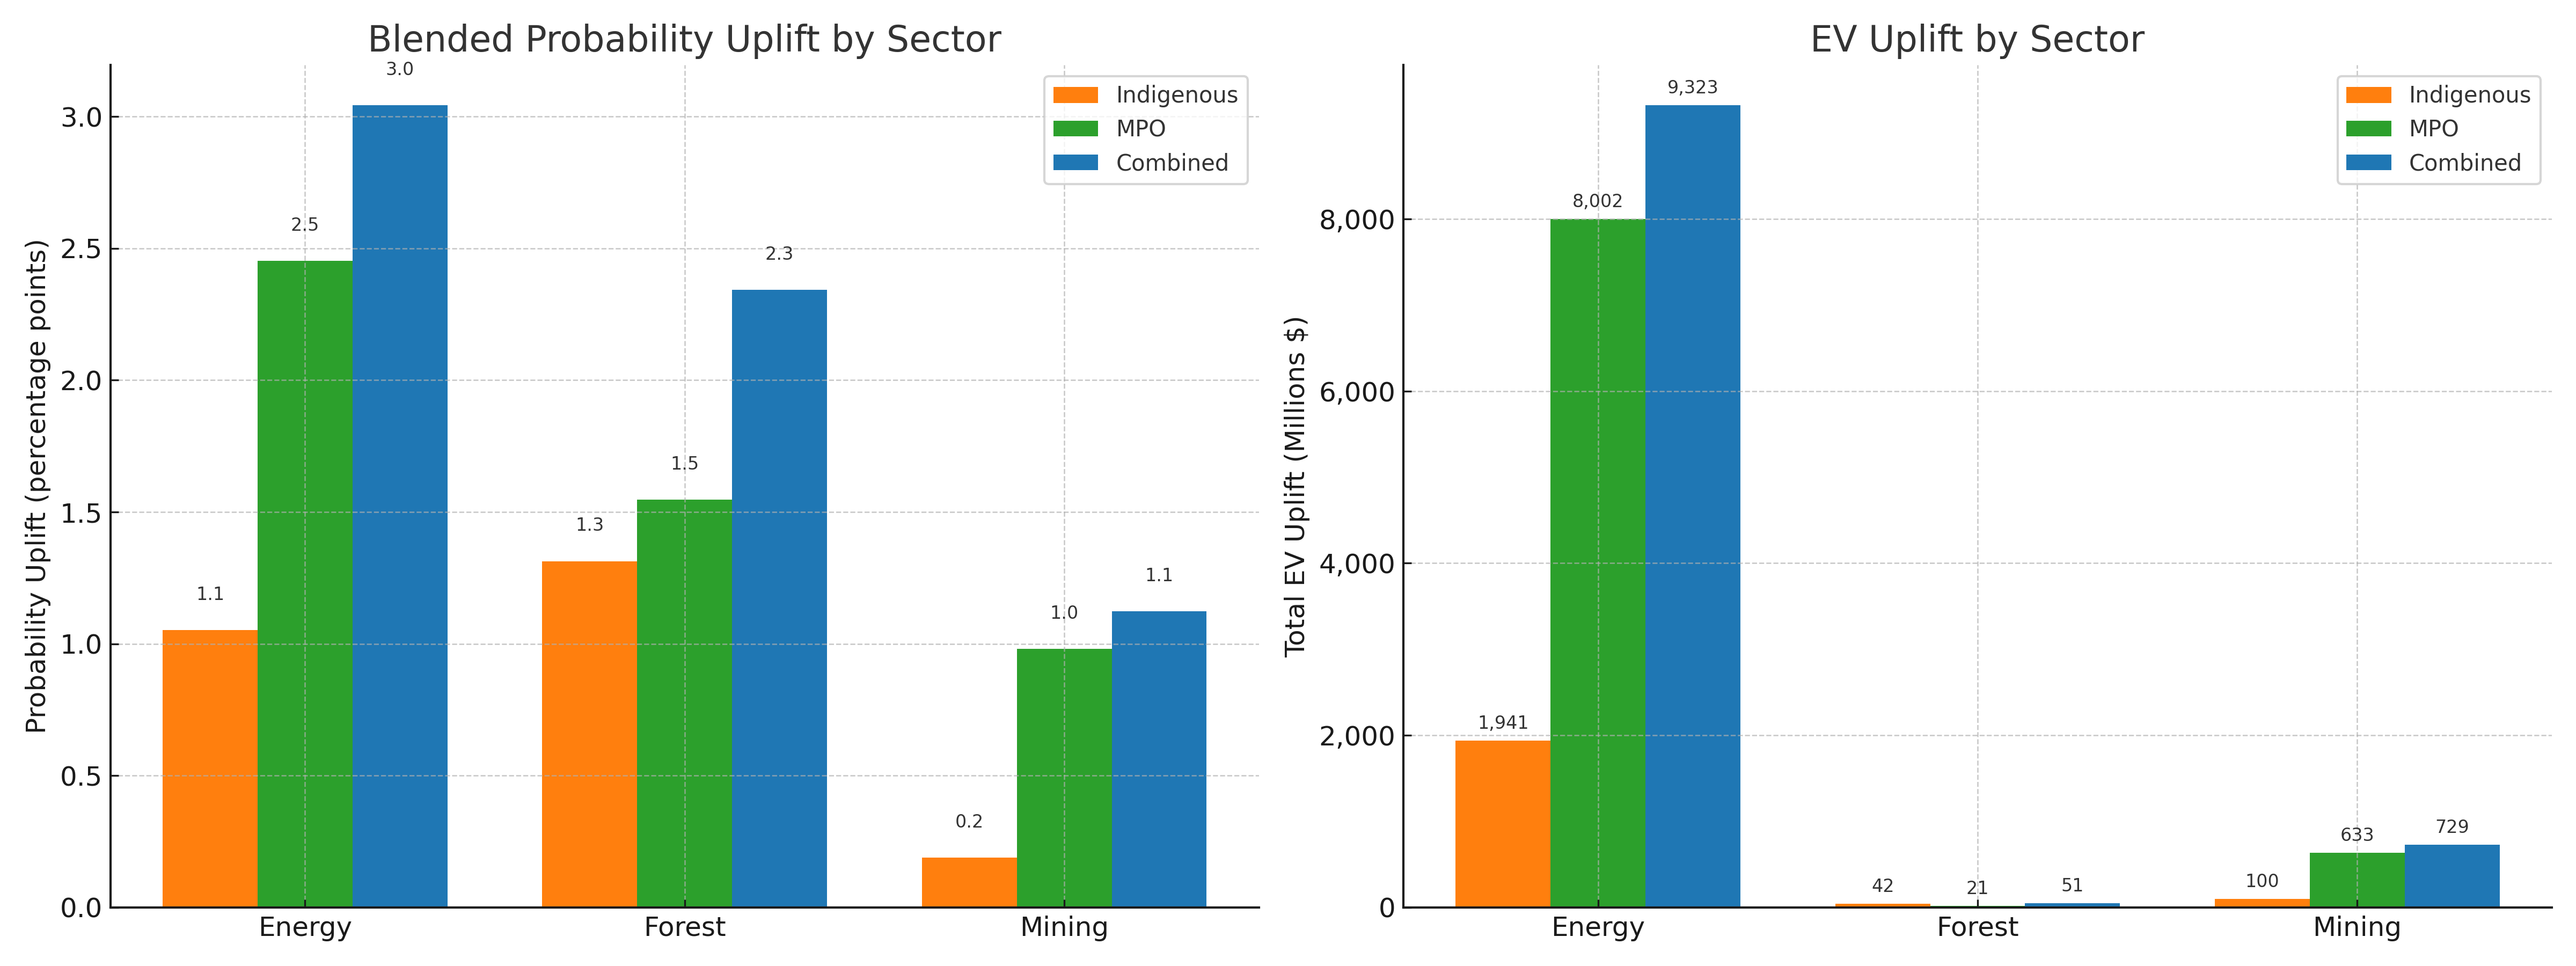
Figure 2: Sectoral breakdown of policy impacts. Energy projects show the highest probability and EV gains, followed by forest and mining. Results highlight sectoral heterogeneity, with energy accounting for the vast majority of overall portfolio uplift.
The provincial results show that the MPO cap, the Indigenous overlay, and the combined scenario have uneven effects. Alberta stands out in every case, gaining more than 4 points under the cap, about 1.6 points under the Indigenous overlay, and nearly 5 points when both are applied. The Atlantic provinces also see large shifts. Prince Edward Island records an uplift of more than 11 points under the cap and over 12 points in the combined scenario, though this rests on just three projects. Nova Scotia and New Brunswick each rise by about 3.5 points under the cap and over 4 points when policies are combined, while Newfoundland and Labrador barely moves. Ontario gains about 2 to 2.5 points; Saskatchewan, Manitoba, and Quebec remain near the bottom, with combined uplifts between 1 and 2 points; and British Columbia realizes less than 1 point.
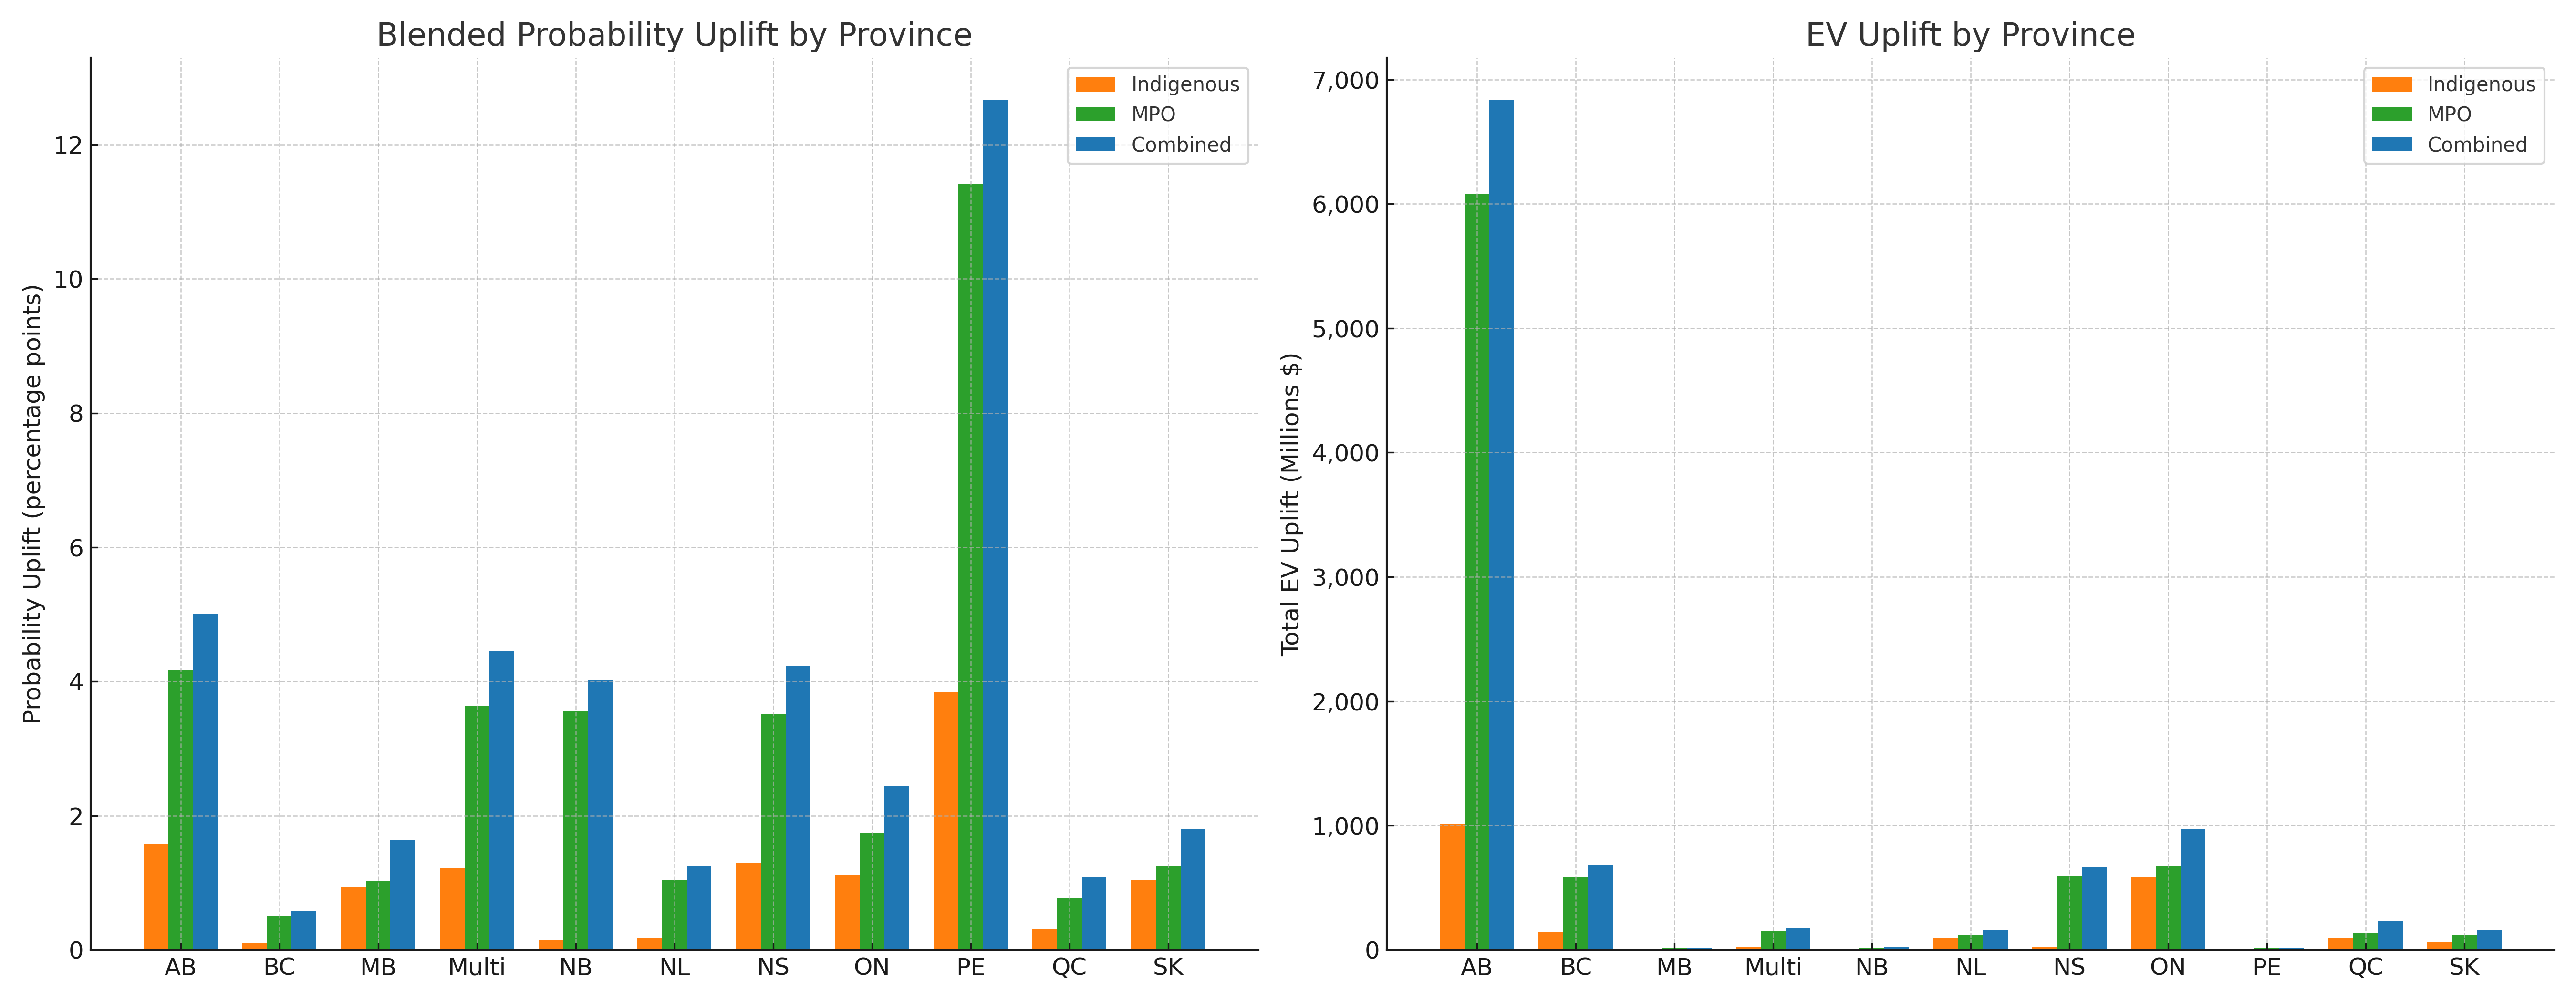
Figure 3: Provincial breakdown of policy impacts. Alberta shows the largest probability uplift (PEI rests on just three projects) and dominates EV gains due to its higher baseline project costs and volumes. Results confirm strong geographic concentration of benefits.
Group-level results show that clean electricity projects, the largest category with 99 files, grew from $30.5 billion to $32.5 billion in total expected value, a gain of $2.0 billion. Transmission and distribution projects rose from $5.8 billion to $6.2 billion, adding $372 million, while distributed resources increased by $123 million. The largest absolute shifts, however, came from capital-intensive groups with few projects. Nuclear advanced from $23.5 billion to $23.9 billion, a $410 million gain based on just two files. Oil and gas, however, emerged as the clear winner, accounting for nearly half of the total EV uplift: upstream added almost $2.9 billion, while downstream contributed $1.9 billion, according to the combined policy overlay data.
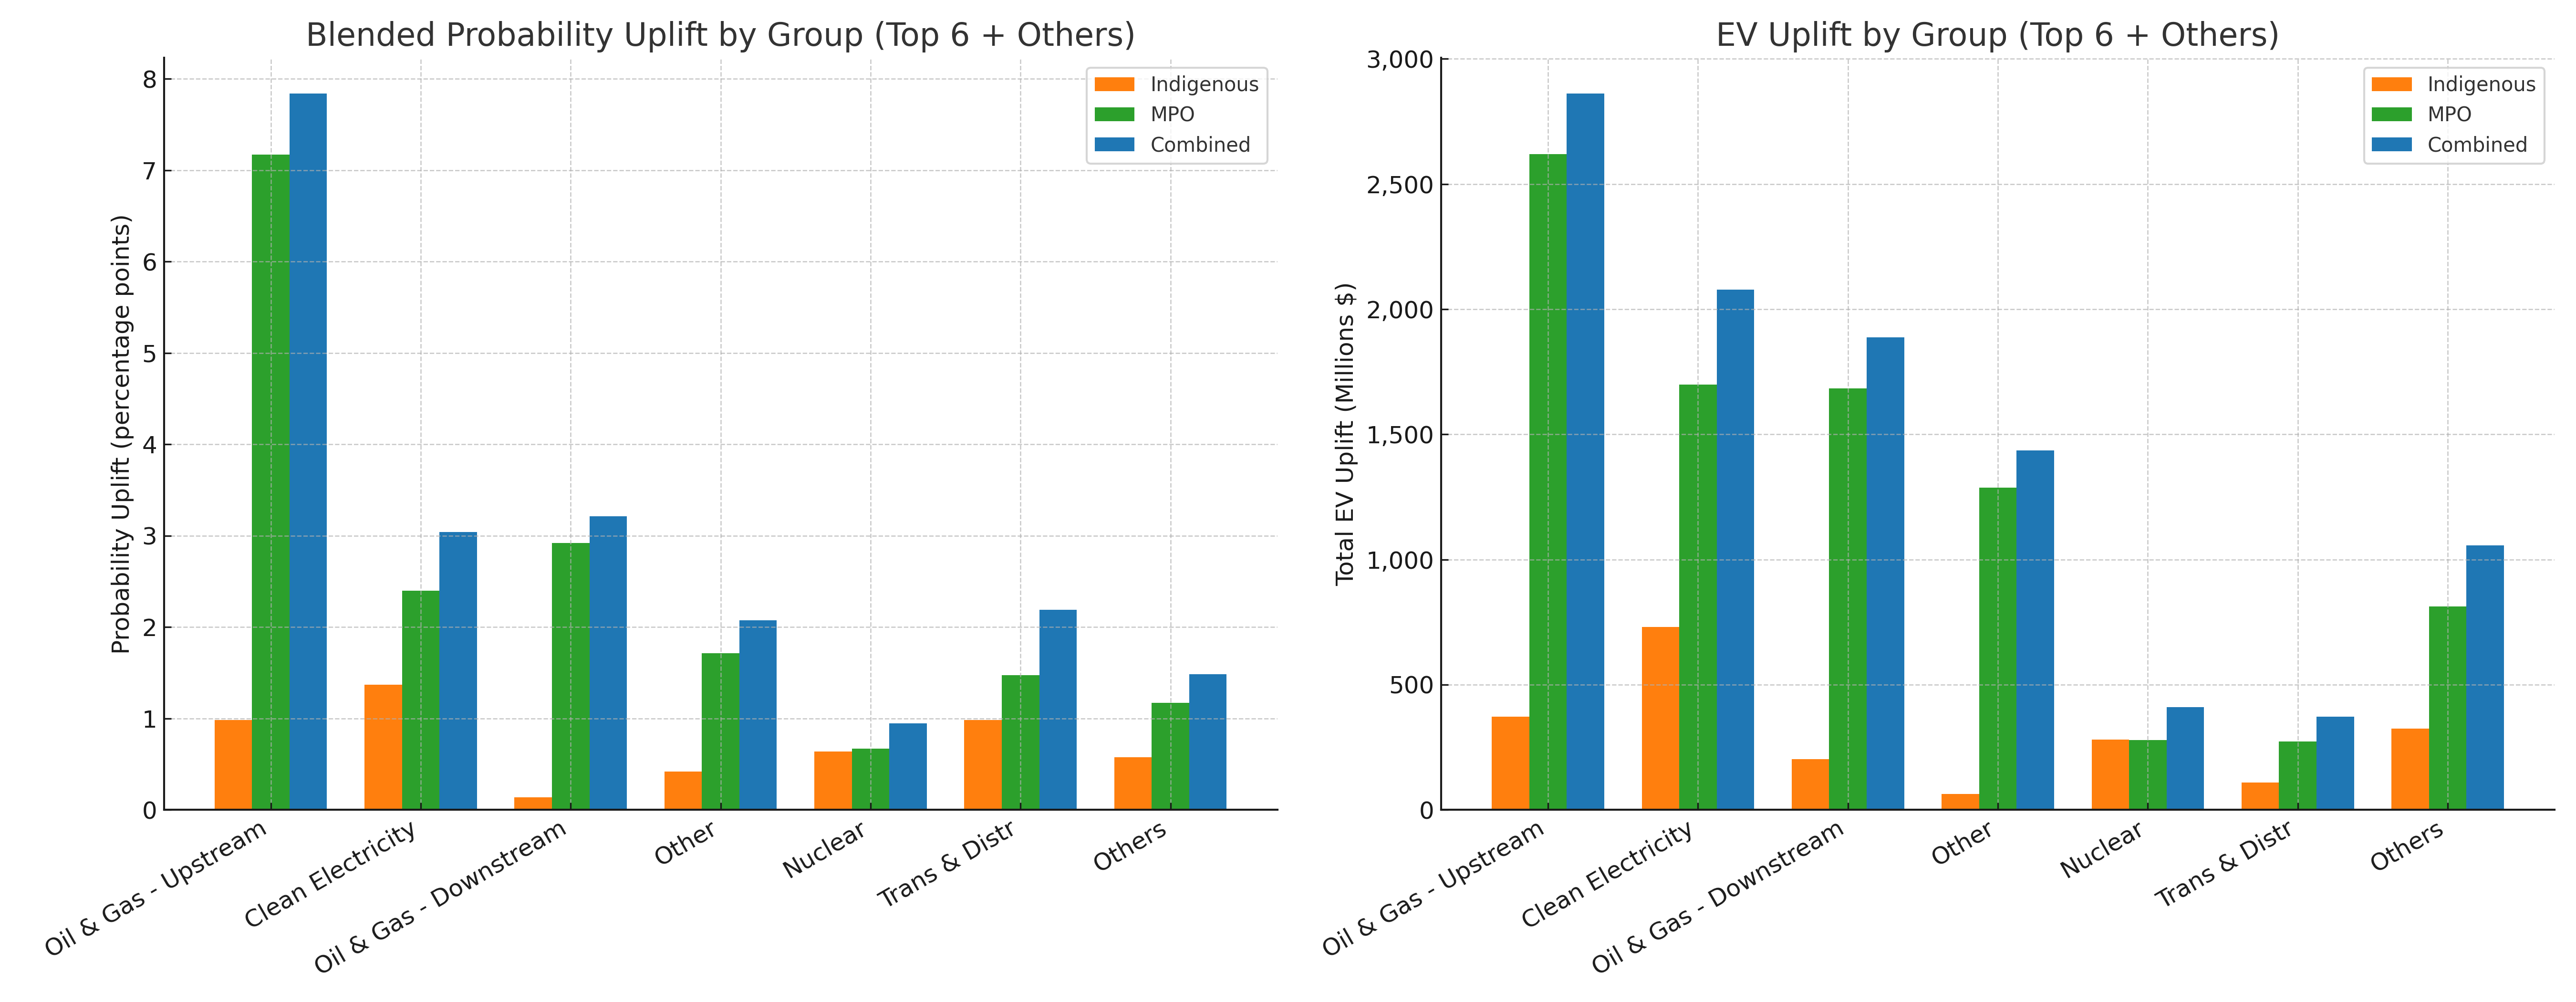
Figure 4: Probability and EV uplift by major project groups. Oil & Gas (upstream and downstream) and clean electricity dominate the aggregate impact, while nuclear, transmission & distribution, and others contribute smaller but still measurable gains.
Policy overlays affect projects unevenly depending on whether they are first-of-a-kind (FOAK), Nth-of-a-kind (NOAK), greenfield or expansions. FOAK projects gained only about half a point under the Indigenous overlay and slightly more under the MPO cap, with the combined effect lifting them by nearly 0.8 points. This shows that while policy can help some FOAK projects cross critical thresholds, approval time compression or Indigenous participation alone is not enough to transform bankability at scale. Most of the expected value still accrues to NOAK projects, which added about $9.5 billion (94 percent) under the combined scenario compared with $569 million for FOAK projects. The gap reflects their larger capital volumes and broader representation in the dataset. Greenfield projects, which start from lower base probabilities than expansions, also respond more strongly to the MPO cap, gaining about 2 points and $9.2 billion in EV compared with 1.6 points and about $1 billion in additional EV for expansions. Compressing longer timelines thus provides the greatest relative uplift for NOAK new builds facing heavier regulatory hurdles.
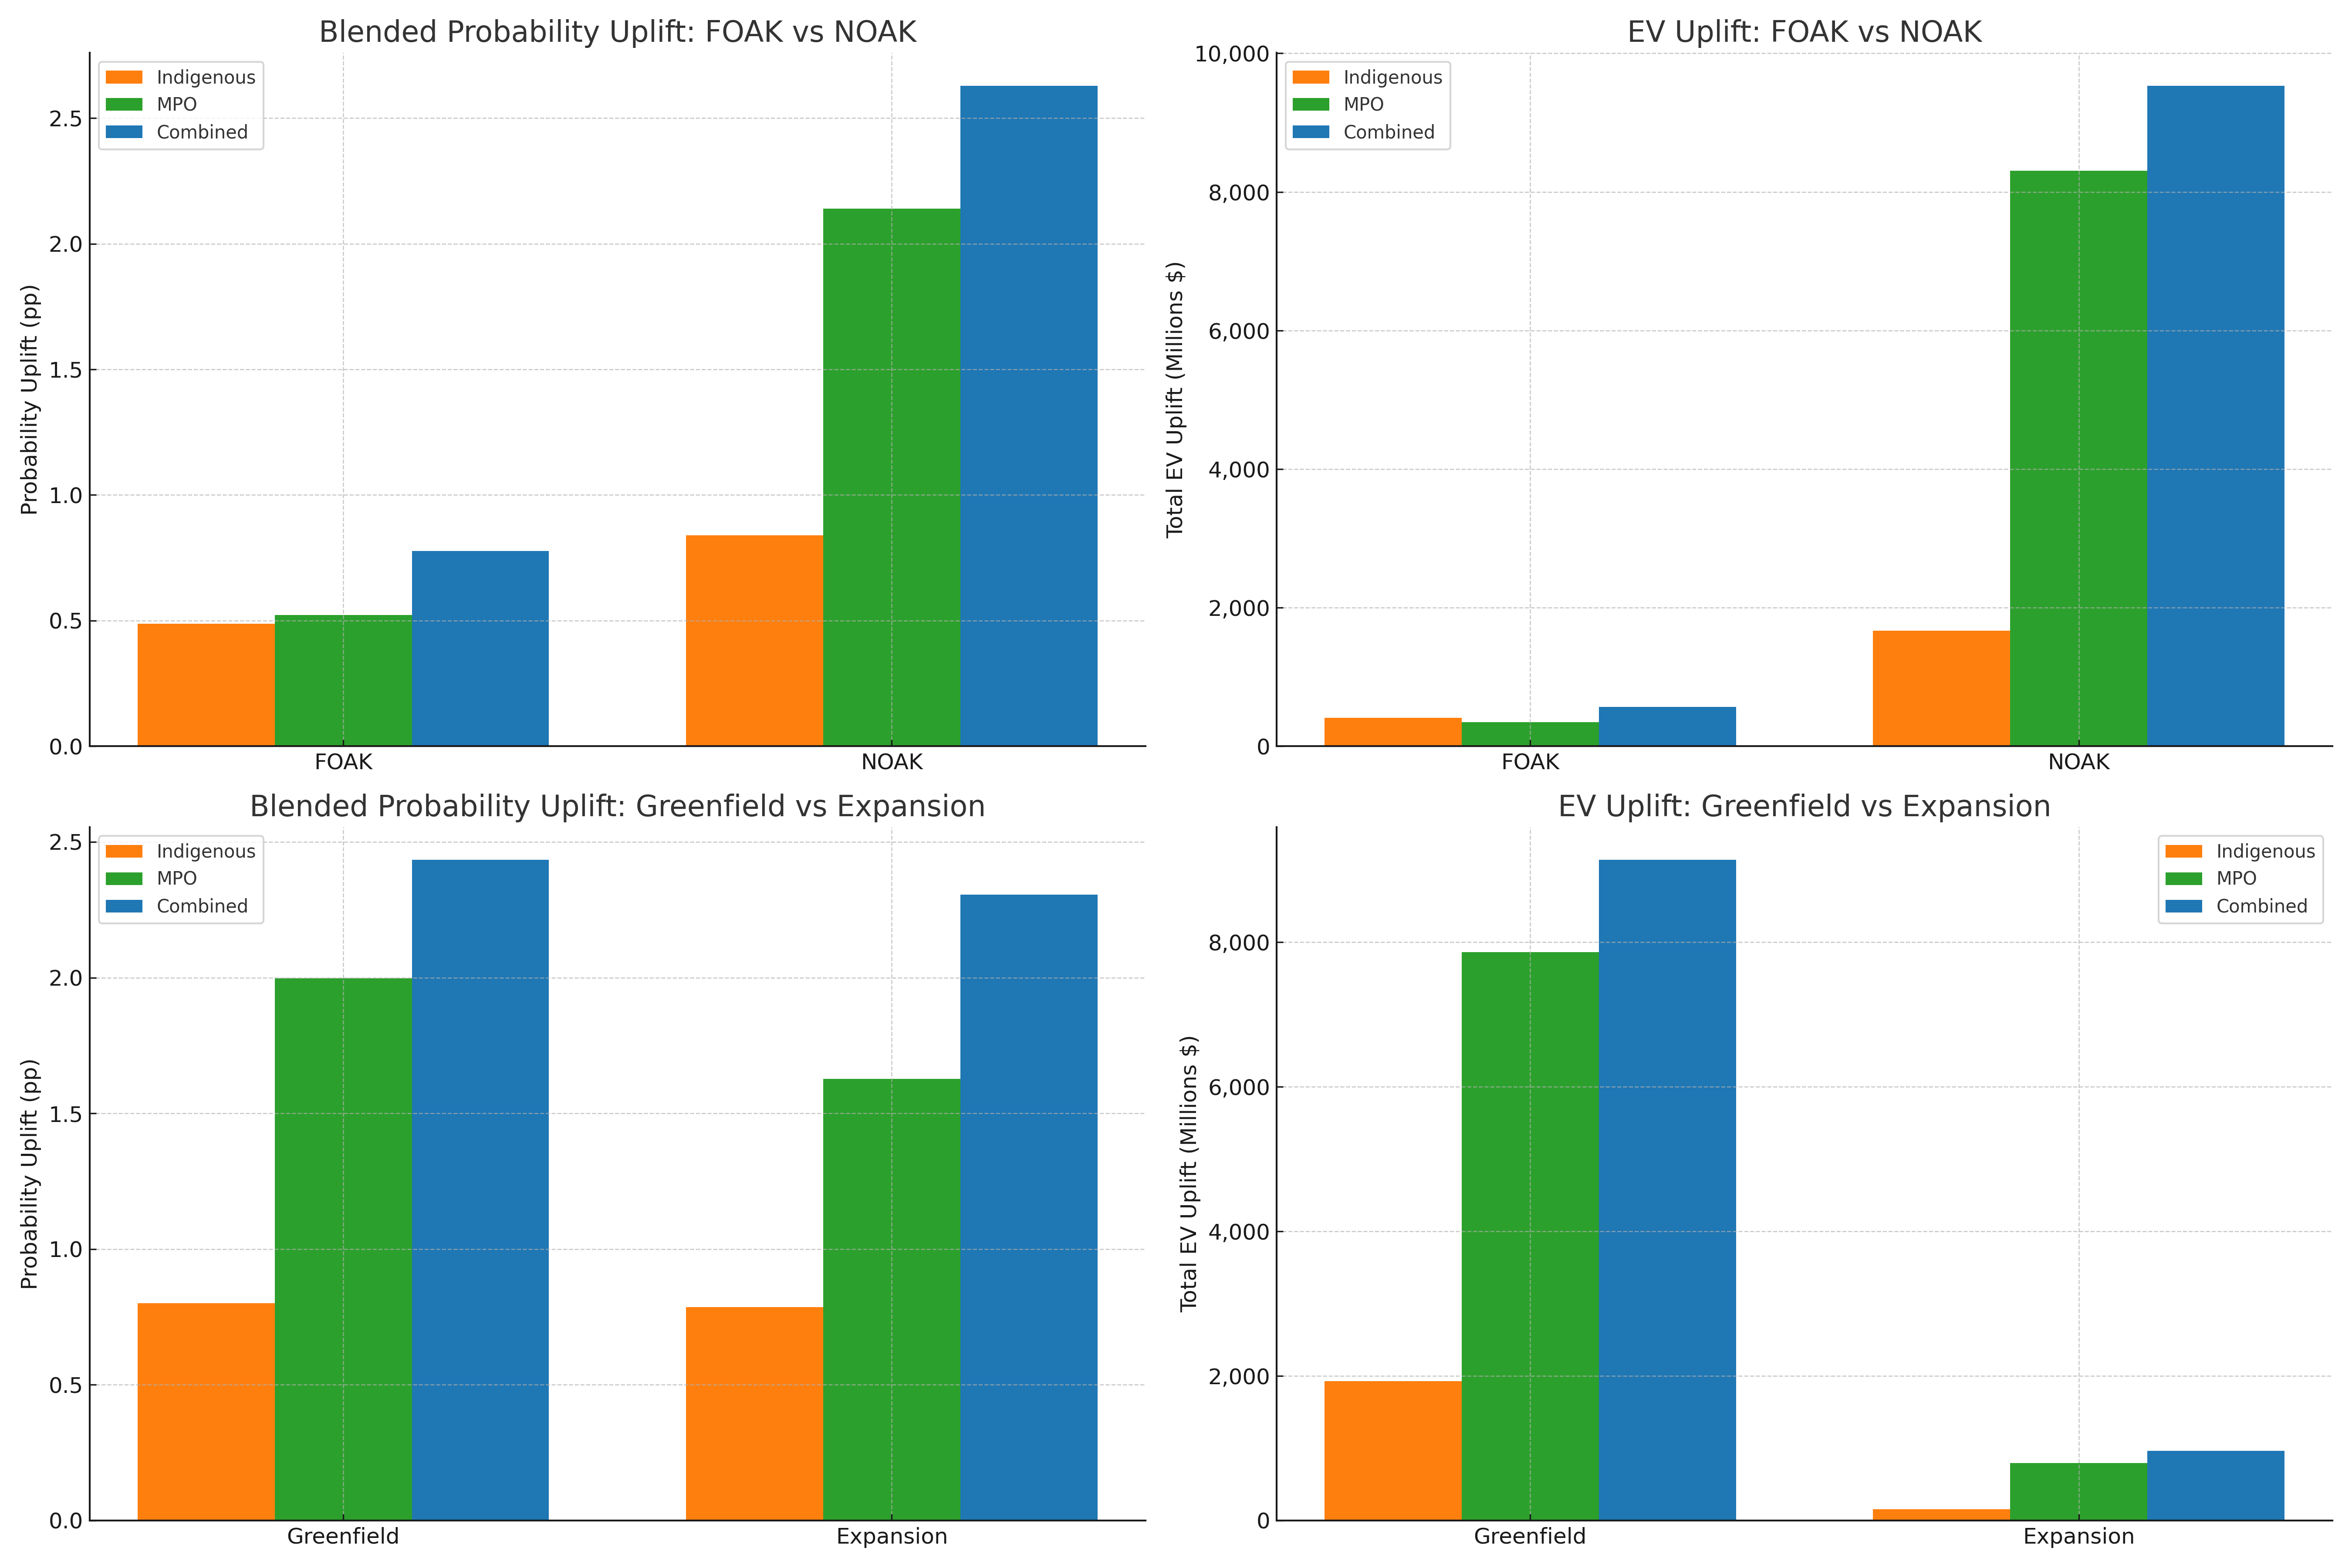
Figure 5: Comparison of probability uplift and EV uplift by project type. Non-first-of-a-kind (NOAK) and greenfield projects see larger gains than first-of-a-kind (FOAK) or expansion projects, underscoring how baseline maturity and scale condition policy effectiveness.
The overlays rarely change the fortunes of true underdogs, projects starting with probabilities below 20 percent. On average, these projects gain less than 1 percentage point under the combined scenario. Even when the relative increase is two- or threefold, the absolute probabilities remain well below the 50 percent threshold, leaving them underdogs.
Projects in the “marginal” cohort, those starting between 40 and 50 percent probability, benefited most. Even a modest 3-to-10-point uplift can tip outcomes from marginal to better than even-money odds. Because these projects also represent large capital volumes, relatively small probability gains compound into tens or hundreds of millions in added EV, making them the true drivers of policy impact.
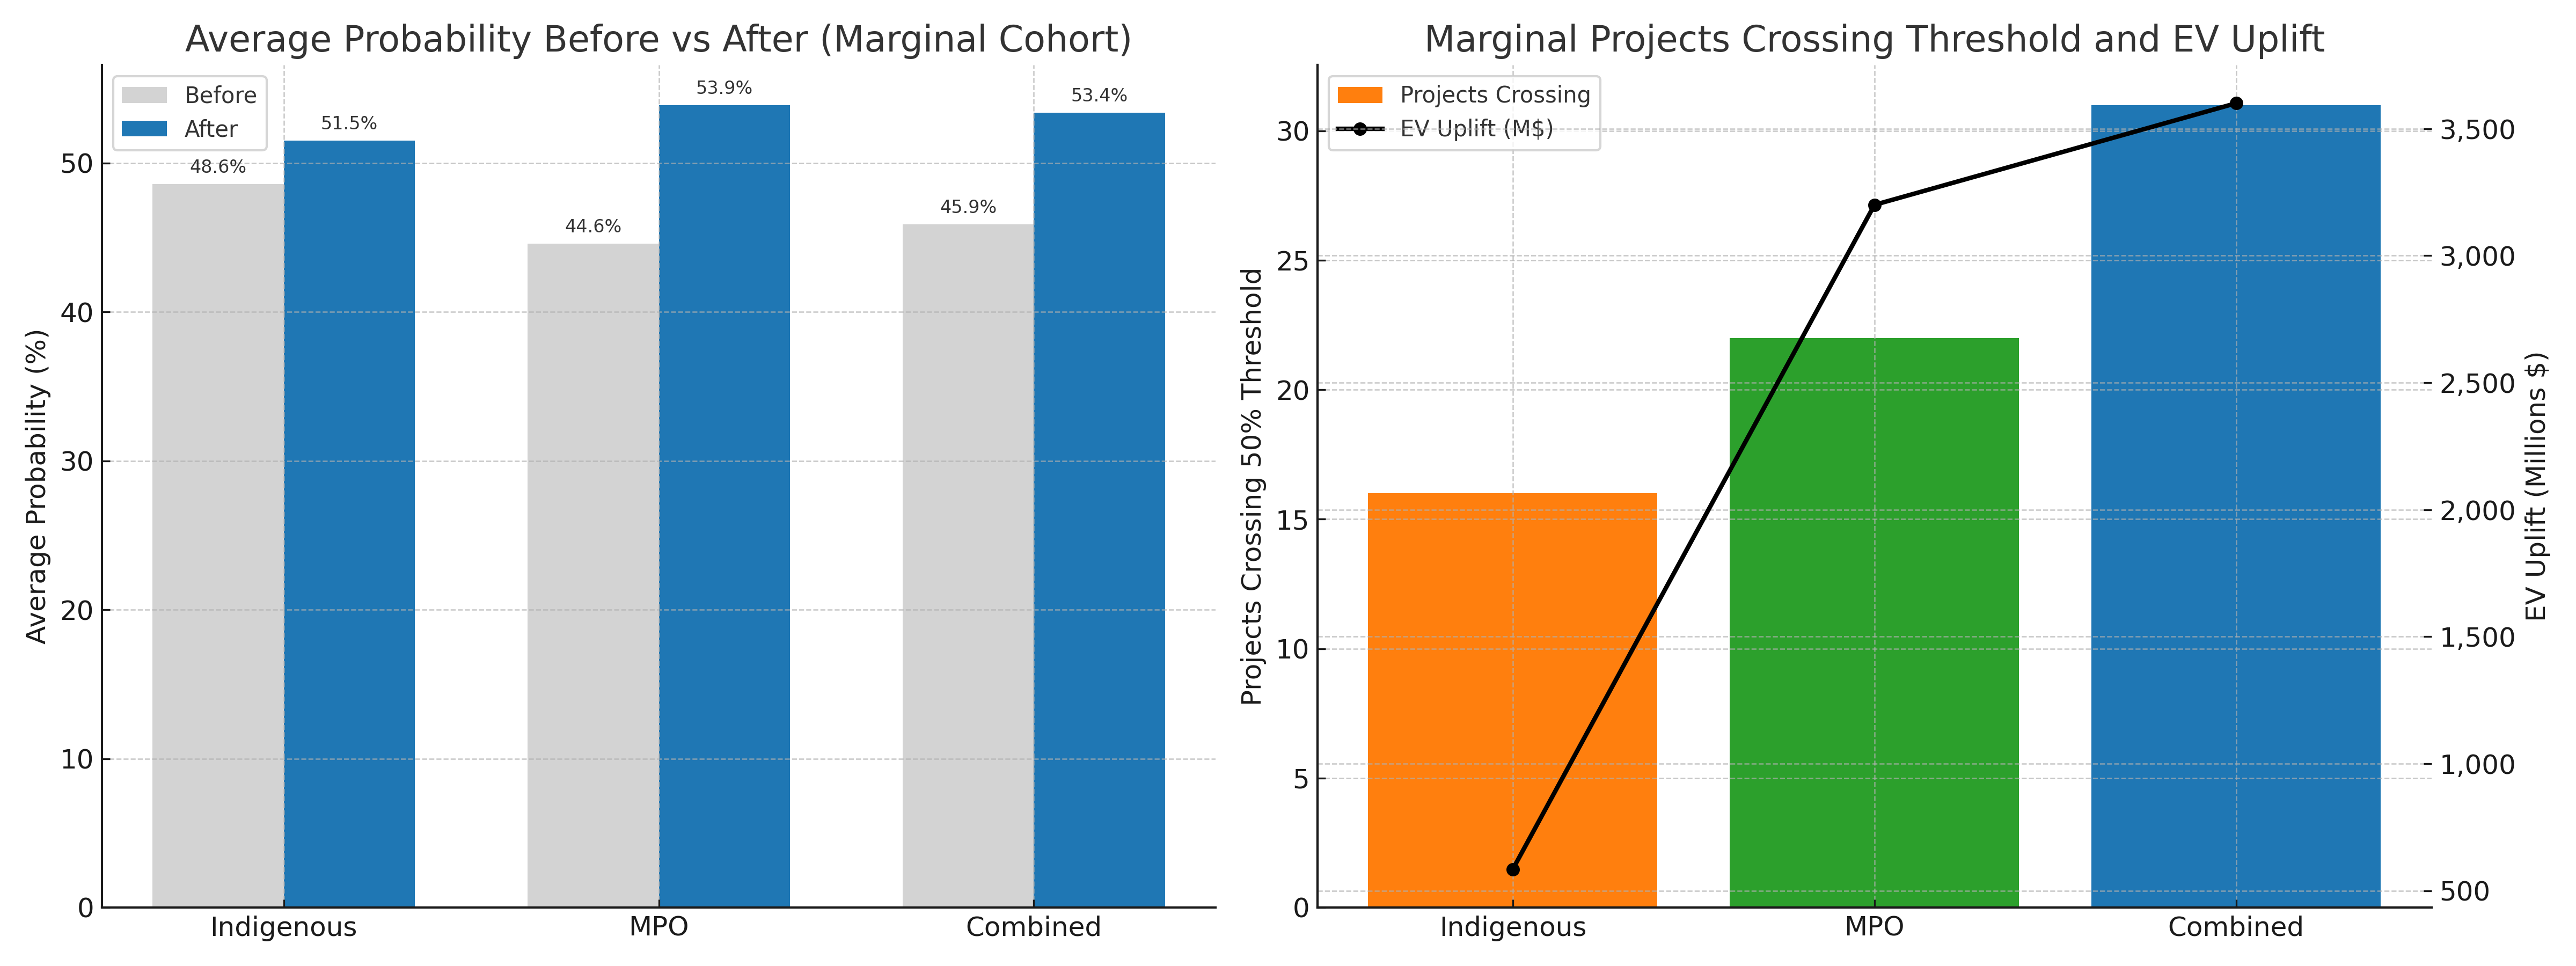
Figure 6: Policy overlays shift marginal projects (those hovering around the 50 percent probability threshold) into higher-likelihood territory. More than 30 projects cross the even-money threshold under the combined overlay, generating over $3.5 billion in additional expected value.
The Indigenous-only overlay helped 16 projects cross the 50 percent threshold, raising average probability from 48.6 to 51.5 percent and adding about $585 million in EV. The MPO cap overlay saw 22 projects cross, with average probability moving from 44.6 to 53.9 percent, boosting value by roughly $3.2 billion. The combined overlay produced the largest effect: 31 projects advanced past 50 percent, probability climbed from 45.9 to 53.4 percent, and EV rose by about $3.6 billion.
From a policy perspective, the results of the overlay runner align closely with Ottawa’s promises. Methodologically, it simulates exactly what these changes are intended to do: shorten approval timelines and smooth the path to completion for projects with Indigenous partners. That said, the overlay runner also exposes policy limits. Average uplifts are modest: a 2-point average gain and a $10-billion EV uplift for the combined overlay are meaningful at the portfolio level but will not transform a 20-percent underdog into a favourite. Distribution matters. Many low-probability projects hardly move, while those near critical thresholds can shift substantially. Benefits are also subject to diminishing returns. The two-year cap, moreover, guarantees only a decision, not an approval. Shorter preconstruction timelines save time and capital but do not assure success. Similarly, Indigenous agreements and equity can work in reverse by extending timelines rather than shorten them, lowering probability and EV. [4]
In short, Prime Minister Carney’s simple promise is more a nudge than a shift. Faster, more coordinated approval decisions and Indigenous equity do move the needle (a 9 percent increase in total EV across the MPI is significant), especially for projects hovering near critical thresholds. Indeed, this marginal cohort alone accounts for 36 percent of the overall EV gains. While these measures will not transform the entire MPI pipeline overnight, they may provide just enough lift to determine whether a project drops out or graduates to construction.
[1] Note on Methods and Data
The Energy Nation risk engine generates a blended probability of project success, combining a Bayesian prior (based on province, sector, cost band, first-of-a-kind status, and cleantech flag) with a Cox survival component (capturing how time spent in approvals affects advancement odds). From this probability, the model derives expected value (EV) by multiplying success likelihood by reported capital cost, producing a probability-weighted measure of expected value (EV). The Unified Overlay Runner then applies counterfactual policy “shocks” to these outputs, simulating how probabilities and expected values shift under two stylized interventions: (i) an Indigenous overlay (time compression plus hazard multiplier) and (ii) a Major Projects Office (MPO) overlay (two-year approval cap). A combined scenario applies both sequentially. The runner does not refit the underlying risk engines; instead, it produces distributional shifts, not forecasts. Results can be large for projects near survival thresholds but modest for most files, and averages for very small samples (e.g., PEI’s three projects, or nuclear’s two files) are highly sensitive to outliers. All figures in this article come from the Unified Overlay Runner, using the Major Projects Inventory (MPI) dataset as input. Data and outputs are available in the Energy Nation GitHub repository, with full replication steps described in accompanying technical notes.
[2] The one-year time compression is an optimistic but reasonable assumption. MPI projects face rising risks of delay or failure after three years. Evidence shows that timing strongly shapes outcomes, and Indigenous partnerships are expected to smooth, not eliminate, success hurdles. A one-year reduction reflects this balance: significant enough to shift borderline projects into success, yet modest enough to remain consistent with how projects have actually performed in the past. This assumption can be adjusted in the overlay as needed.
[3] The reason the combined outcome is not a simple sum of the Indigenous-only and MPO-only results lies in the sequential application of policies and the dominating effect of the MPO cap. The Indigenous overlay applies a one-year time compression and a modest hazard multiplier (1.1), but when the MPO cap is subsequently applied, it resets any project with a long approval horizon to the two-year ceiling. For most projects, this makes the Indigenous time shift redundant, leaving only the small additional effect of the hazard multiplier. This explains why the mean EV gain of the combined run ($27.8M) falls short of the arithmetic sum of the individual runs ($29.5M) and why the knot counts for MPO-only and combined are identical at 223. The hard two-year MPO cap is the binding condition that drives those threshold crossings.
[4] Focusing on Indigenous agreements, specifically Impact and Benefit Agreements (IBAs), in Canada, research provides nuanced insights into whether these agreements increase the probability that resource projects proceed to construction. IBAs can improve the chances of projects advancing by mitigating risk and securing social license through Indigenous participation. However, their effects are not uniform. Strong agreements with meaningful benefits may smooth approvals, while weaker ones may leave conflicts unresolved. In some regions, treaties or laws make IBA-like agreements effectively mandatory, but in most cases their role is context-dependent. Overall, the literature suggests IBAs increase probability of progression, but outcomes vary widely with negotiation and community dynamics. O’Faircheallaigh, C. (2020). Explaining outcomes from negotiated agreements in Australia and Canada. Resources Policy, 101922. https://doi.org/10.1016/j.resourpol.2020.101922. Caine, K., & Krogman, N. (2010). Powerful or Just Plain Power-Full? A Power Analysis of Impact and Benefit Agreements in Canada’s North. Organization & Environment, 23, 76 - 98. https://doi.org/10.1177/1086026609358969.
Comments
Nothing yet. Say the first thing.
Sign in to join the conversation.