
I was reminded recently by my daughter that it’s perfectly okay to ask people to like and subscribe to your Substack. So, if you find this analysis useful, please give it a like, subscribe (if you haven’t already), and forward it to a colleague or friend or family member who might be interested.
Thanks for reading Joshua’s Energy Nation Substack! This post is public so feel free to share it.
Now, on to the goods. Since last week’s initial assessment of the probabilities of the Carney Five that exposed certain shortcomings of our model, we refitted the Energy Nation risk engines to better reflect the realities of Canada’s major project pipeline. The upgrade brings improved sensitivity to how time spent in the Major Projects Index (MPI) affects eventual outcomes and introduces two new signals into scope: Greenfield vs. Expansion and First-of-a-Kind (FOAK) vs. Nth-of-a-Kind (NOAK). The result is sharper accuracy (84 percent) and stronger calibration, meaning predicted probabilities now line up more closely with observed results in the training set.[1] These refinements have significant consequences for expected value (EV) across the MPI portfolio.
Location and sector effects remain powerful. British Columbia mining projects, for example, continue to show systematically elevated risk. However, by refitting time-to-event effects and explicitly tagging Greenfield and FOAK projects, we can explain variance that previously leaned too heavily on province or sector. Greenfield projects, which are built from scratch rather than as expansions, now average about 7 percentage points lower survival probability than the portfolio as a whole. Expansions that add phases or capacity to existing facilities are significantly more resilient.
FOAK projects represent the first deployment of a novel technology, process, or market entry. Examples include small modular nuclear reactors, carbon capture hubs, large-scale hydrogen production, and advanced biofuels. Their modeled survival odds have fallen by about 15 percentage points compared to pre-refit levels, consistent with both financial practice and industry experience. By contrast, NOAK projects, such as natural gas power plants or onshore wind and solar, benefit from standardization, cost reduction, and regulatory streamlining, which softens the impact of the model refit and helps keep their survival probabilities more stable.
Under the refit, cost percentile has become more decisive, consistently penalizing higher-cost projects that spend a protracted period in planning. Meanwhile, the cleantech tag still offers a modest bonus, though its influence weakens once cost, province, and FOAK/Greenfield status are taken into account.
The refit hits Canada’s largest and most high-profile energy projects especially hard. Nuclear, carbon capture, and hydrogen developments bear the brunt. Together, Darlington’s small modular reactor, the Pathways CCS hub and the Suncor/ATCO clean energy project lost $7.4 billion in EV, representing a 28% decline from pre-refit EV.
Of the 364 MPI projects currently in the planning stage, 325 (89 percent) are Greenfield builds, while 41 (11 percent) are classified as FOAK. All but one of the FOAK projects are also Greenfield, underscoring how often pioneering technologies and entirely new sites go hand in hand. Greenfield projects are most heavily concentrated in Energy (205 projects) and Mining (107 projects), with the provincial map led by British Columbia (89), Alberta (75), and Quebec (59). [2]
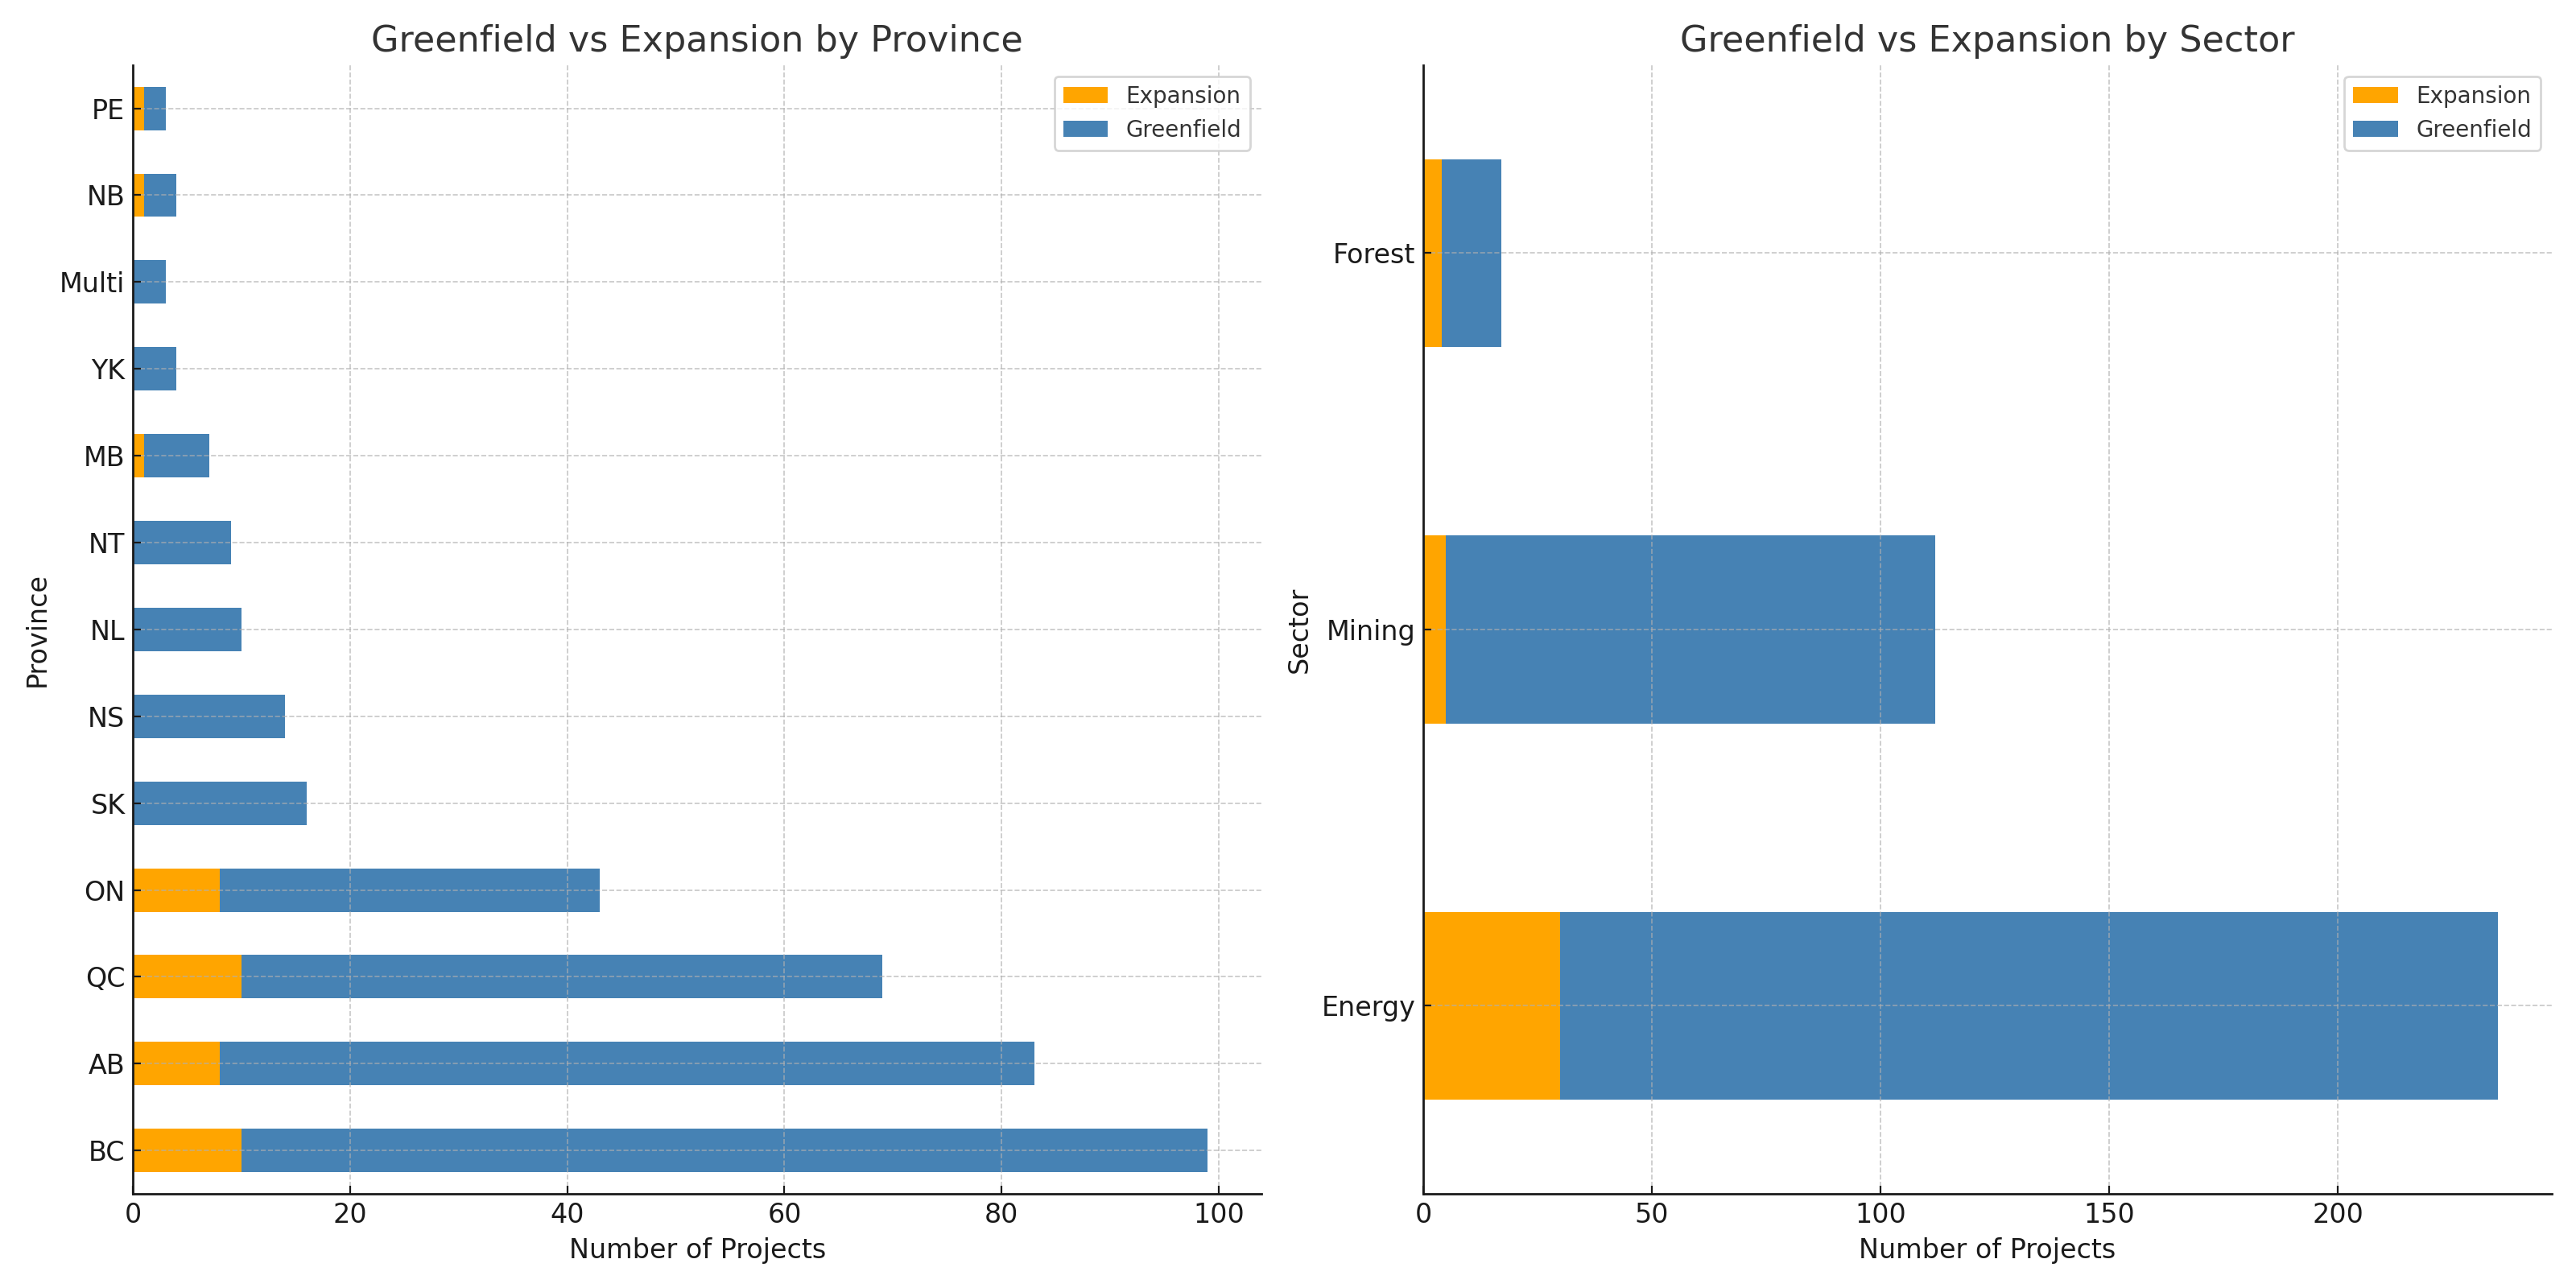
Figure 1: Greenfield vs Expansion by Province and Sector.
FOAK projects are overwhelmingly in the Energy sector (37), with only four in Forest and none in Mining. Their distribution across cost bins is fairly even, with no clear skew toward either the cheapest or the most expensive projects, meaning FOAK risk shows up at all cost levels.
At the provincial level, British Columbia (14) and Alberta (13) lead in FOAKs, followed by Quebec (6) and Nova Scotia (3), with smaller numbers in Ontario, Saskatchewan, and Manitoba. The most acute alignment of risk comes where FOAK incidence overlaps with provinces that already carry systematically low modeled probabilities, specifically British Columbia, Quebec, and Nova Scotia. These “double-whammy” projects face the steepest downward revisions in expected survival odds and expected value, highlighting the headwinds facing some of Canada’s more ambitious developments.[3]
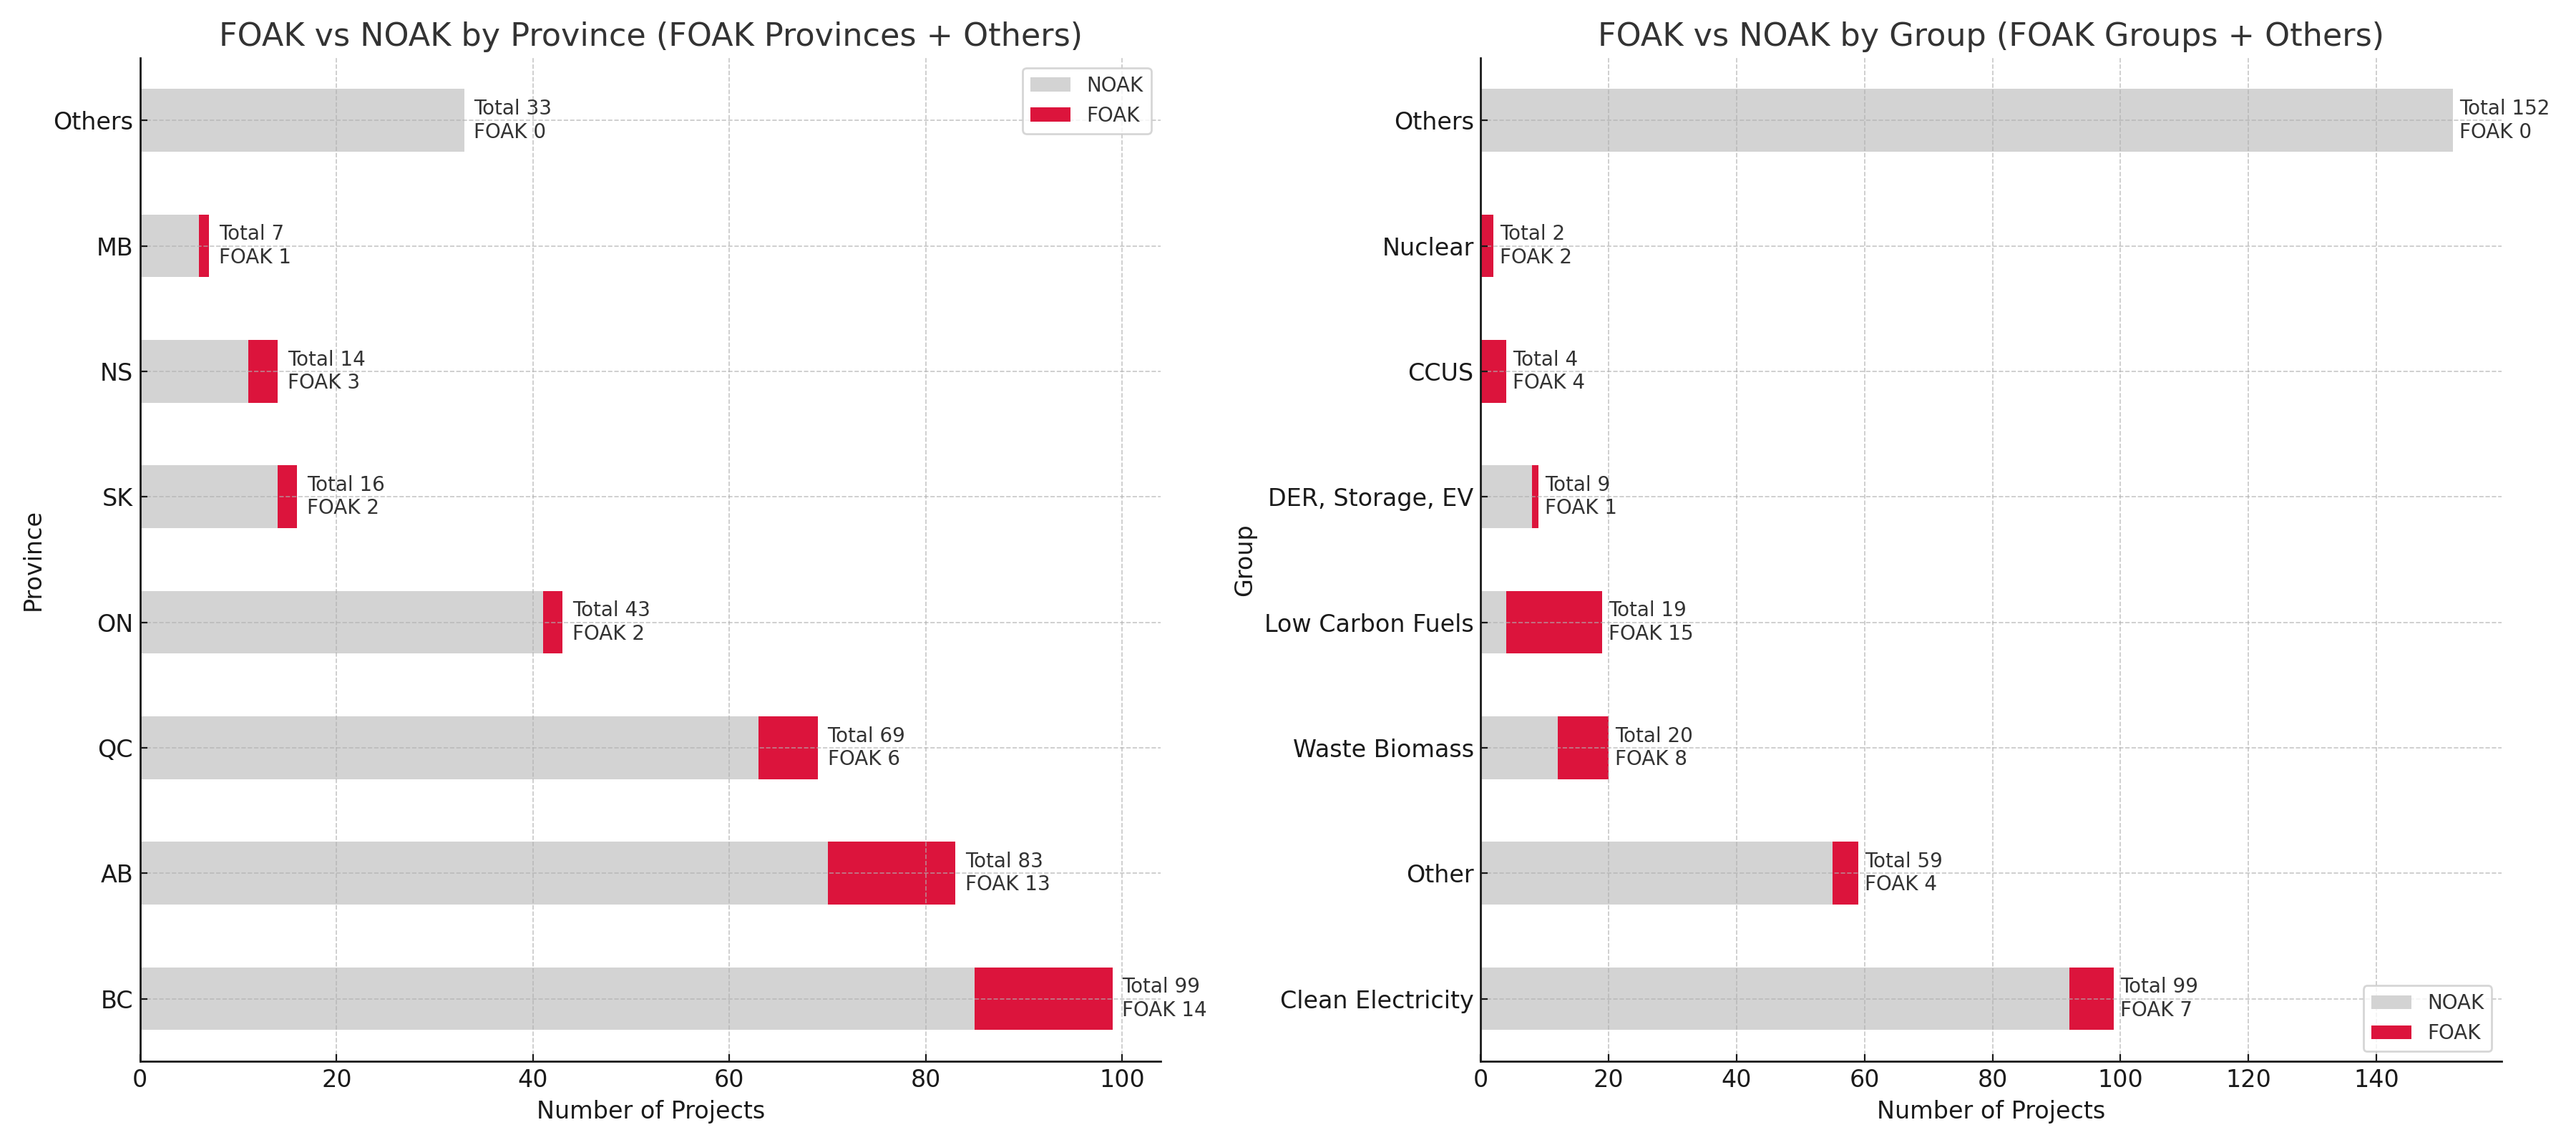
Figure 2: FOAK vs NOAK by Province and Group.
Surprisingly, expansions are rarer than FOAKs in the MPI, with 39 projects in total, and they tend to sit in Energy (30 of the 39), with their provincial concentration in BC (10) and Alberta (8). They also lean toward the higher-cost end, with seven in the highest-cost bin in those two provinces, contrasting with Greenfields, which are both more numerous and more broadly spread across cost levels.
NOAKs outnumber FOAKs by eight to one, down from 14 to one five years ago.[4] They cluster strongly in Energy (198) and Mining (92), with the provincial leaders again BC (85) and Alberta (70). NOAKs span every cost bin but show a noticeable tilt toward the high-cost end. In Energy alone, there are 45 projects in the highest-cost bin.
The EV Engine clarifies how time-to-event sensitivity and Greenfield and FOAK tags reshape probabilities and expected value. Even though FOAKs make up 11 percent of projects (41 in total), they account for nearly one-third of expected value ($39 billion of a $123 billion total). This shows how concentrated the MPI portfolio is in high-risk, first-of-a-kind developments. It also highlights the danger that the loss of even a single FOAK could erase a significant share of portfolio-level EV. [5]
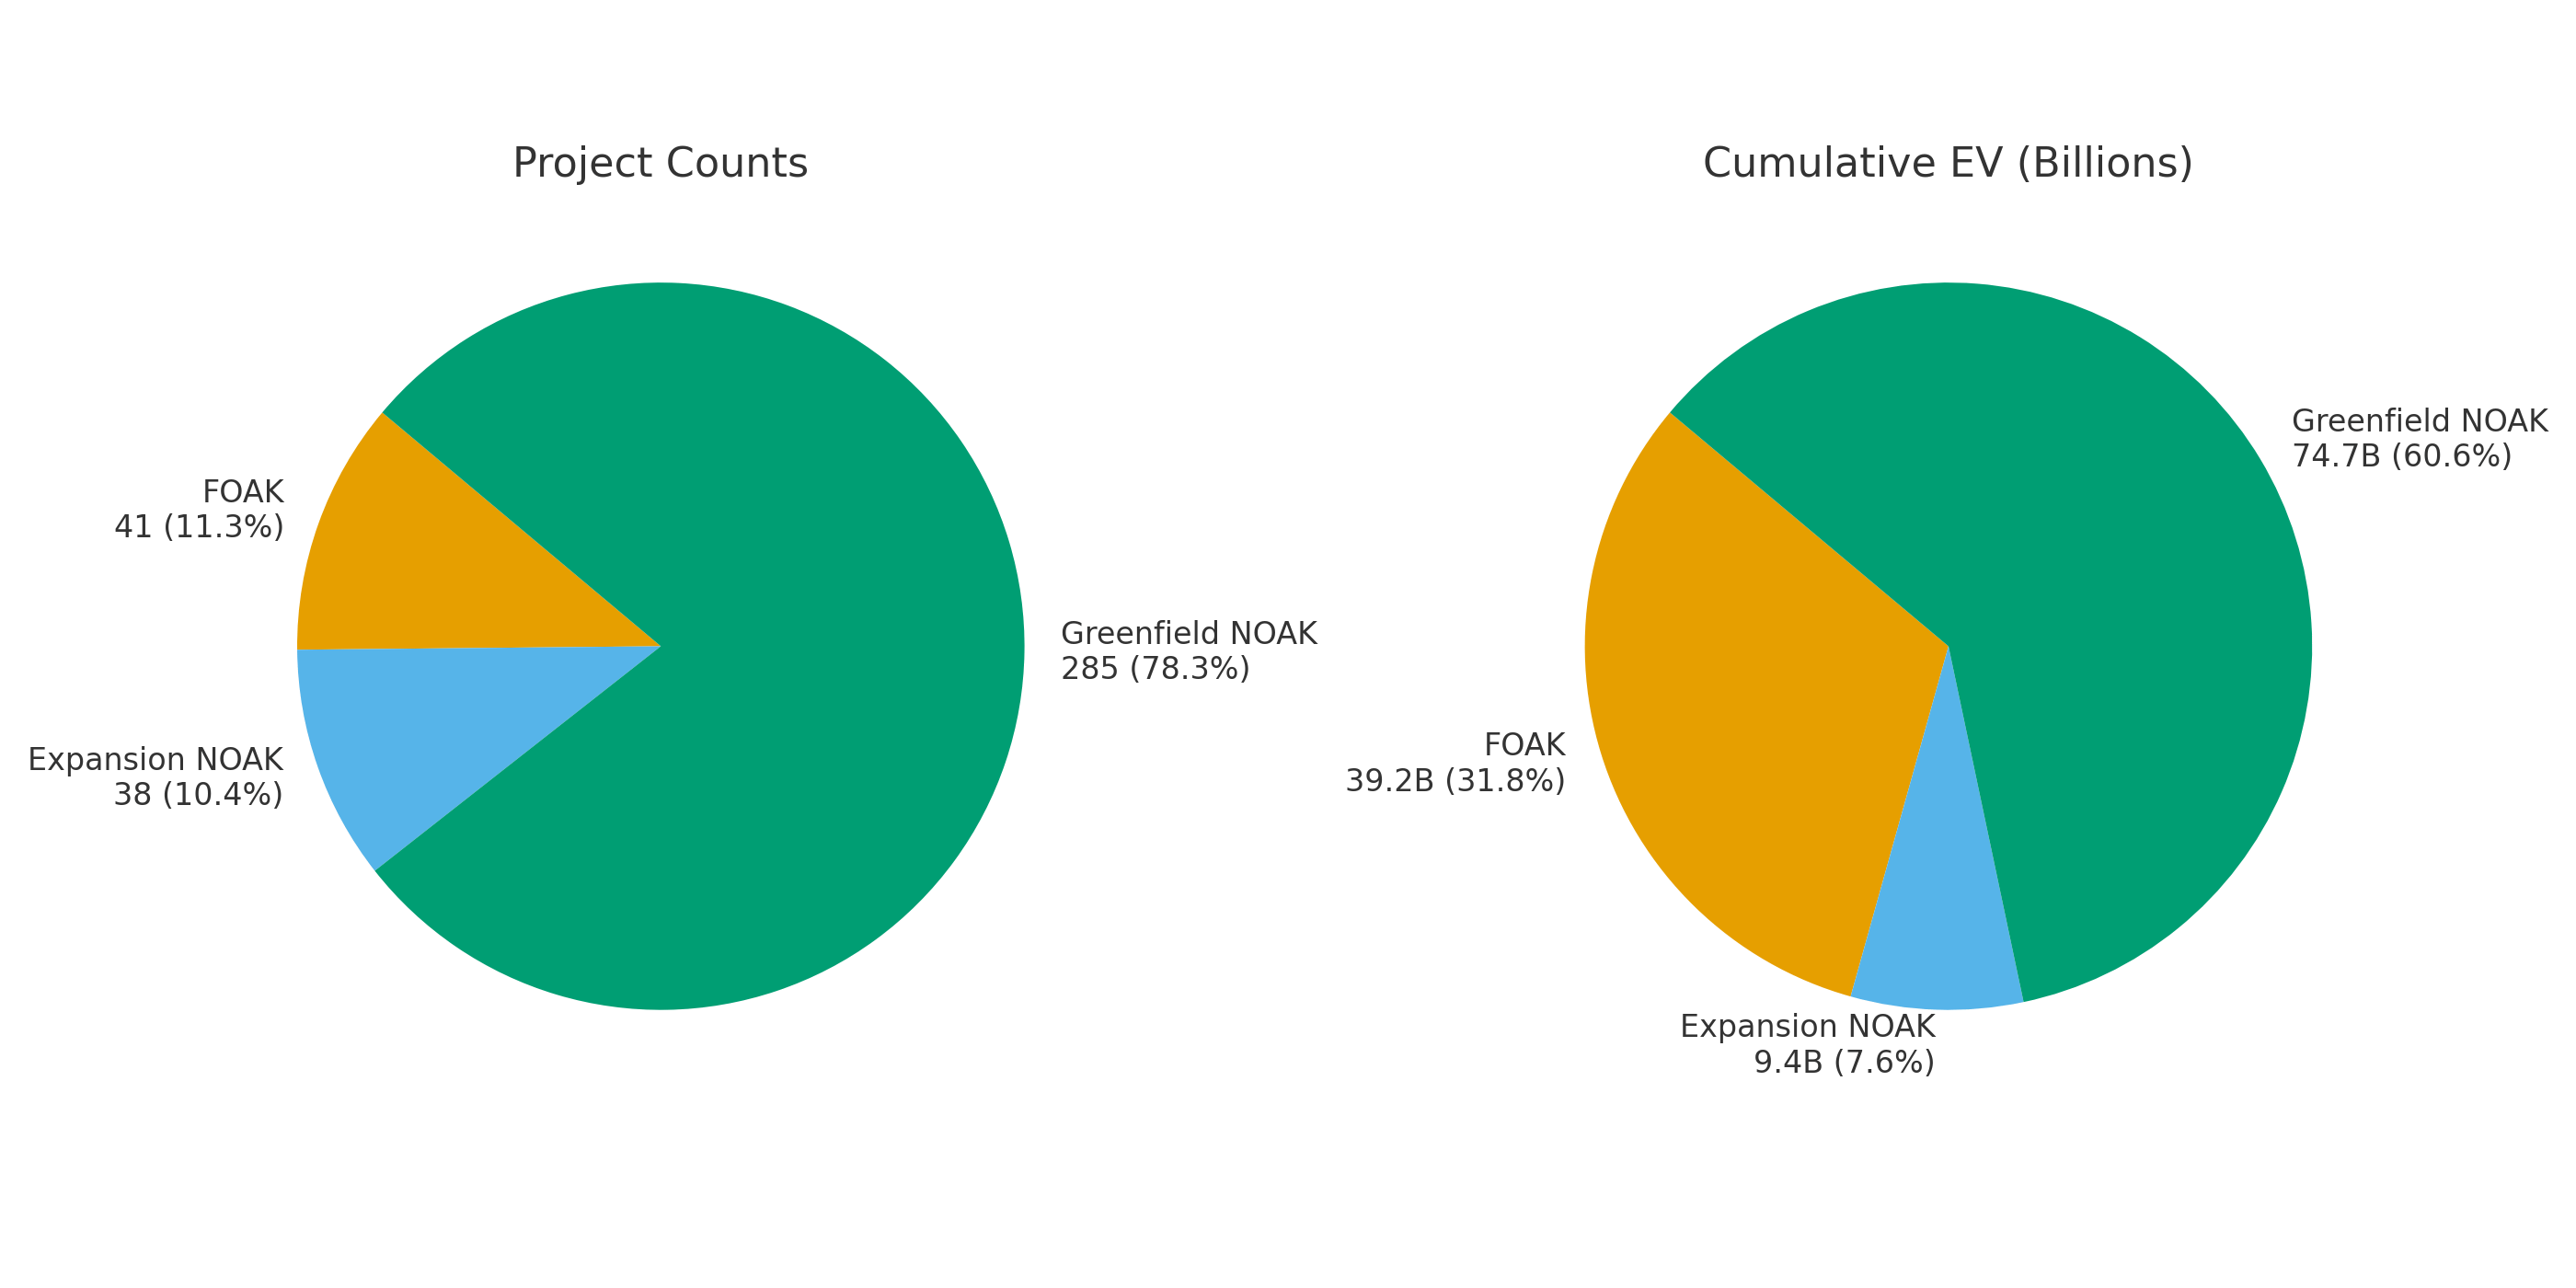
Figure 3: Project Count and Expected Value by FOAK, Greenfield, and Expansion.
Greenfield projects, which account for 89 percent of the dataset, have an average survival probability sitting between FOAKs and NOAKs. Their cumulative EV of $114 billion represents 92 percent of the total pipeline, but that figure is increasingly redistributed away from large FOAK builds toward smaller NOAK ones.
Expansions stand out as the most reliable cohort despite their small number (39 projects total). Their average survival probability is more than 10 percentage points higher than Greenfields or FOAKs, although their cumulative EV is about $9.5 billion, or 8 percent of the total. This confirms what industry experience already suggests: projects that build on existing infrastructure have a far greater chance of reaching operation.
The data underscore that FOAKs are high-risk, high-reward bets. They carry lower probabilities and volatile EVs, making them viable only with concessional finance or strong policy scaffolding. Expansions, by contrast, punch above their weight, offering the most dependable probability-adjusted contributions despite their smaller absolute EV.
The results show why flagship FOAKs face steep odds. In addition, provinces like British Columbia, Quebec, and Nova Scotia combine FOAK incidence with already low modeled probabilities, producing double-whammy projects that see the steepest downward EV revisions. Without extraordinary support that goes well beyond regulatory streamlining, the vast majority of these projects will likely ultimately drop out of the MPI.
Energy Nation’s portfolio triage is now less forgiving of Greenfield FOAK megaprojects and more favorable to mid-sized NOAK expansions. That does not mean FOAK megaprojects will not proceed. But it does mean the bar has been raised. Only with aggressive and sustained policy backing will FOAK megaprojects be able to clear the hurdles baked into their risk profile. The attack of the FOAKs is real. The question is whether Mr. Carney and the Major Projects Office team can tame them or whether smaller, steadier projects will quietly set the pace of the transition.
[1] The model is both accurate at ranking winners and losers (Area Under the Receiver Operating Characteristic Curve, AUC-ROC = 0.836) and well calibrated in its probability estimates (Brier = 0.145), meaning the numbers closely match real-world outcomes.
[2] Of the 272 projects in the 2018–2020 cohort training dataset, 229 were Greenfield (84 percent), 18 were FOAK (7 percent), and 43 were expansions (16 percent).
[3] In addition to the Carney Five, the Prime Minister identified “strategies for projects” that combine FOAK risk with significant province/sector exposure: Wind West Atlantic Energy depends on unprecedented offshore wind build-out and multi-province transmission in eastern Canada; Pathways Plus hinges on CCUS scale-up; the Arctic Corridor attempts a first-of-its-kind northern infrastructure; and Port of Churchill Plus faces sector-specific complexity in turning a seasonal port into a four-season Indigenous-led trade hub.
[4] For the 2018–2020 cohort, the ratio was roughly 14:1 (NOAK to FOAK).
[5] It would be interesting to examine how policy shifts have influenced MPI project composition since 2018–2020. For example, to what degree has new incentives for clean energy have increased the number of higher-risk FOAK and Greenfield projects at the expense of lower risk NOAKs and expansions?
Comments
Nothing yet. Say the first thing.
Sign in to join the conversation.