
Last November, Uniswap published a paper documenting the effect of an auction mechanism on LP profitability (The Protocol Fee Discount Auction, or PFDA). They examined six v3 pools on Ethereum over eight months—Feb through Aug ’25—calculating the LP collective’s net profit using a 5-second markout and presenting the total volume. They also identified the primary arbitrageurs by noting the addresses that executed a disproportionate number of trades that consistently generated profits (this excludes front-end platforms catering to retail, which generally do not generate profits). Using the theoretical model of Milionis et. al. (2025), they estimated that 5% of the arbitrageur’s profit would be transferred to the LPs and quantified the effect on six real v3 pools. The results are presented in the table below.
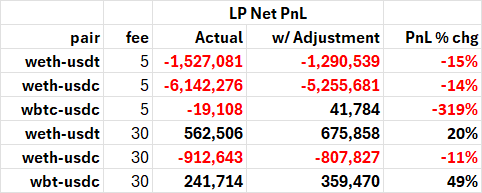
The Uniswap paper notes their proposed auction mechanism would decrease “11-319% in the total LP markout loss.” That is a large range, but averages around 150%. Given that a 150% reduction in loss implies the losing LPs become profitable, this appears to be a major improvement. However, the 319% reduction in loss was achieved by converting a near-zero loss into a gain, thereby exaggerating its economic significance.
In my recent SSRN paper, I presented the variable cost ratio (expenses/revenues) as the LP performance metric.

It isn’t the APY everyone wants, but with v3 pools, capital is ambiguous, so any APY will come with an asterisk. The variable cost ratio is independent of time; when applied to daily or monthly revenue and expenses, it has the same meaning. It is meaningful in a clear and precise way: an expense-to-revenue ratio above 1.0 implies unprofitable LPs; a ratio below 1.0 implies profitable LPs.
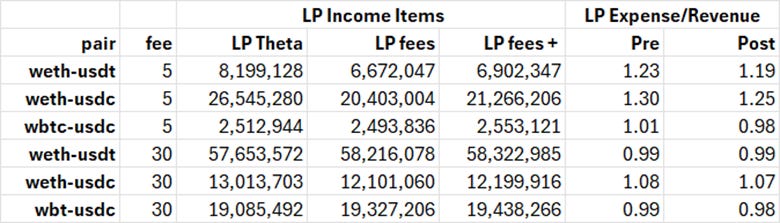
In the table above, I define theta as the LP’s gamma expense. This is also called LVR, and I don’t care what it is called, but to be precise, I used LVR for a particular formula for estimating the LP’s theta (i.e., the Black-Scholes theta formula rederived in Milionis et. al.’s LVR paper). In any case, the LP’s expense, theta, remains unchanged by the PFDA, but a small amount of additional revenue is now added to the LP through this auction. Framed as expense/revenue (theta/fees), the effect is approximately 2% of fees, much less significant-sounding than a 150% reduction in LP losses, especially given the standard error on any 9-month theta/fee ratio is about 0.05 (you get different numbers based on the markout horizon, whether you exclude the transacations than are really LP trades, etc.).
As the average v3 LP loses about 14% more than their fees (exp/rev ~ 1.14), a 2% of fee increase in LP revenue won’t change much even if it works. Given that the Milionis model also predicts that LP losses from arbitrage are proportional to the square root of blocktime, and that there is no significant difference in L2 versus Ethereum LP profitability (as documented in my SSRN paper), there is good reason to be skeptical of the model's predicted impact. [blocktimes are 0.25-2.0 vs. 12 seconds for L2s and Ethereum, respectively].
Informative LP data are difficult to find online, as the default LP performance metric is an APY defined as gross fee revenue plus inflationary token rewards, divided by total value locked, annualized. This is analogous to option dapps that present option premiums in terms of an APY. The LP’s expense is not an abstruse hypothetical, such as the academically popular hedge-funding sniping expense, because otherwise it would be easy to get rich trading options (where theta is present-valued in the option value).
A net LP pnl is significantly better, but the problem with presenting net profits is two-fold. First, as shown above, percent changes in profits are misleading when they begin near zero. Thus, a 319% reduction in losses is really a change from losing 0.8% on each dollar in fees to making 1.7%, which is really no difference at all given the standard error on the LP’s expense estimate (at least 5%). Secondly, profits are obviously not comparable across pools of different sizes and are not amenable to standard errors because they are not stationary. Stationarity is why people generally refer to stock returns rather than dollar returns: a 10% stock return means the same thing regardless of the initial stock price, whereas a $10 stock profit is more ambiguous. Thus, I used the variable cost ratio to present LP performance data.
However, another LP metric is PnL expressed in basis points relative to the traded numeraire. This is slightly better, in that it is comparable across different pool sizes, other things being equal. Uniswap’s paper also reports its effect in basis points.
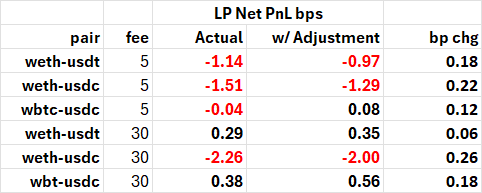
The problem with PnL per USD (or ETH) traded for LP positions is that it also depends on the Pool’s fee and asset volatility, so a 0.5 bp effect can be large or small depending on these factors. For example, consider two pools with the same liquidity and leverage (as indicated by the range width) but different fees. The LPs choose a range width, yielding leverage k times that of a v2 LP (e.g., a symmetric 20% range yields k=10 compared to v2). Their expected return is thus the fee revenue, fee rate times volume (ADV is average daily volume), minus the theta expense, divided by LP position value (below, it's the v2 capital divided by k).
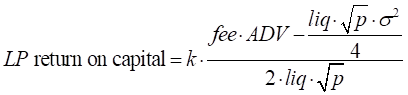
In equilibrium, the return should be the same across pools, analogous to the equity risk premium for two stocks with identical betas. For two pools that differ only in the fee, say 5 vs. 30 bps, the denominator is the same, as is the theta (the expense term in the numerator). This implies:

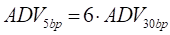
If the ADV of the 5 bp pool is 6 times that of the 30 bp pool, the LP PnL per USD traded should be 6 times higher for the 30 bp pool than the 5 bp pool, though they are equally profitable. Thus, a 0.5-bp effect is likely insignificant in 30-bp pools. A similar effect occurs with variance, because the LP’s expense is linear in variance, so LP positions identical in every way but the asset variance will be different for equally attractive LP positions. The variable cost ratio (expense/revenue) is less intuitive than a PnL expressed in basis points or raw profit, but it does enable comparability across pools of varying sizes, fee rates, and assets.
Another takeaway I drew from Uniswap’s PFDA paper was that, like many others, they should simplify their LP performance data by adopting a simpler approach. The difficulty in creating 5-second markout LP net PnLs is implicit in that they presented data on only 6 pools over 8 months, listing 9 authors. If they had used a simpler algorithm, they could have generated 10 times as much data with the same effort. The perfect is the enemy of the good; a simpler approach, using only swap event logs, would generate comparably efficient data for an 8-month sample period. In contrast, joining swap event logs with second-downsampled CEX data is a major pain because there are always parochial anomalies when combining two large datasets (swap event logs and second-downsampled CEX data). The details are in my SSRN paper, but in general, you can use end-of-day markouts and exclude transactions that are 10 times the median liquidity. More data is better data, and no LP performance metric generates an unambiguous picture of LP performance the way that stock market index returns are calculated.
A notable feature of DeFi is that virtually all major AMM protocols do not measure their LPs net PnL. One would think that if a management team had over $100 million in wealth based on these businesses, it would be of paramount importance. If the LPs on your most popular v3-ish pools are losing money, that’s not sustainable, and you can’t improve something you do not measure. If you have no clue how to measure LP profitability, just put $1000 in each of your top 100 pools. Create a program to query the positions each day to track the LP’s token balances, then throw the daily data into ChatGPT and ask, ‘How am I doing?’
I can understand why someone with a short time horizon would ignore this data and focus on reward programs to bump key performance indicators that boost their token, but everyone? Even crypto academics are uncurious about v3 LP profitability, as Del Monte et al. (2025) highlight that only a small minority of papers in this subject present actual data; moreover, the data presented in these few empirical papers are ambiguous (e.g., scatter plots or graphs of non-stationary data).
There is a significant opportunity for a new AMM, as it would compete with businesses that have not tracked LP expenses for years and show little interest in doing so.
No posts
Comments
Nothing yet. Say the first thing.
Sign in to join the conversation.