
Para leer esta publicación en español (traducida automáticamente por Google), haga clic aquí.
Can you help? We are working to make earthquake science accessible to the public, but this effort is entirely supported by readers like you. If you can, please consider supporting our work by upgrading to a paid subscription. If you use our Substack as part of a group, or for teaching, consider a teaching or institutional subscription. Every paid subscription makes a real difference — and unlocks access to the more than three hundred posts in our archive!
At 7:34 AM local time on August 10, 2026, a magnitude 7.4 earthquake struck below western Colombia.
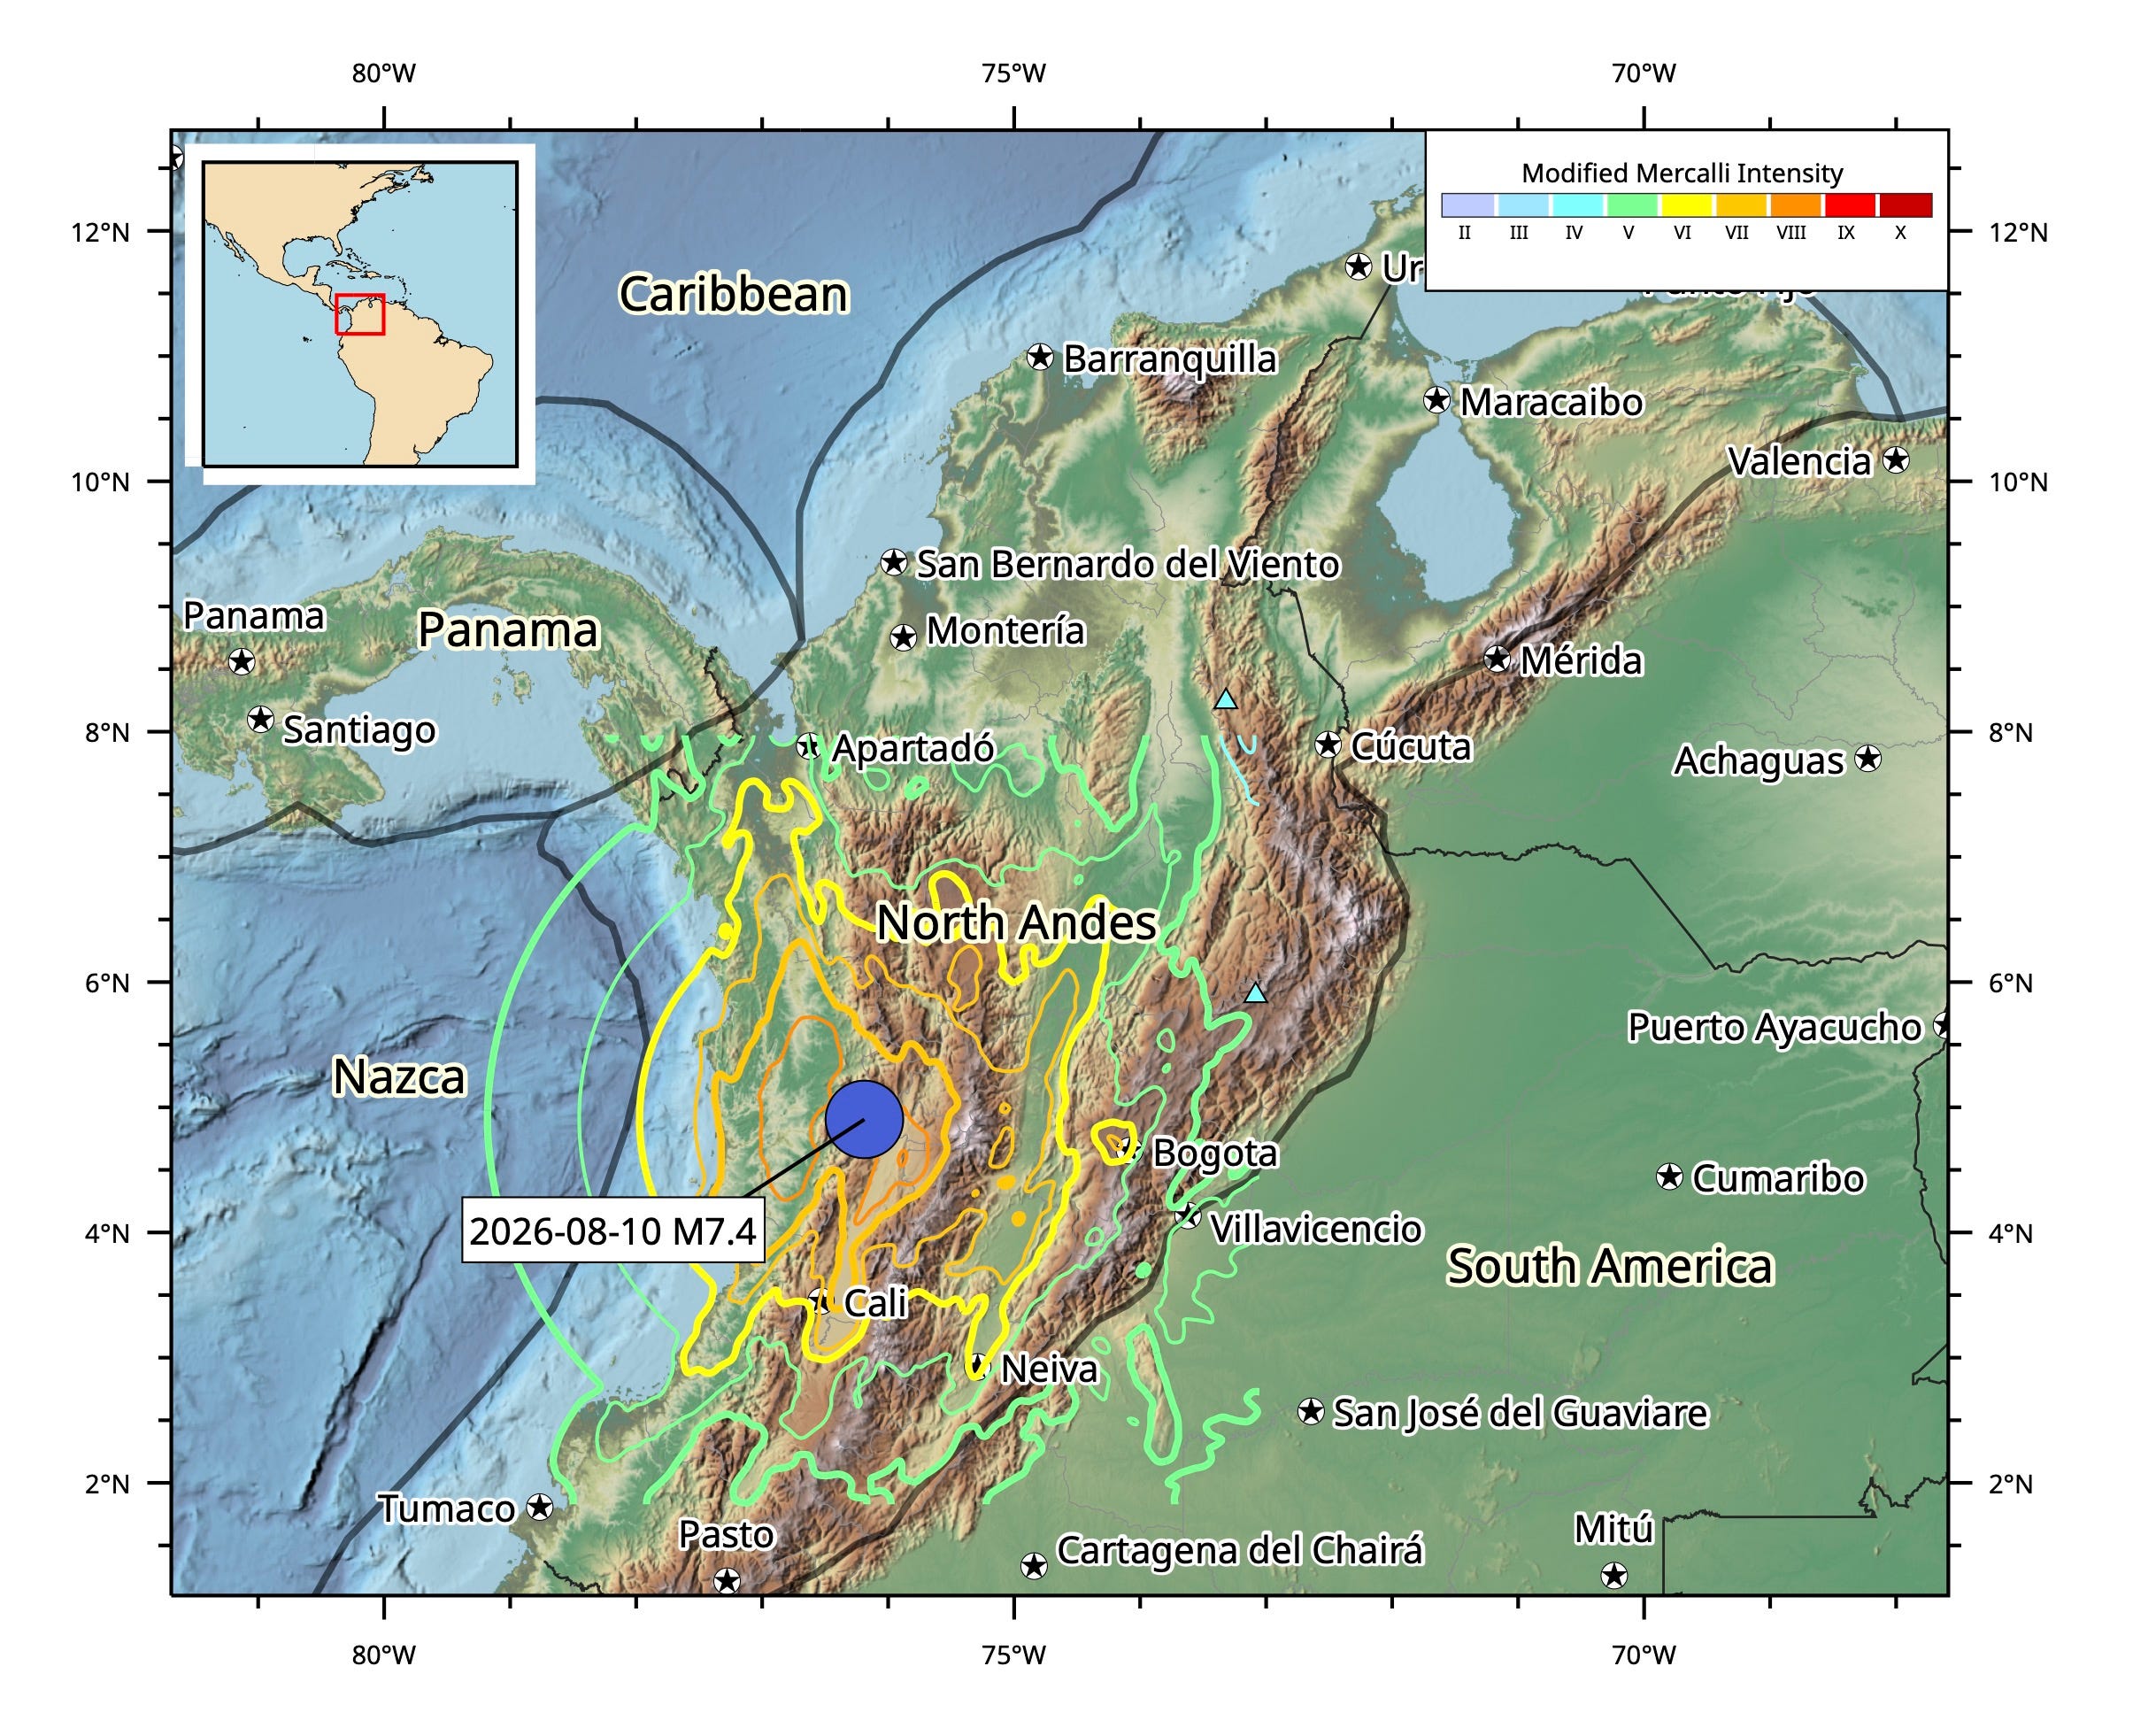
Earthquakes are a regular occurrence in Colombia; the country is bordered to the west by a subduction zone, and the whole western half of the country lies within an actively deforming region know as the North Andes block.
Here is a map showing recorded earthquakes across the North Andes Block. We have labelled all events above magnitude 7.4. This is clearly the largest instrumentally recorded event on record in the region, although larger earthquakes have occurred in the south, along the subduction megathrust.
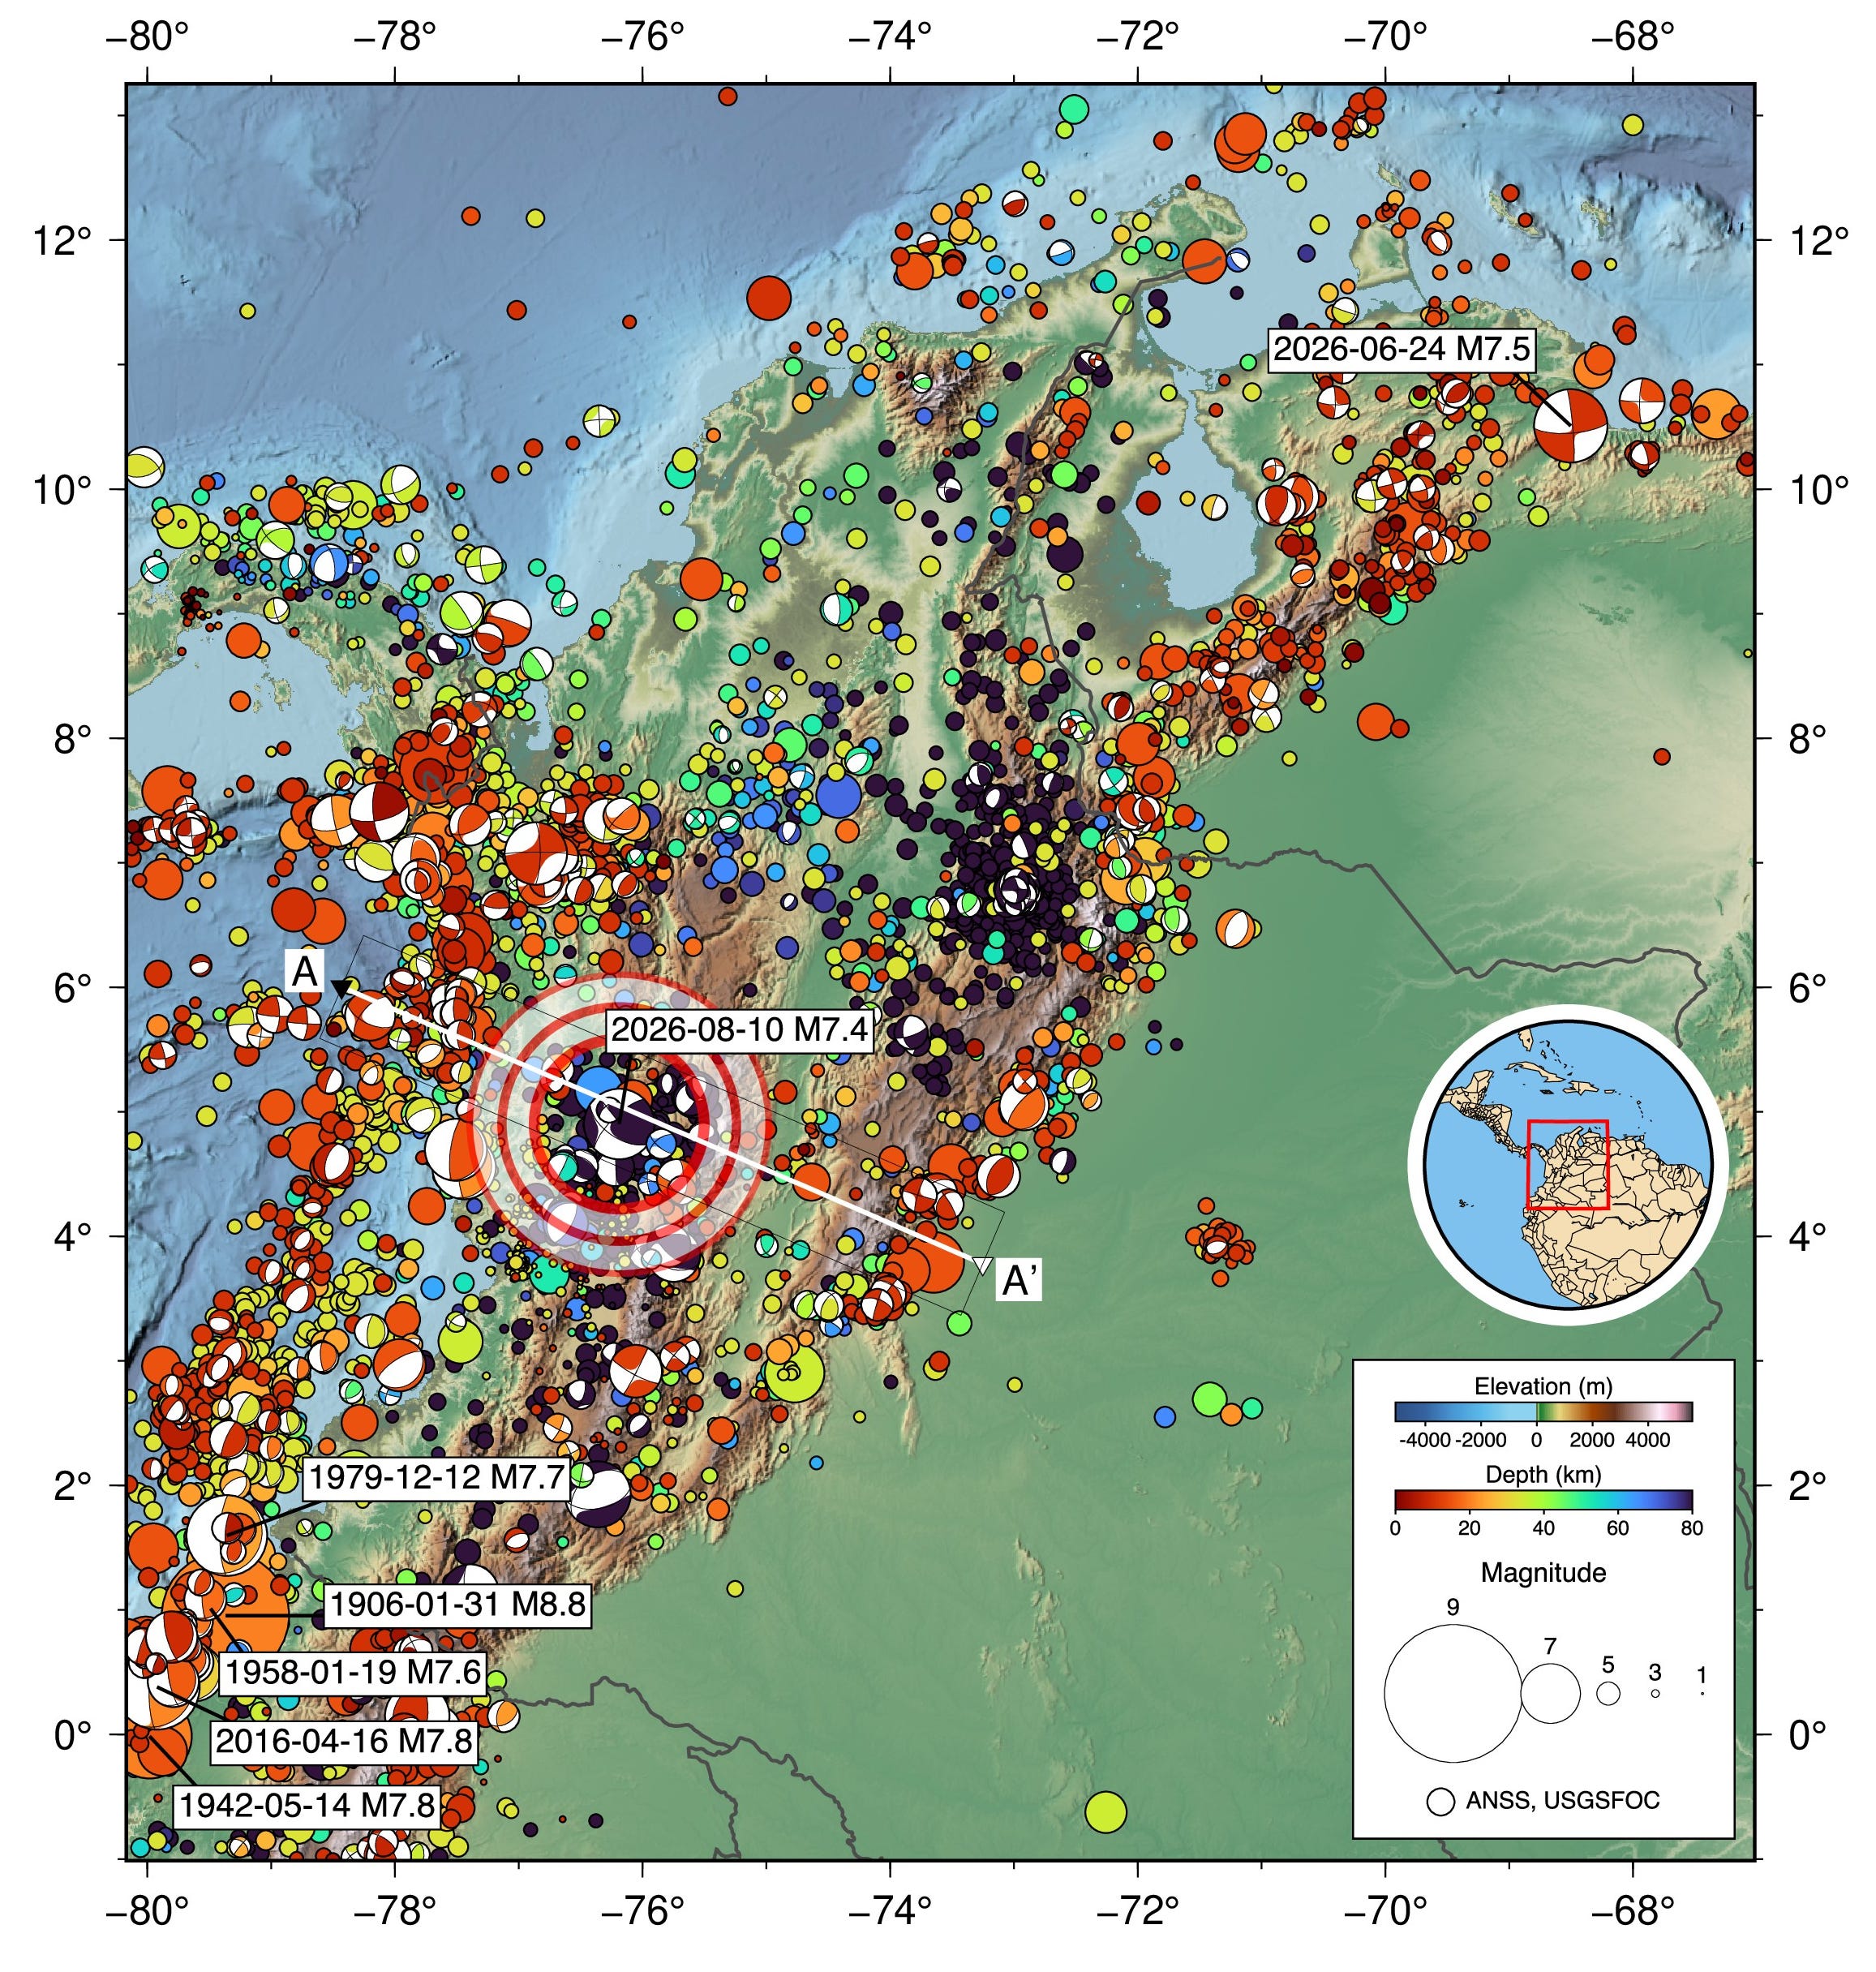
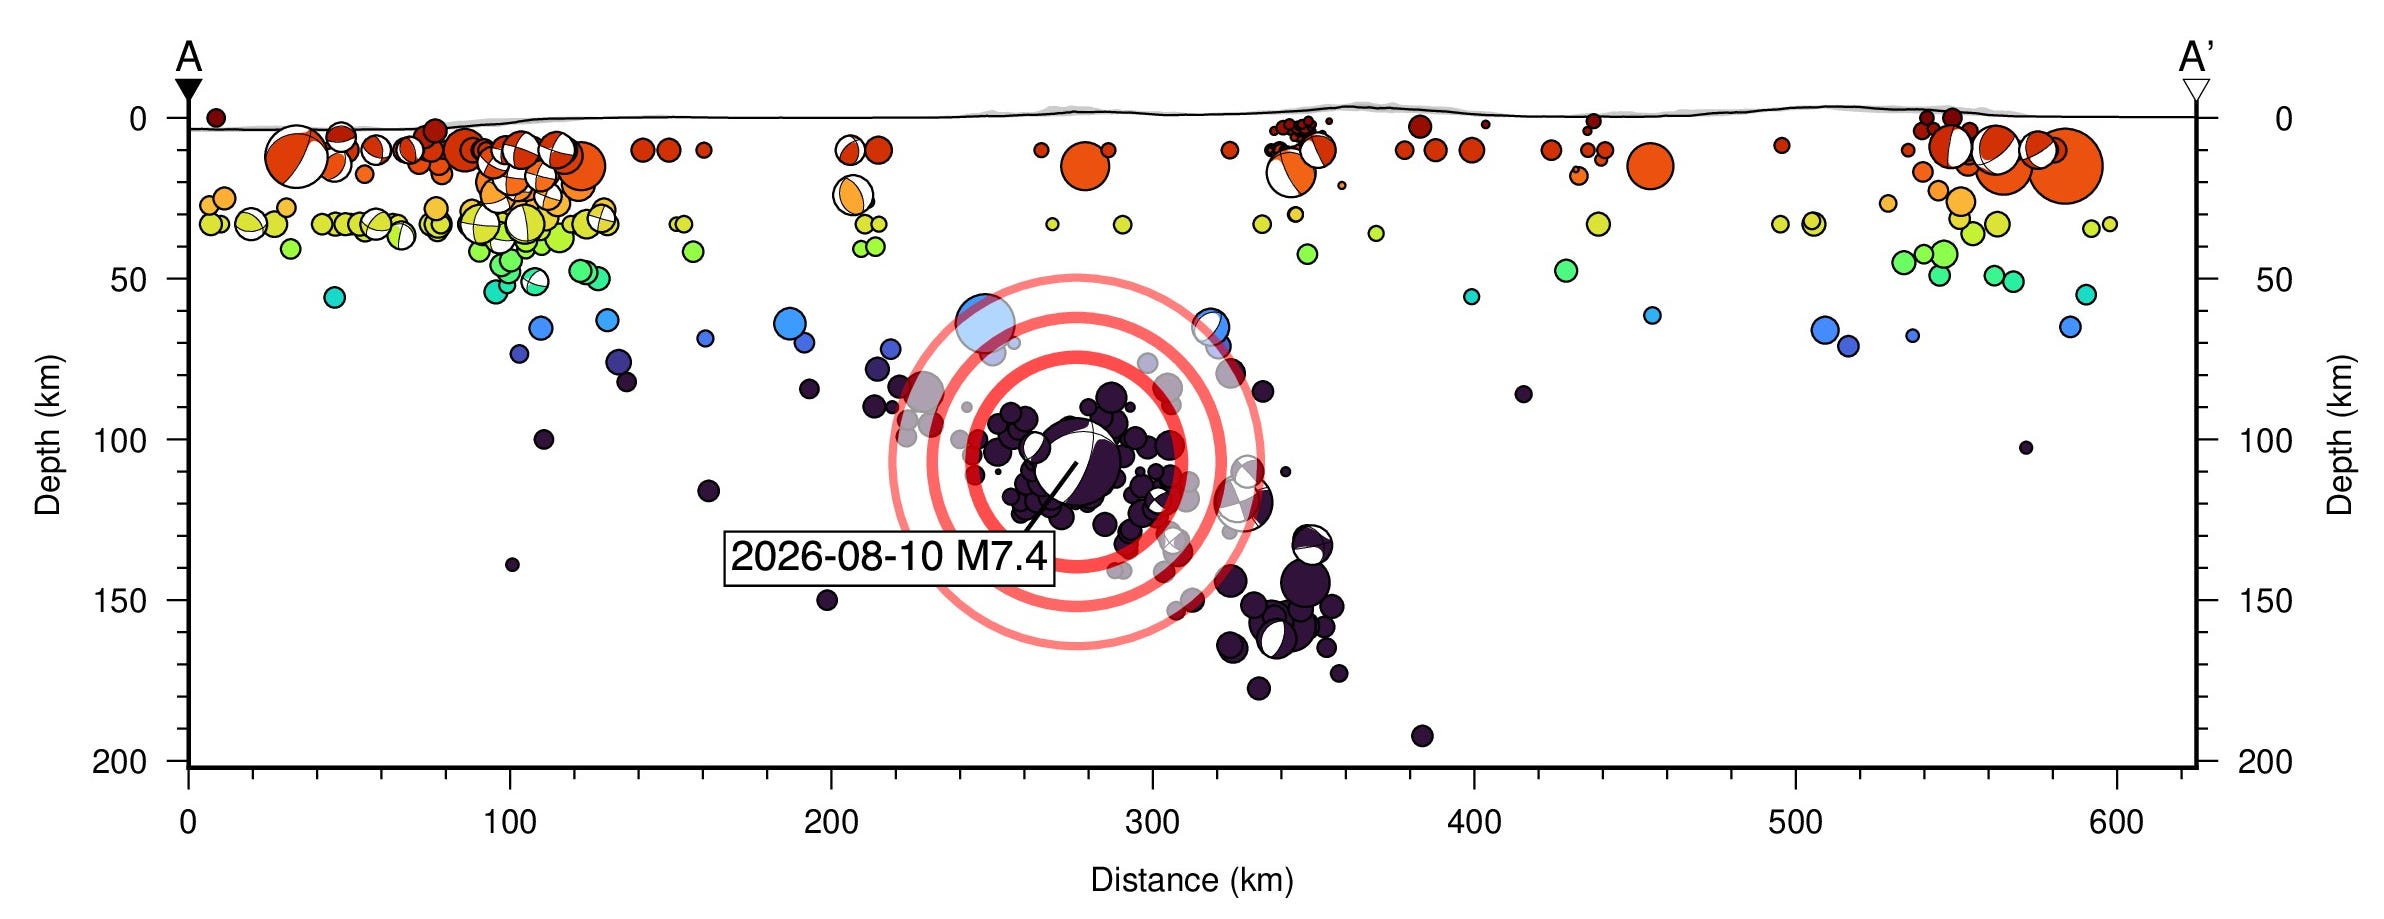
So, how does the recent magnitude 7.4 earthquake fit into this picture? The epicenter is right in the middle of the North Andes Block. But the depth tells us that the earthquake occurred actually occurred within the plate that is subducting beneath the North Andes Block. Intra-slab earthquakes like this occur because the slab is bending and heating up as it makes its slow way down into the mantle. However, the exact physical mechanisms that cause large intra-slab earthquakes are still hotly debated.
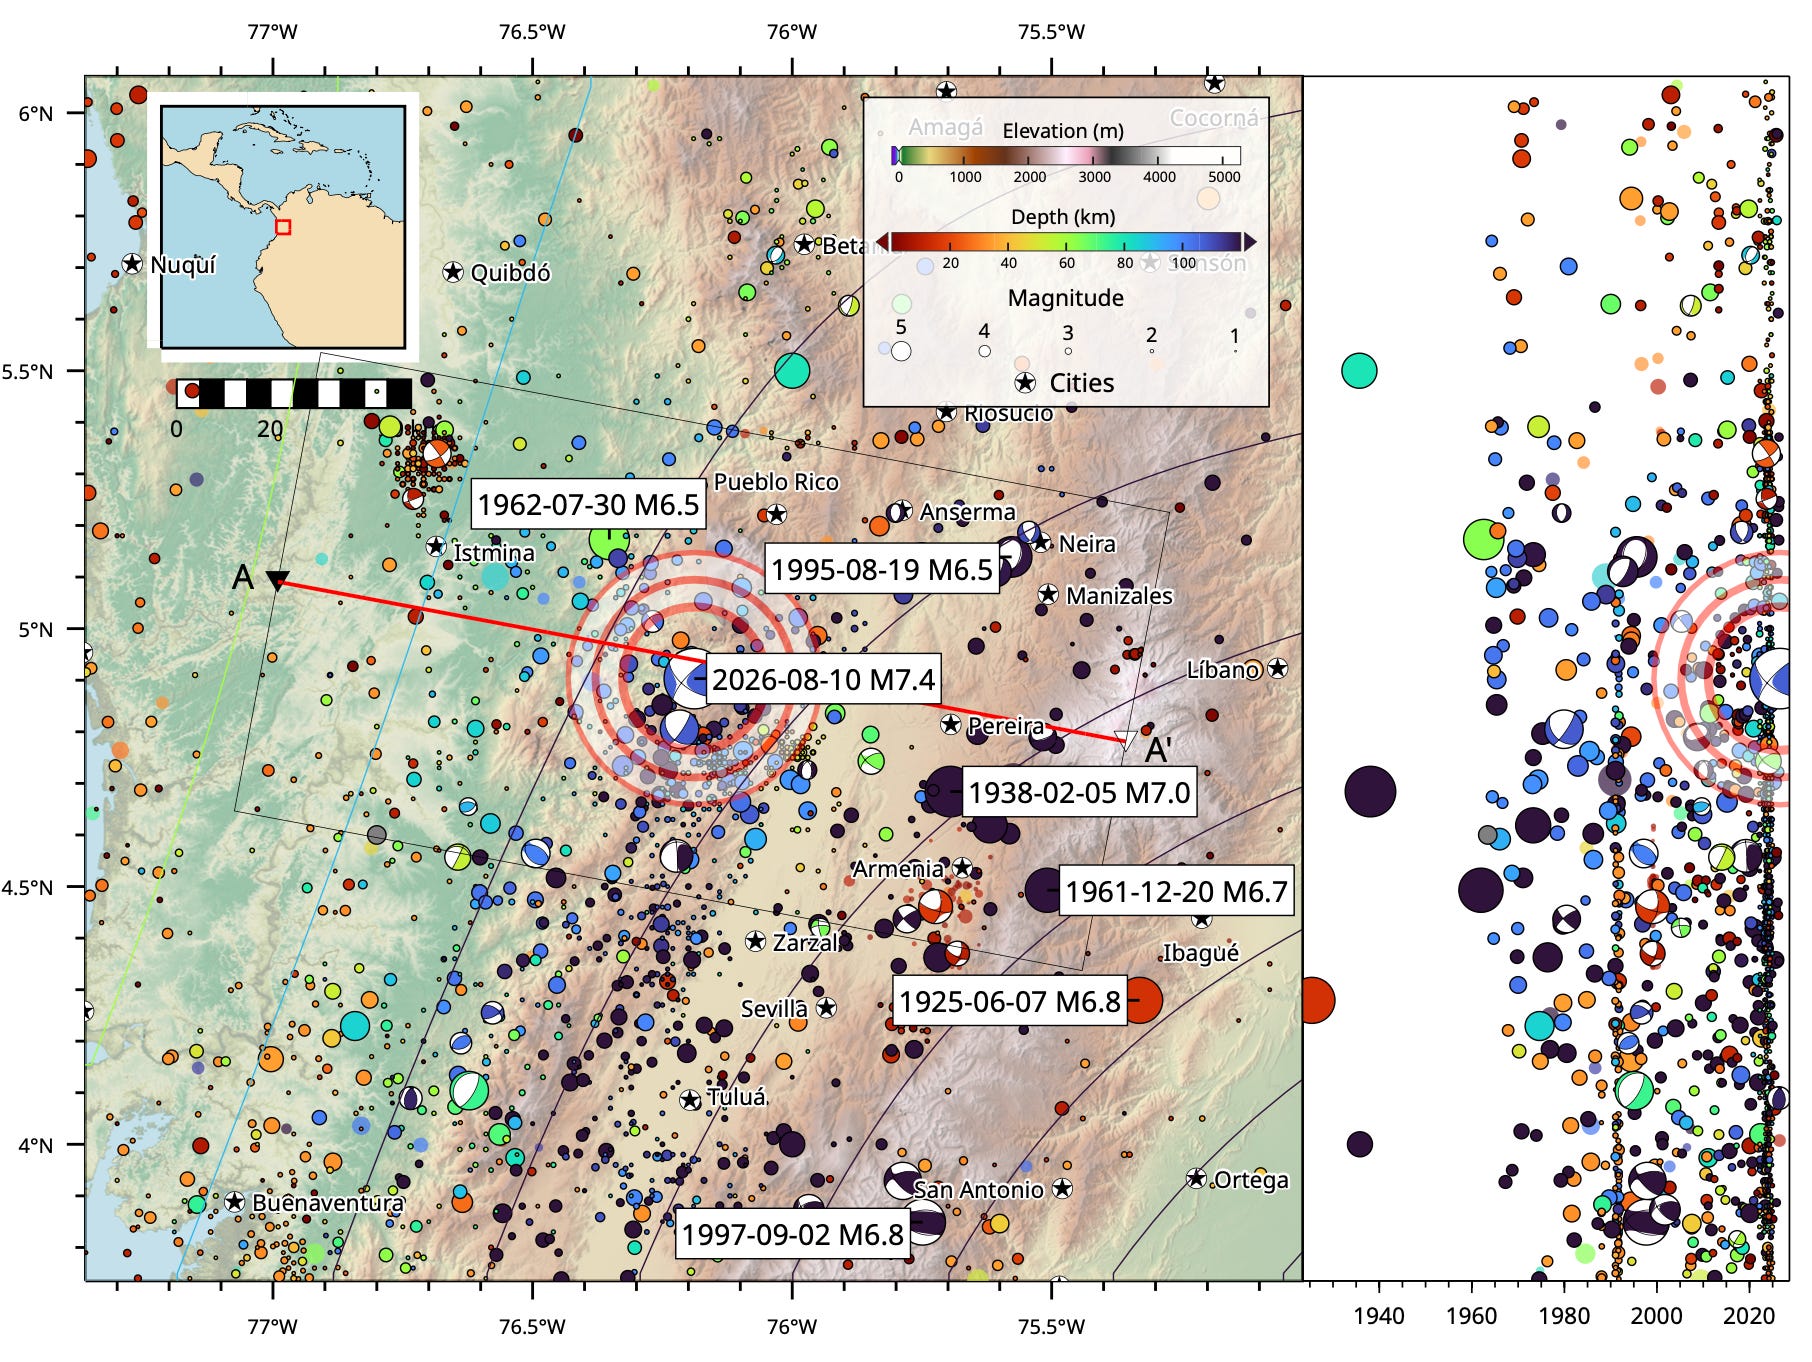
The affected region is no stranger to earthquakes; a map of recorded seismicity shows a spread of events, from deep to shallow. However, this is the largest event ever recorded in this part of Colombia. Prior to today, the largest previous event in the map area was a magnitude 7 earthquake in 1938, and the most recent earthquake of magnitude 6.5 or larger was in 1995. Thus, this earthquake likely represents the first time that most of the existing buildings and infrastructure across this region have been tested by strong shaking.
News reports out of Colombia show that this was a very serious event, with at least sixty-nine deaths and collapsed buildings. The early USGS PAGER estimate is level orange: most likely 100-1000 fatalities. We will discuss this type of estimate further in a moment.
We know that the reporting is still incomplete; even during the writing of this post, we have updated the death toll twice already. Videos of buildings shaking and then collapsing are appearing on social media in increasing numbers. A person in Restrepo, 121 kilometers away, wrote: “I was in school and the teacher’s lounge fell in front of us.” (Estaba en el colegio y la sala de profesores se cayó frente a nosotros.)
That news may sound dauntingly familiar: less than two months ago, a magnitude 7.5 earthquake struck Venezuela, with horrifying consequences. The death toll in Venezuela currently stands above 6,000, with tens of thousands of people still missing. That earthquake, too, featured death tolls that started low and then grew over time.
While the Venezuela earthquake is certainly on everyone’s mind, this earthquake in Colombia is quite different in nature, and its impacts will also look somewhat different. The main difference is that the earthquake beneath Colombia occurred at 110 kilometers depth, rather than right at the surface like the Venezuela rupture.
Deep earthquakes tend to produce a characteristic shaking pattern, with the strongest shaking centered near the epicenter, falling off only slowly with distance. The strongest shaking is much less intense than it would be for a shallow event of the same magnitude, but it is also spread out over a larger area.
This is simply a consequence of geometry. Areas around the epicenter (at Earth’s surface) are still 110 kilometers away from the hypocenter (deep inside Earth). Areas 100 kilometers away from the epicenter are only 148 kilometers away from the hypocenter. This is the Pythagorean theorem at work! So, there is a large area at the surface that is all approximately the same distance from the earthquake at depth.
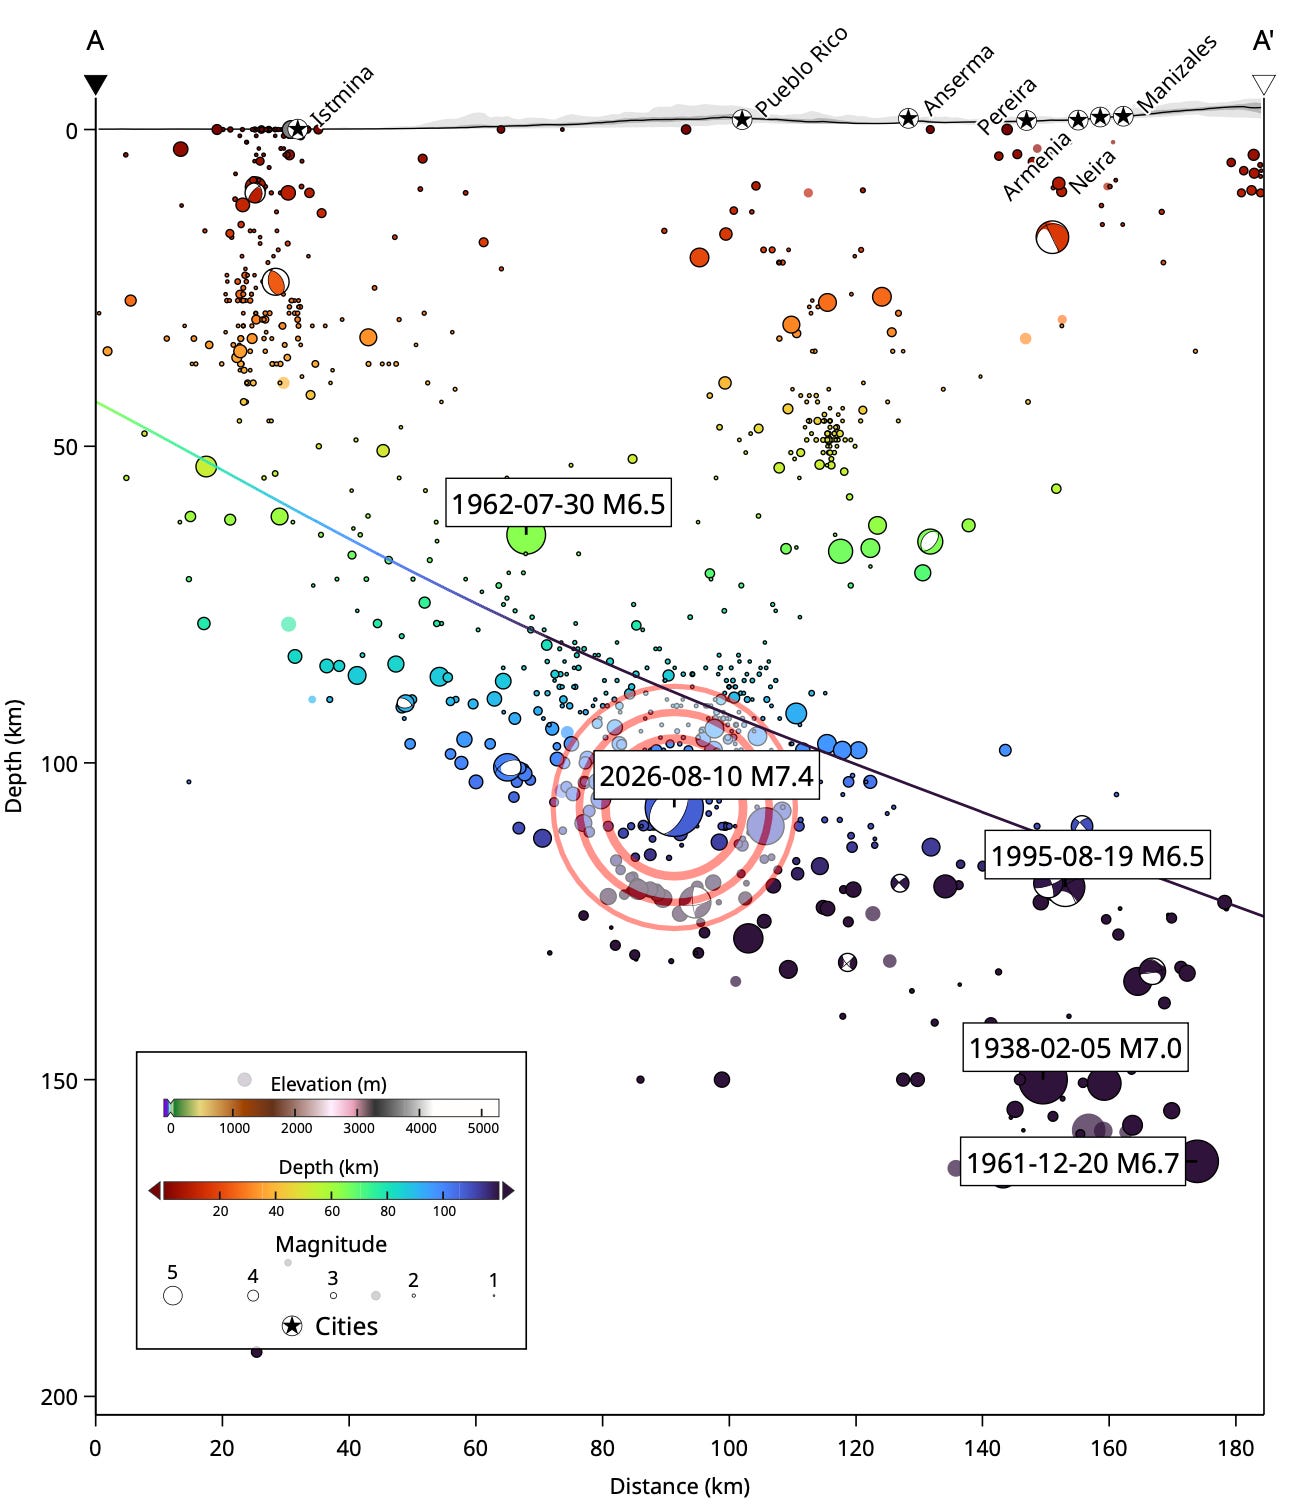
While we can’t measure the motion of the ground everywhere, we have enough understanding of the physics of earthquakes and the structure of the Earth to produce rapid estimates.
The following figure shows two similar models, one produced by the USGS (right panel), and one produced by the Servicio Geológico Colombiano (left panel). The maps show estimates of the maximum acceleration, as a percentage of g, the acceleration due to gravity — 9.81 meters per second squared.
Both of these maps show the general bulls-eye pattern of a deep earthquake. However, they also indicate that mountainous epicentral area itself likely did not experience the largest ground accelerations; rather, the surrounding lower elevation areas did.
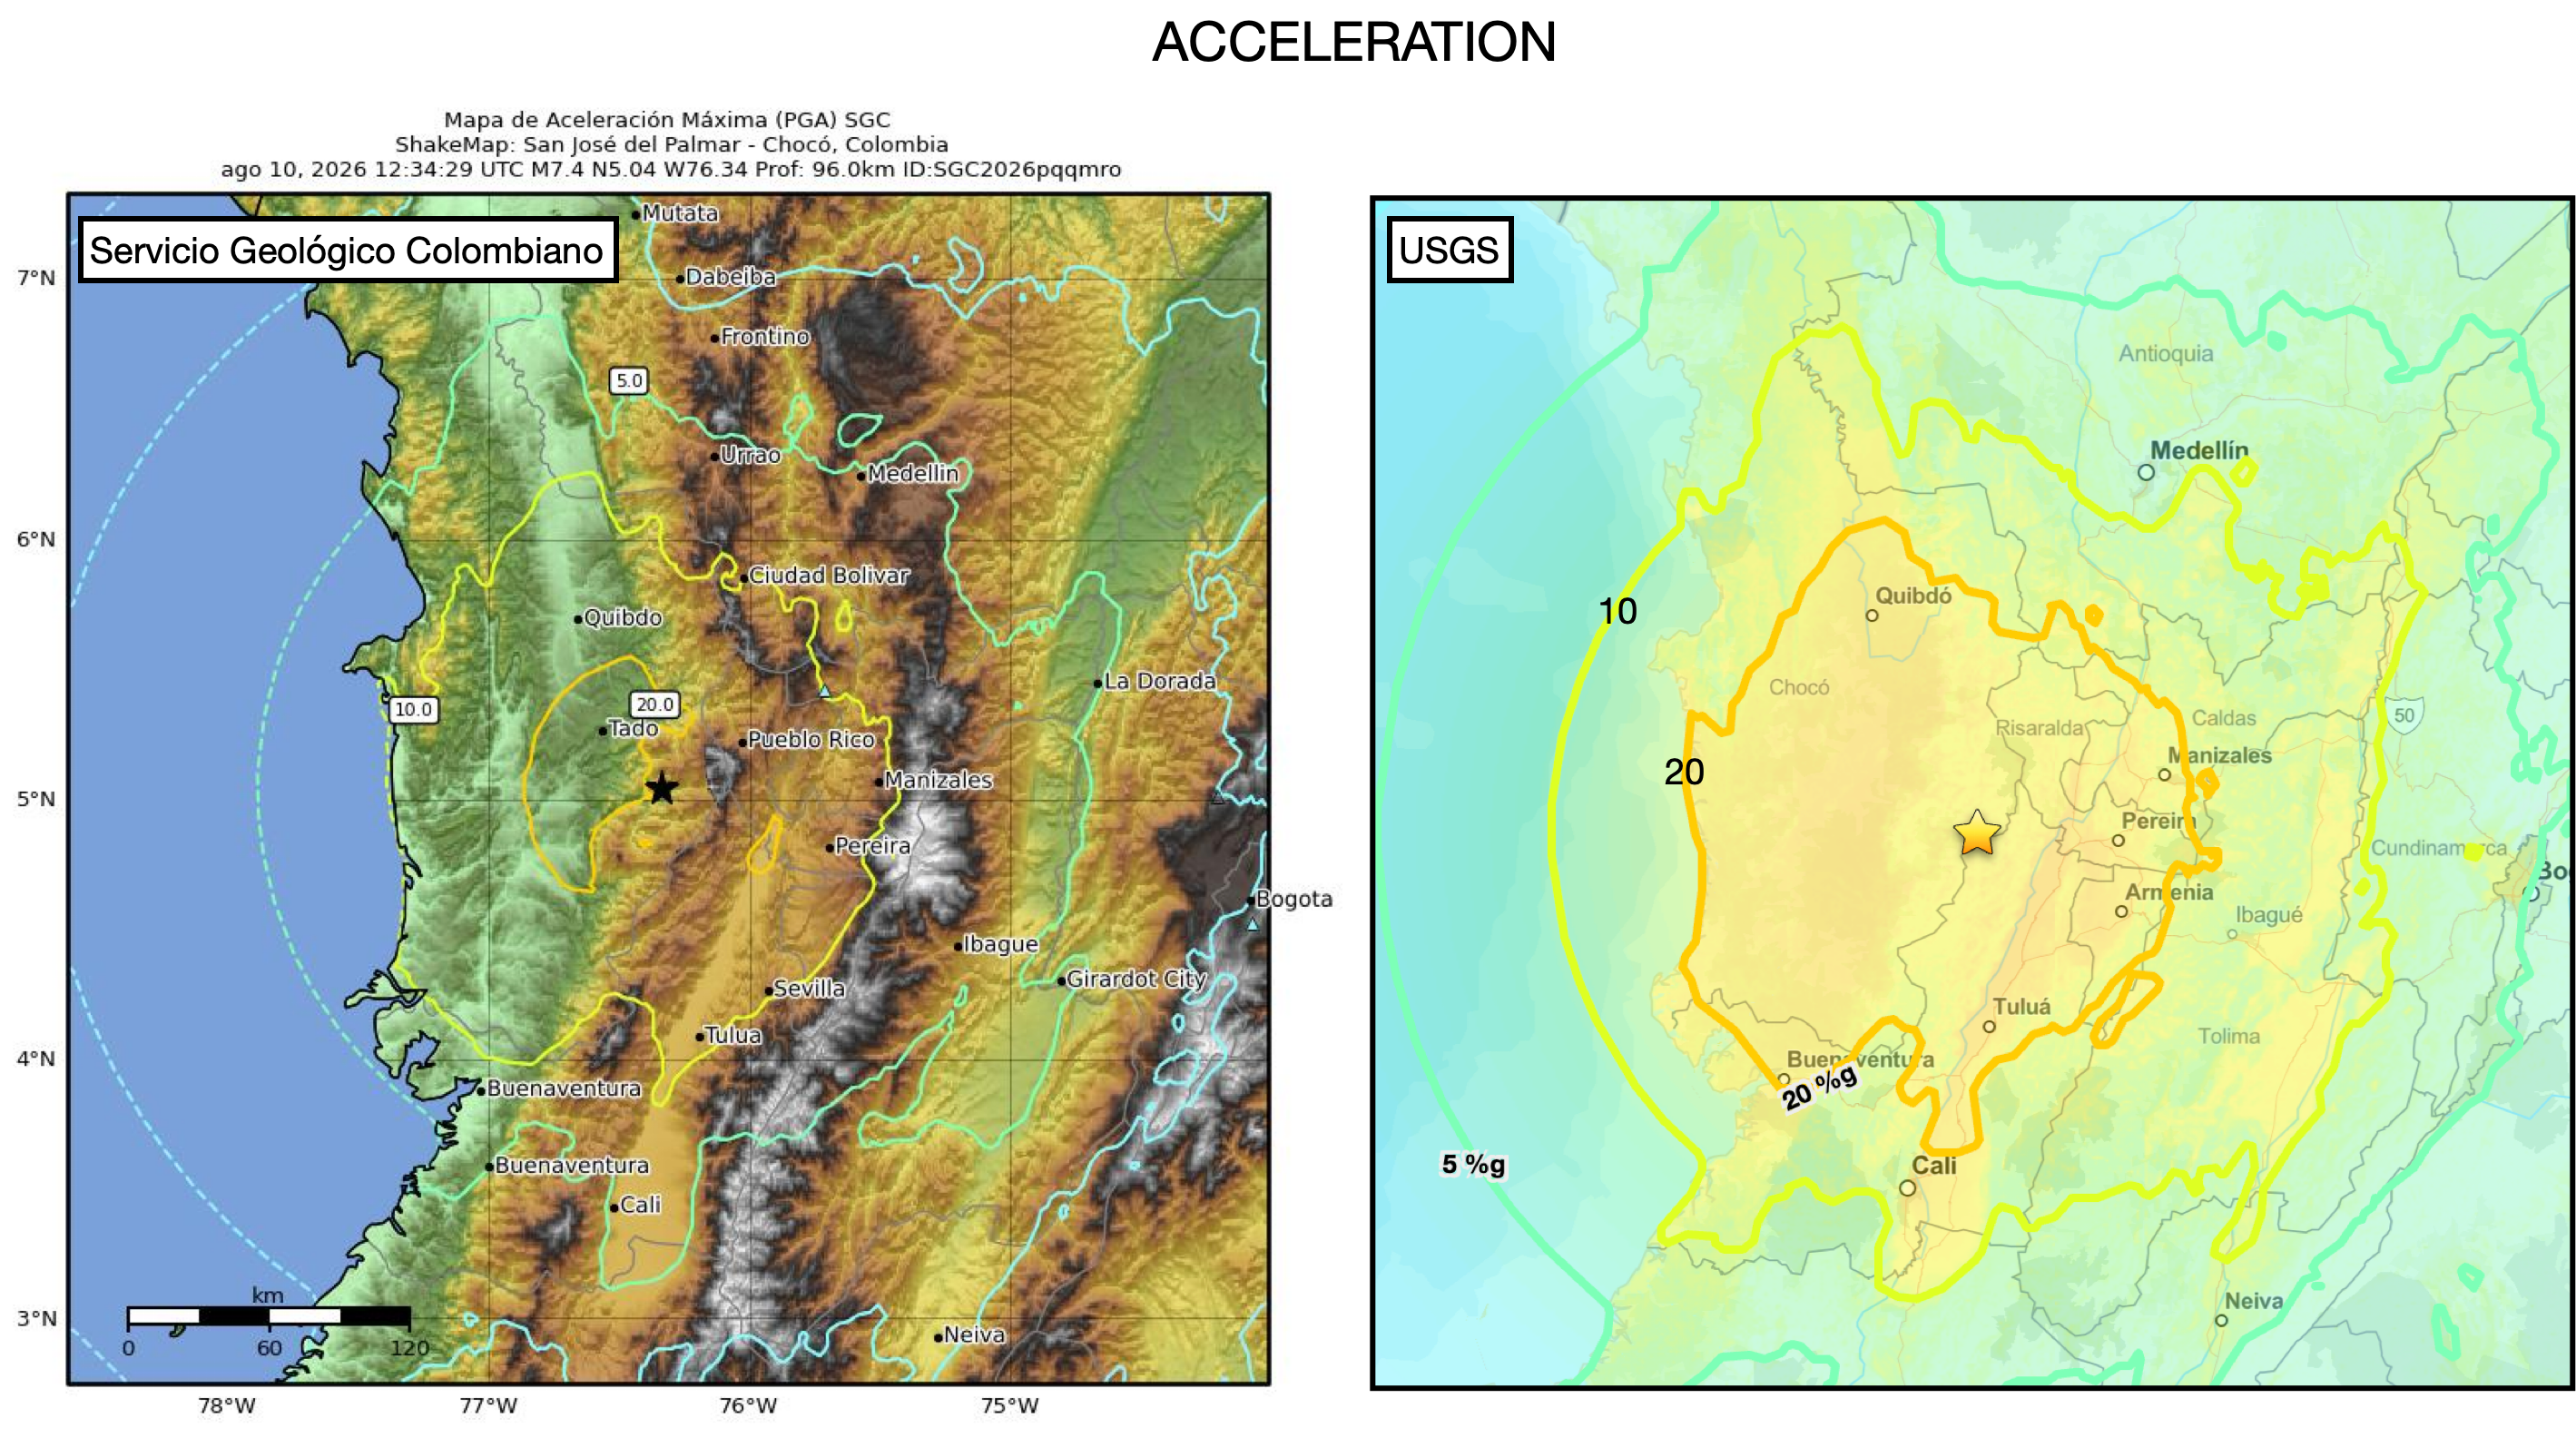
This pattern arises because ground shaking is amplified when seismic waves pass from solid rock info soft sedimentary rocks, which are more typically found in basins rather than in mountains. This pattern is also of great importance for damage, because the low valley located east of the epicenter is densely populated. As we noted in our discussion of a recent earthquake in the Peruvian highlands, these flat-bottomed mountain valleys are particularly good places to live, and have historically supported large populations.
You might notice that the USGS model predicts much stronger ground accelerations over a much larger area, as compared with the SGC model. This disparity arises from the data: the SGC has data from around 119 local seismometers, while the USGS model does not incorporate local data. Thus, we prefer the SGC model in this case. Notably, the SGC model is produced with the same software as the USGS model (ShakeMap), thanks to a long-running effort to support adoption of the USGS code by international organizations.
Edit, 2026-08-10, 5:50 PM EST: See below for the comment by Dr. David Wald at the USGS, clarifying the data underlying the SGC and USGS models and why they are different — and suggesting that the USGS model is likely more accurate in this case.
Although we usually present maps of shaking intensity — a metric that turns the shaking into a single Roman numeral representing the overall impact — here we are showing maps of maximum acceleration and maximum velocity. That is because the SGC’s own map of shaking intensity doesn’t have any contours on it, making it harder to compare directly. Here are similar maps of the maximum ground velocity:
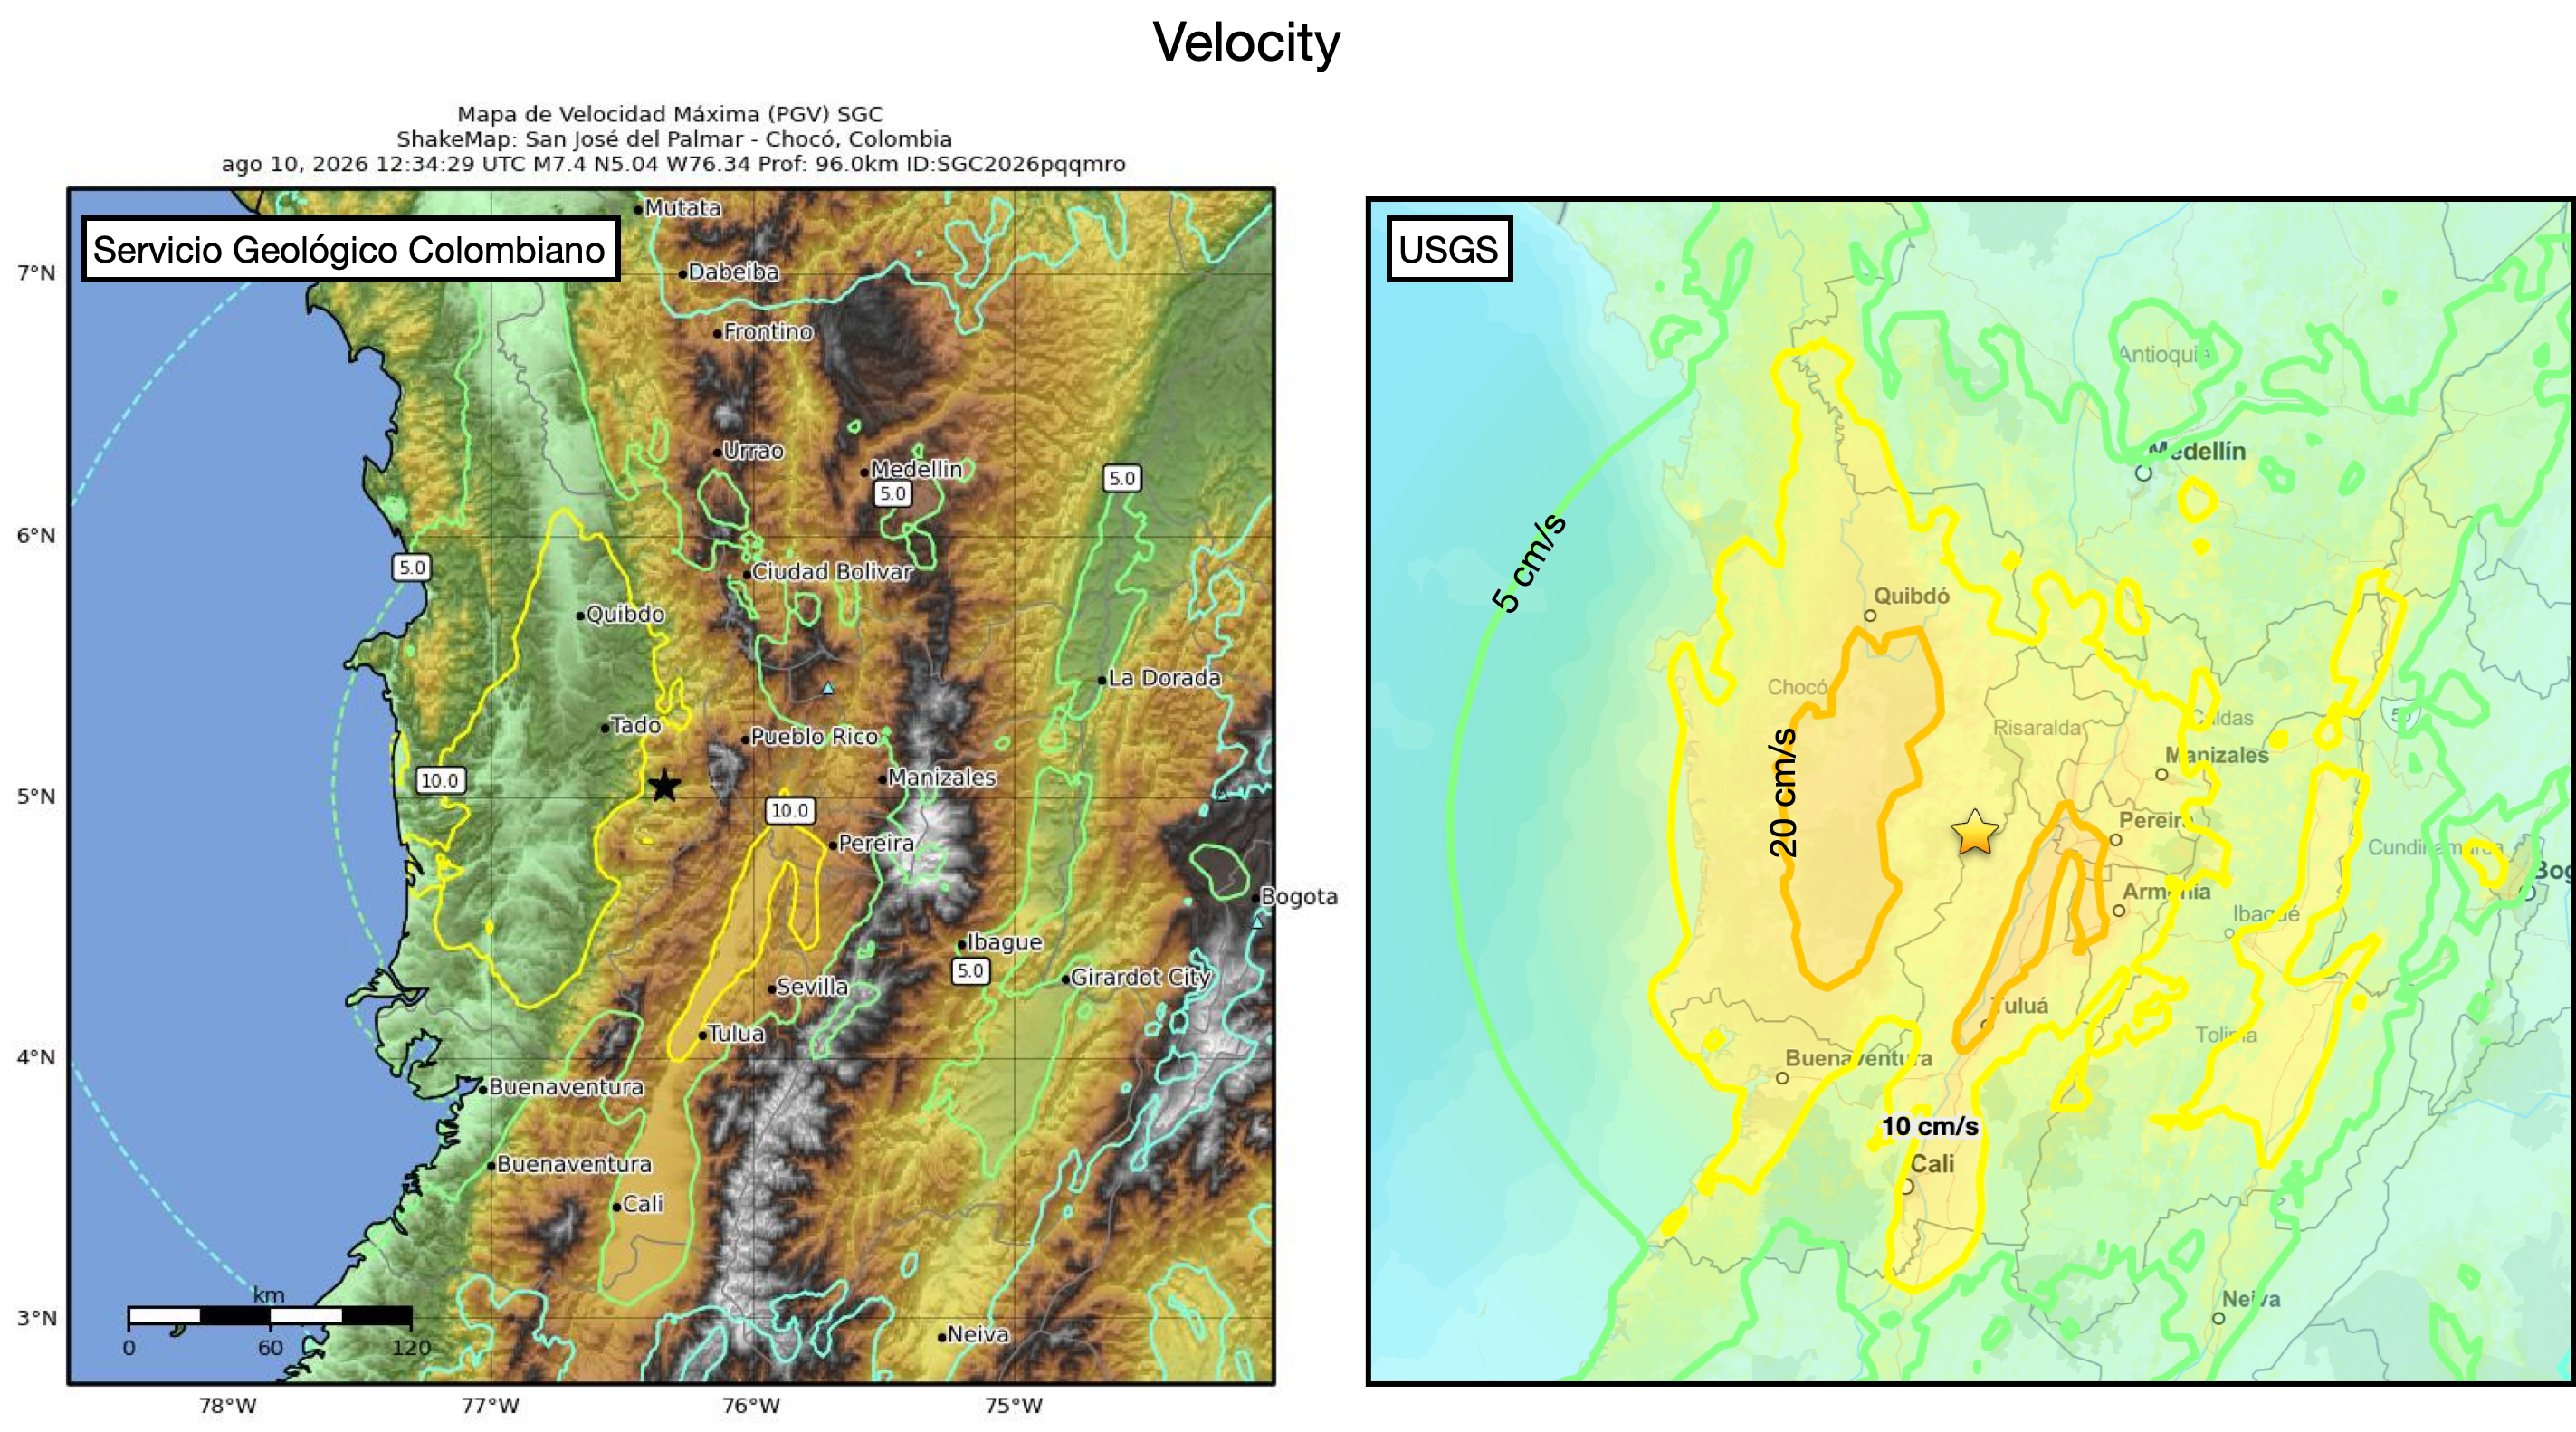
The SGC does not report any locations above 20 centimeters per second, in contrast to the USGS, which does show regions exceeding that peak velocity on both sides of the epicenter. Thus, the early PAGER estimates are likely baking in stronger and more widespread shaking than actually happened. The PAGER results will certainly be updated as more data come in.
It is important to recognize what ground acceleration and velocity maps say, and what they do not say. Peak velocities and acceleration do not include the duration of shaking, which is an important factor: buildings that can sustain a certain level of shaking for five seconds may fail at ten, twenty, or thirty seconds. In this case, reports indicate that the shaking seems to have been quite long duration. This is typical of deeper earthquakes, because different seismic waves spread out as they travel at different speeds or along different paths.
The maps above also do not represent the vulnerability of the buildings, or whether people are actually in those buildings, based on time of day or day of the week. All of those parameters are important for determining impact, but they are very difficult to model. What we can say is that even though the USGS seems to be overestimating accelerations and velocities, their PAGER estimate of deaths appears sadly accurate.
In addition to ground shaking, the USGS highlights an additional hazard: liquefaction.
When strong shaking occurs, the pore spaces between the sediment grains beneath the ground surface can collapse, causing the internal pore water pressure to increase suddenly. If this water cannot escape quickly enough, extreme overpressure causes the sediment to lose its strength and begin to flow like a liquid. The loss of support beneath causes the stronger, drier sediments on top to break apart, carrying any shallowly founded buildings along for the ride.
As shown on the map above, the areas of high liquefaction potential overlap with the flatter areas away from the epicenter. That is because the sediments that can amplify shaking are also the materials that are capable of liquefaction, a process that can only occur in loose sediments that are saturated with water.
Scientists are undoubtedly working with the existing seismic data to unravel exactly what happened in this earthquake and generate refined maps of shaking.
Over the next week, we also expect to see satellite imaging of the area. For shallow earthquakes, radar mapping of ground movement (InSAR) can provide critical information about earthquake ruptures and fault movement. Given the depth of this earthquake, we expect to see less useful information from this technique, although it might highlight areas that experienced liquefaction.
The impacts of this earthquake are still being evaluated. It is typical for reports of damage and deaths to grow over the hours, days, and weeks following an earthquake. The first several days are critical for rescue efforts; after that, the focus turns to recovery — a much longer process.
In the meantime, people in the area can expect to feel aftershocks. So far, the SGC is reporting eighteen aftershocks, all much smaller than the mainshock (M1.4-4.8). Larger aftershocks are possible, but in general aftershocks should occur around the same location as the mainshock, so their impacts should be mitigated by the depth. As with all damaging earthquakes, it is important to know that buildings that have been weakened by one earthquake can collapse when exposed to lesser shaking in an aftershock.
In general, aftershocks decrease in frequency as 1/time. In other words, we expect that on day 10, we will see about 10% as many aftershocks as on day 1. There is no strict dividing line defining when aftershocks will end, but they eventually become so infrequent that they are indistinguishable from background seismicity.
Bradley, K. and Hubbard, J. (2026), Deadly M5.5 earthquake strikes central Peru. Earthquake Insights, https://earthquake insights.substack.com/p/deadly-m55-earthquake-strikes-central
Hubbard, J. and Bradley, K. (2026), Catastrophic M7.5 earthquake strikes northern Venezuela. Earthquake Insights, https://earthquakeinsights.substack.com/p/catastrophic-m75-earthquake-strikes
Comments
Nothing yet. Say the first thing.
Sign in to join the conversation.