
Premium Member Research | Dr. Alex Koh | 8 August 2026 BUYTRIGGER.CLUB — Don’t guess. Measure.
Before we start: this is my read and my process, not financial advice. $PLTR is a high-risk, high-multiple software business — it can fall hard and you can lose money. My BuyTrigger and ValueTrigger levels are inputs to my thinking, not price targets and not a signal to act. Full transparency, because it shapes my lens: I don’t own $PLTR. Not personally, not through family, not through any account I control. No broker, sponsor or company relationship with Palantir. Just the data and how I see it.
Let me start where I always start when I’ve been wrong. On the record.
I made fun of Palantir. A couple of billion a year in revenue and a market cap that made no sense to me, and I said so, out loud, more than once. Then it ran away from me and I stopped laughing.
So I did what an engineer does when the model keeps breaking. I built a bucket for it. I call it the Parallel Universe — stocks where the price has stopped answering to the fundamentals. Tesla lived there for years. Palantir moved in and put its feet up on the furniture.
It’s a filing system, not an insult. My valuation work stopped explaining what the share price was doing, so I stopped pretending it did.
Here’s the thing people misread about that bucket. Parallel Universe is a statement about the price. It was never a statement about the business.
And this quarter, the business tried to climb out and meet the price.
That’s the whole article. Let’s go through it properly, because the details are where it gets interesting — and where it gets uncomfortable.
Start with the one number that should not exist.
Revenue $1.935 billion, up 93% year on year.
Now look at what came before it. Two years ago Palantir was growing 27%. Then 30, 36, 39, 48, 63, 70, 85, and now 93.
That’s not growth. That’s acceleration. Eight consecutive quarters of it.
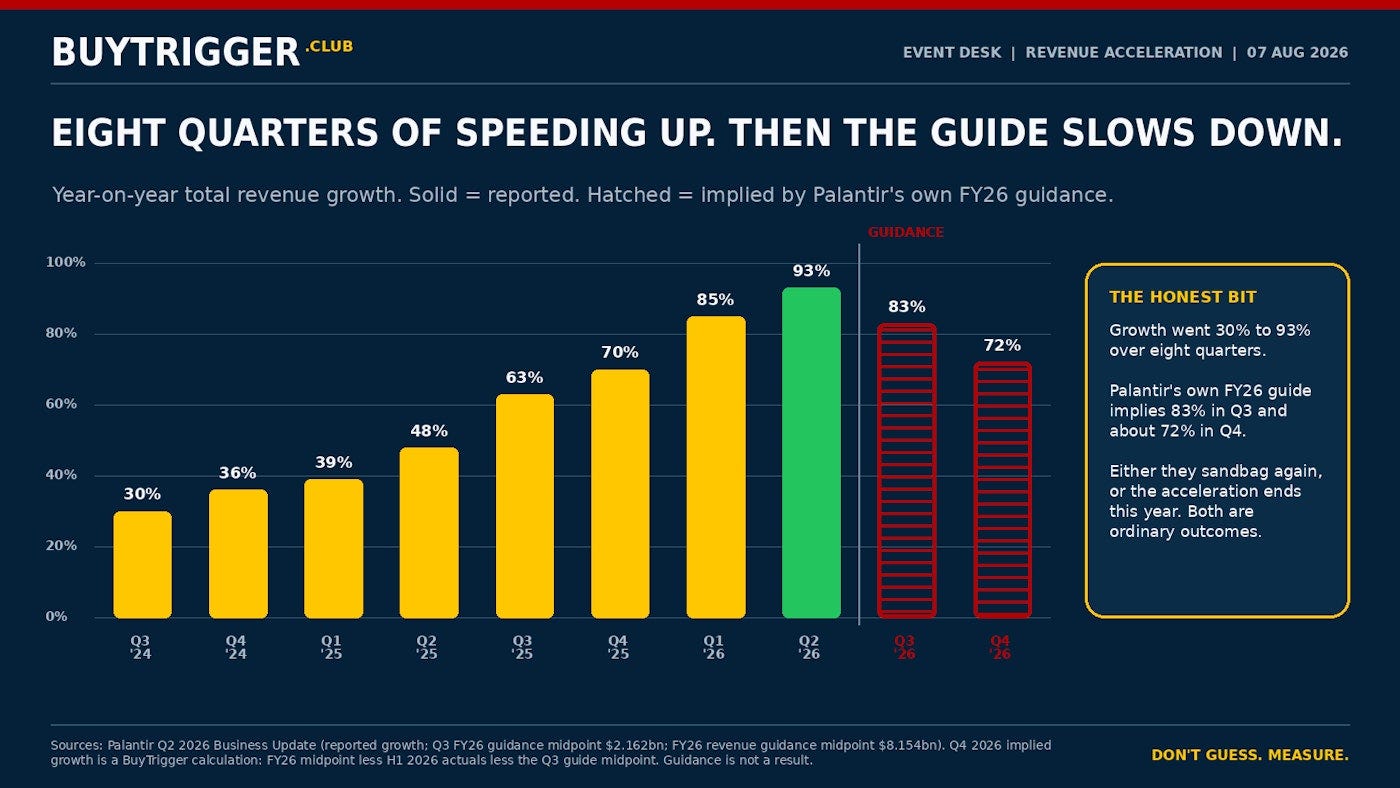
Reported growth against the growth implied by Palantir’s own FY26 guide.
A company annualising $7.7 billion is supposed to slow down. The denominator gets bigger every quarter — it’s harder to add the next dollar than it was to add the last one. That’s not opinion, that’s arithmetic. Palantir’s been beating it for two years.
Before I opened the deck, I expected the deceleration finally to show up. Instead I got 93%.
My reaction on the live session was blunt: Palantir had delivered another set of numbers that were “very difficult to dismiss.” I once mocked a business doing roughly $1.9 billion in a year. It has just done $1.935 billion in a quarter. That is not a change I can wave away because the valuation still makes me uncomfortable.
Look at the right-hand side of that chart though. I’ll come back to it. It’s the bit that keeps me honest.
Here’s the quarter in the numbers that matter.
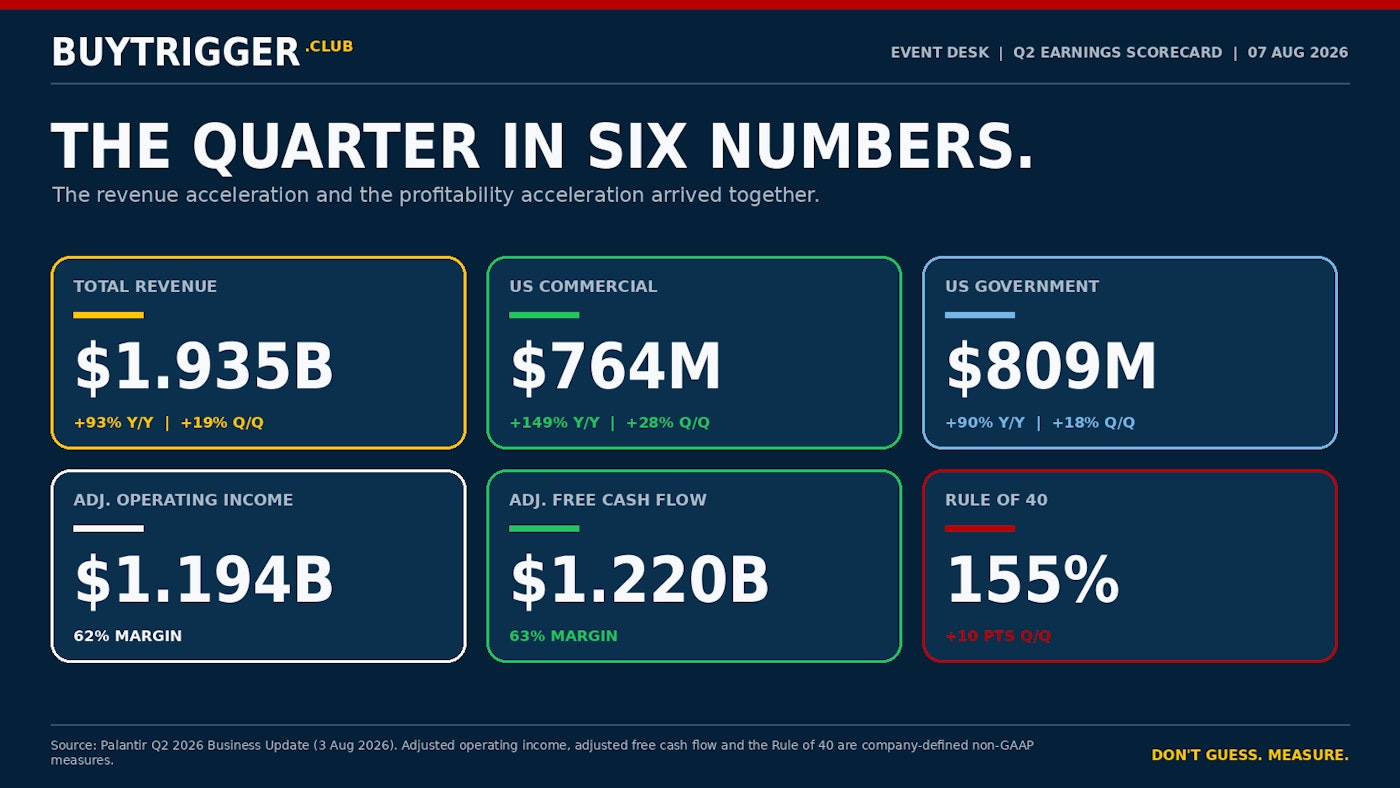
Source: Palantir Q2 2026 Business Update. Adjusted measures are company-defined and non-GAAP.
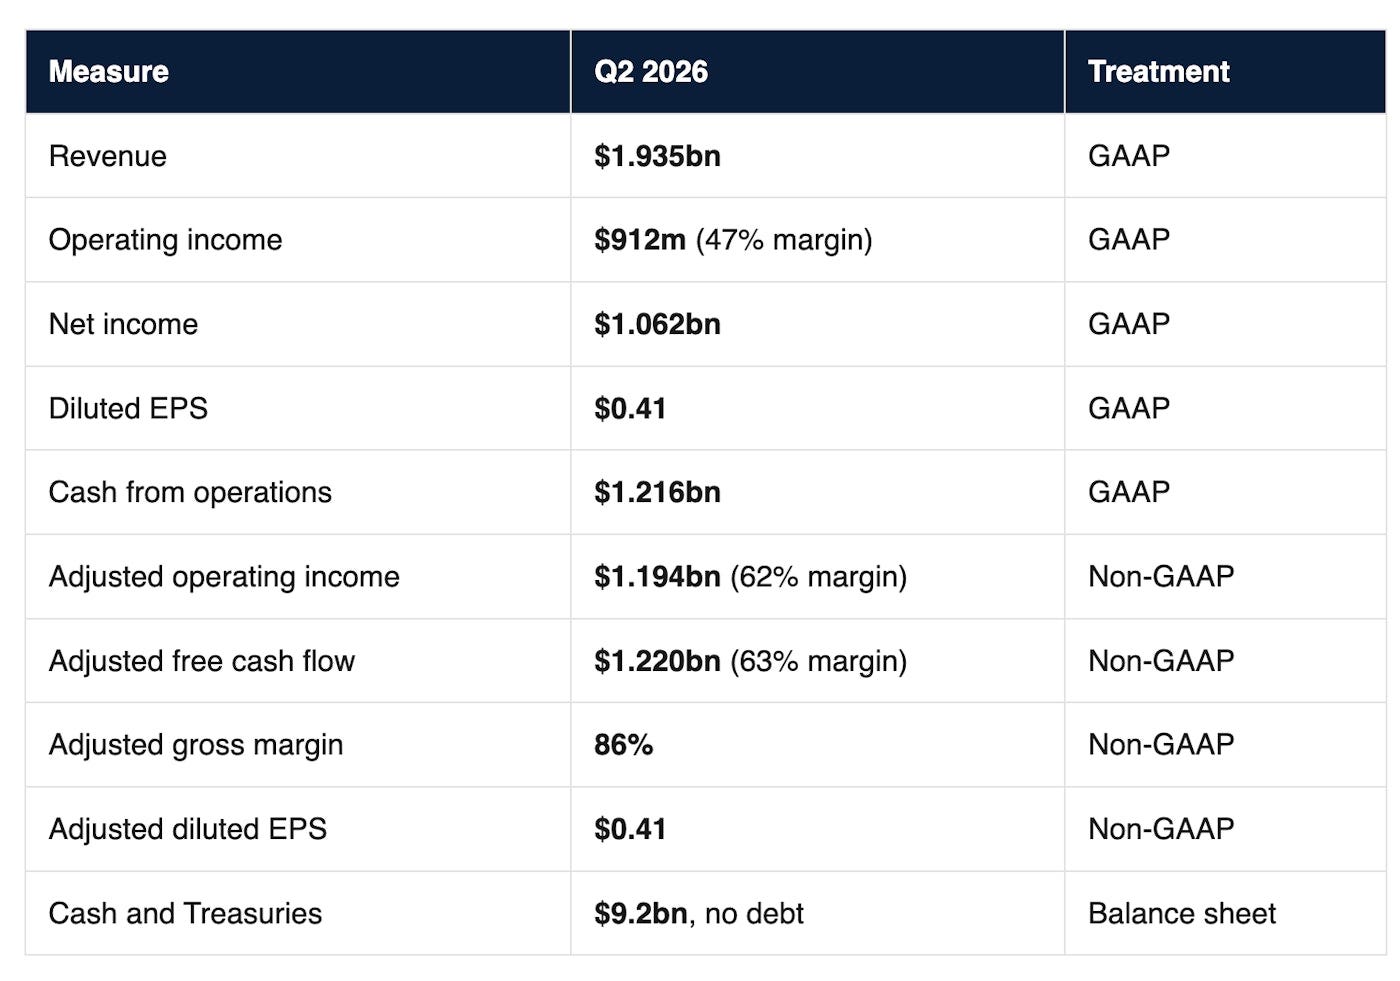
Pause on the GAAP lines, because this is where Palantir stopped being a 2021-style story stock and I don’t think enough people have updated.
$912 million of GAAP operating income. A 47% GAAP operating margin. $1.06 billion of GAAP net income. Not adjusted. Not “if you ignore the share compensation.” Reported, bottom-of-the-page profit — and it’s grown every single quarter for five straight quarters: $269m, $393m, $575m, $754m, $912m. (Interim numbers, so unaudited. Reported, though, not massaged.)
Then look at the two EPS lines. GAAP diluted EPS $0.41. Adjusted diluted EPS $0.41. Two identical numbers — go and check how many high-growth software names can show you that.
And $9.2 billion of cash and Treasuries against no debt. In a sector where half the AI story is running on borrowed money and circular vendor financing, Palantir is funding itself out of the till.
That’s the part I’d have told you was impossible when I was making jokes.
Now the bit that changes my read on the quality of this business.
Almost every company faces the same trade. You buy growth with margin — you spend on sales and it costs you profitability. Or you buy margin by giving up growth — you stop spending and the top line slows. Give and take. That’s normal. That’s the job.
Palantir has essentially refused the trade for two years.
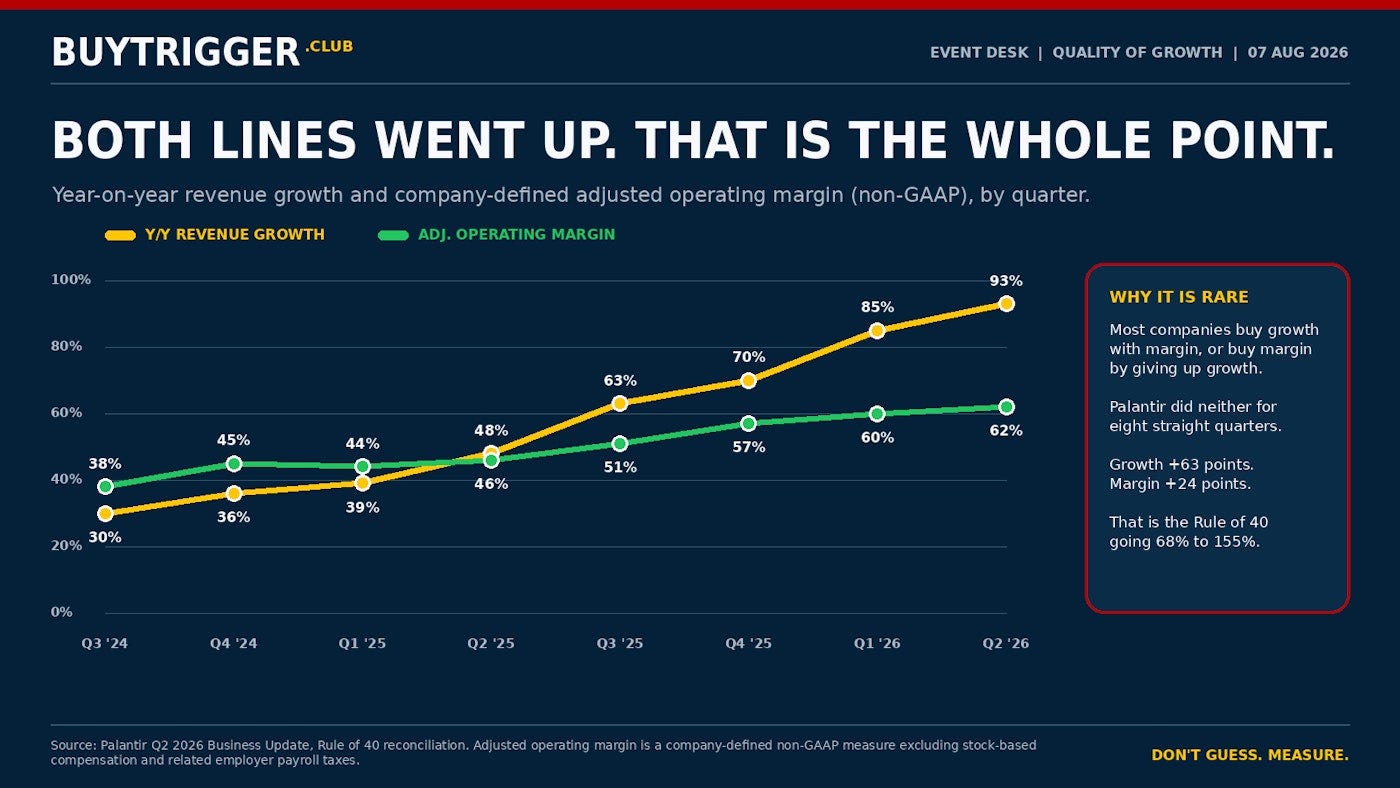
Revenue growth and company-defined adjusted operating margin, by quarter. Read the margin with Palantir’s non-GAAP reconciliation.
Growth up 63 points. Margin up 24 points. And growth rose every single quarter — margin rose in seven of the eight. It slipped one point in Q1 2025, 45 down to 44. That’s the only step backwards on either line in two years.
One point. That’s the whole indictment.
That’s what a Rule of 40 score of 155% actually describes. 93% growth plus 62% adjusted operating margin. It’s why the R40 went 68 → 81 → 83 → 94 → 114 → 127 → 145 → 155.
I built my whole database around Rule of 40 because it catches exactly this. It won’t let a company impress you with one number while quietly bleeding on the other. Palantir isn’t gaming it. Both inputs are moving.
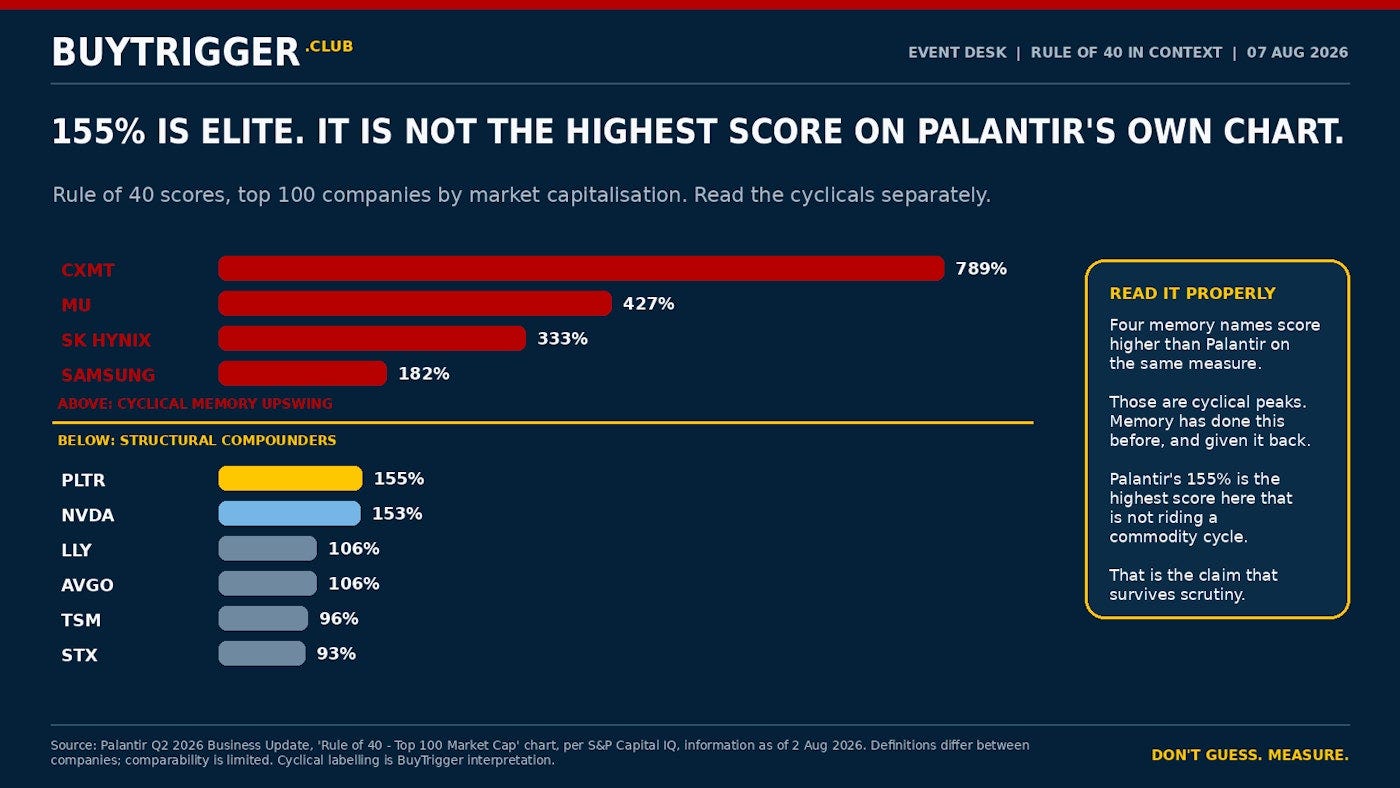
Source: Palantir’s own Q2 2026 deck, per S&P Capital IQ as of 2 August 2026. The cyclical/structural split is my labelling, not theirs.
You’ll see it written that Palantir has the best Rule of 40 score in the world.
Bin that. It’s not what their own chart says.
Go and look at the slide Palantir published. Four labelled names score higher: CXMT at 789%, Micron at 427%, SK hynix at 333%, Samsung at 182%. All four are memory. All four are sitting on top of a commodity cycle that has done this before and given it all back before. Ask anyone who owned memory in 2018, or in 2022.
Here’s the version that survives an argument at work: 155% is the highest Rule of 40 score among the labelled names in the global top 100 that isn’t riding a commodity cycle. Just ahead of Nvidia at 153%. That claim holds. The other one falls over the moment someone opens the deck.
Two more caveats, both buried in Palantir’s own footnotes where nobody reads them. The peer scores adjust operating margin for stock compensation only — Palantir’s own score adjusts for stock compensation and the employer payroll taxes on it. Small thing, but it’s a slightly kinder basis for the home team. And the chart labels roughly half the top hundred, so “four names score higher” strictly means four labelled names.
Read the deck. Not the headline about the deck.
Here’s the one nobody puts on the thumbnail, and I think it’s the most important structural fact in the release.
US revenue: $733m → $1.570bn. Up 115%. Everywhere else: roughly $0.27bn → $0.37bn. Up somewhere in the mid-30s percent.
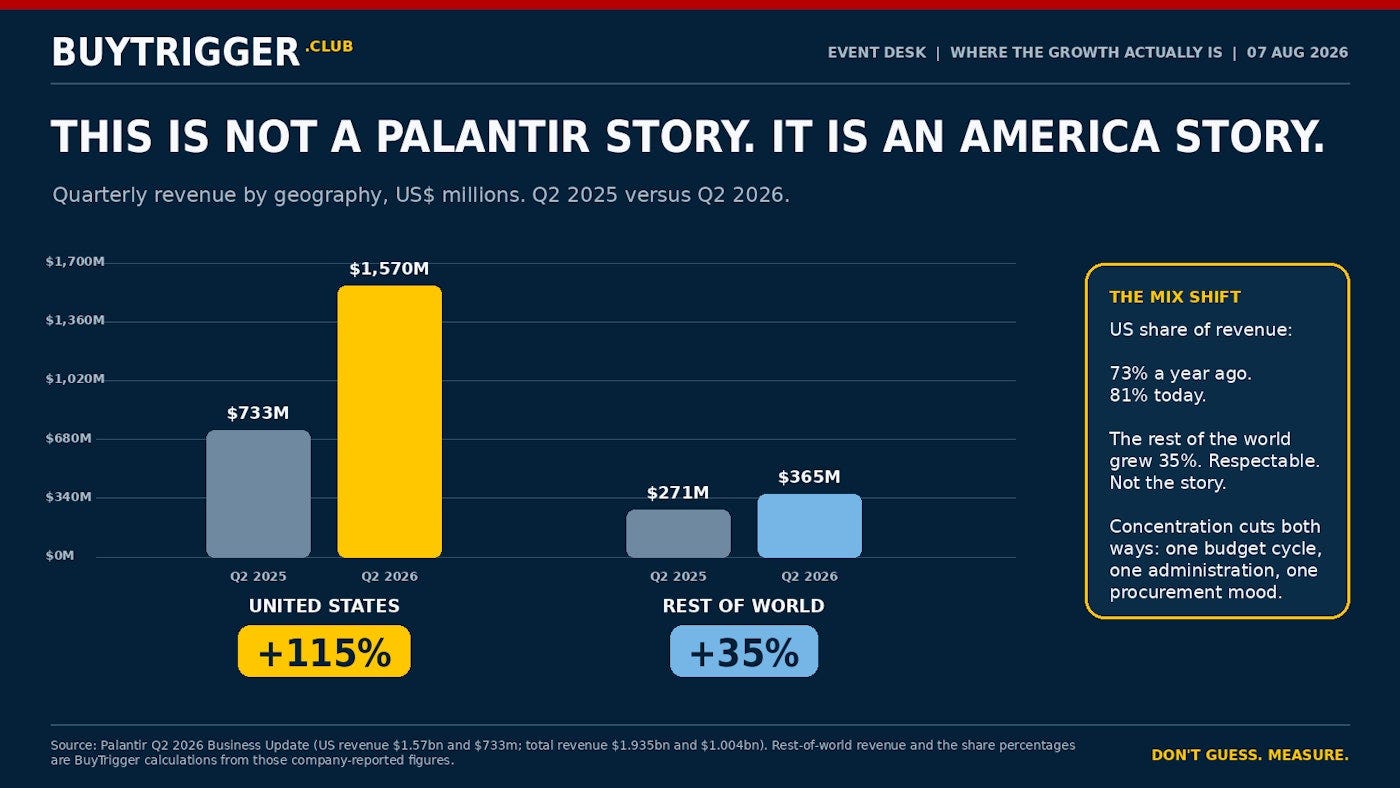
US figures are company-reported. Rest-of-world is my subtraction from total revenue, so it inherits Palantir’s rounding — call it approximate.
A year ago America was 73% of this company. Today it’s 81%. Of the roughly $932m Palantir added to quarterly revenue year on year, about 90% came from the United States.
Mid-thirties growth outside the US is respectable — most software companies would take it and go home happy. It just isn’t the story.
Two sides to that. US government revenue grew 90% to $809m and US commercial grew 149% to $764m — this isn’t a defence contractor with a software hobby any more. US commercial is closing on government fast, still 6% behind it but growing at nearly twice the rate, and AIP is doing real work in real companies: Kirkland & Ellis, SAP, Centrus, McCarthy all walk through the Q2 deck. That’s diversification of the revenue base happening in real time.
But geography is geography. One budget cycle, one procurement mood, and you own an American policy exposure whether you wanted one or not.
I’m not ringing an alarm. I’m telling you what you’re actually holding.
Let me translate the forward book into normal English.
Revenue tells us what Palantir delivered last quarter. The forward book tells us how much future work customers have already signed for.
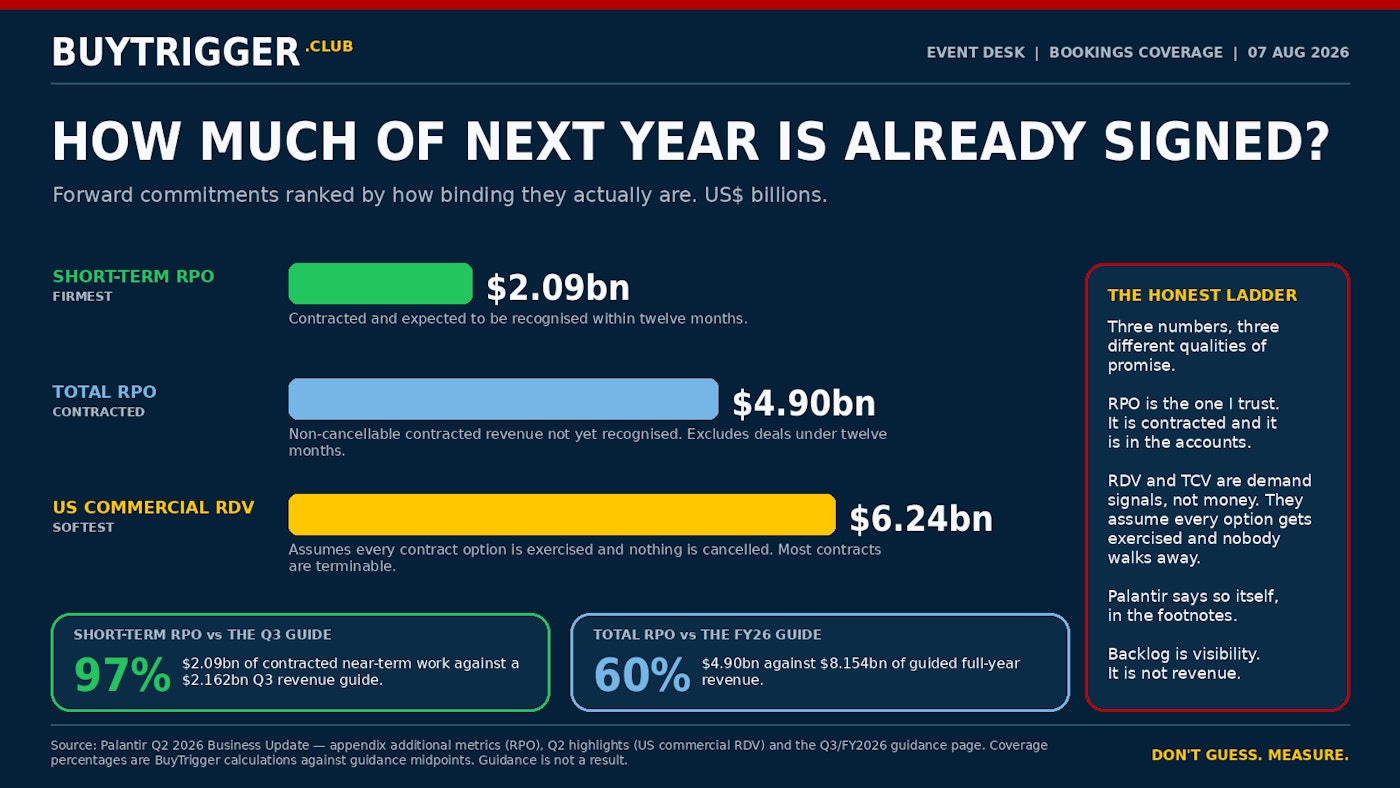
Forward commitments and coverage against guidance. Coverage percentages are my calculations.
Short-term RPO, $2.09 billion. Contracted, and expected to land within twelve months. This is the firm one.
That one number covers about 97% of Palantir’s $2.162 billion Q3 revenue guide. In other words, most of the next quarter is already supported by signed work.
Total contracted revenue waiting to be recognised has doubled in a year to $4.90 billion. Existing customers are also spending 57% more than they did a year ago, while the customer count grew 24%.
The simple takeaway: this does not look like one lucky quarter. Customers are signing more work and expanding what they already use.
The caution is equally simple. Palantir also quotes $6.24 billion of US commercial RDV, but that softer figure assumes contract options are exercised and customers do not cancel. I do not treat it like cash in the bank. And because much of the growth is coming from existing customers spending more, a large customer changing course would matter.
This is the family-investor check: is Palantir keeping the money, or is the headline profit disappearing through stock awards and accounting adjustments?
So: stock-based compensation was $265 million this quarter, up 66% from $160 million a year ago.
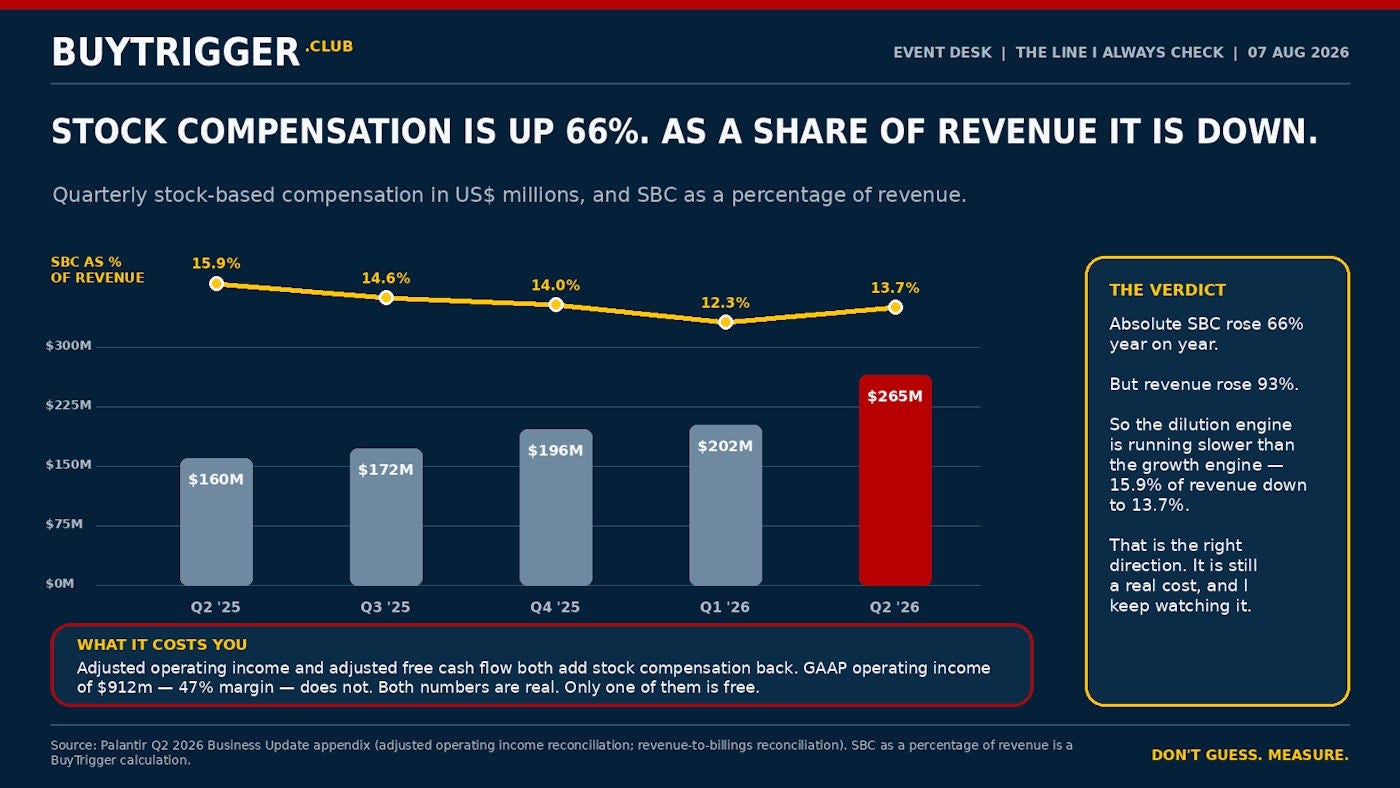
SBC in dollars and as a share of revenue. The percentage is my calculation.
Stock compensation rose 66%, which sounds ugly until you put it beside revenue growth of 93%. As a share of revenue, it actually fell from 15.9% to 13.7%, and the diluted share count edged down from Q1.
The cleanest check is cash. Strict accounting cash from operations was $1.216 billion. Palantir’s friendlier adjusted free-cash-flow number was $1.220 billion. The difference was only $4 million.
Stock compensation remains a real cost, so I will keep watching it. But the cash is not an illusion. Palantir is producing it now.
One good quarter can be luck. Raising the whole year says management believes the improvement will continue.
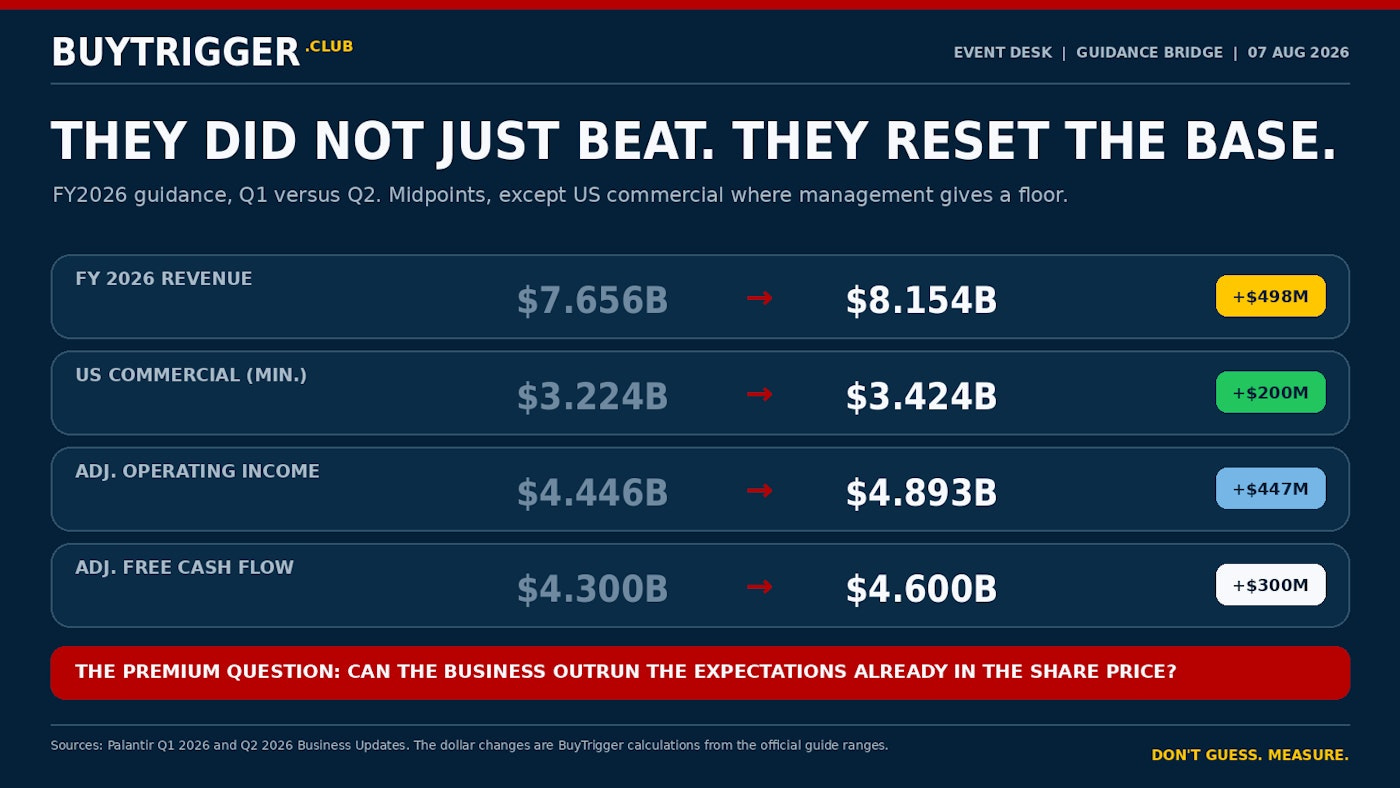
Q1 2026 guide versus Q2 2026 guide. Midpoints throughout, except US commercial where management gives a floor.
Palantir added roughly $498 million to its full-year revenue expectation, $447 million to adjusted operating income and $300 million to adjusted free cash flow. Its minimum US commercial-growth expectation moved from 120% to 134%.
That is not a small upgrade. It is management resetting the year after seeing the Q2 evidence.
Palantir’s own guidance suggests growth may slow from 93% now to about 83% in Q3 and roughly 72% in Q4.
That could be management leaving room to beat again. It beat its previous Q2 guide by about 7.6%. Or it could mean the maths is finally catching up: as Palantir gets larger, maintaining the same growth rate becomes harder.
Either way, this is the promise underneath the share price. The market is not paying for an ordinary software company. It is paying for several more years of exceptional growth with exceptional margins. The next few quarters must keep proving that promise.
At the 7 August close, $PLTR was $172.01, up 10.3% on the day and up 39.8% in five trading sessions from the 31 July close of $123.06. Market capitalisation was about $413 billion.
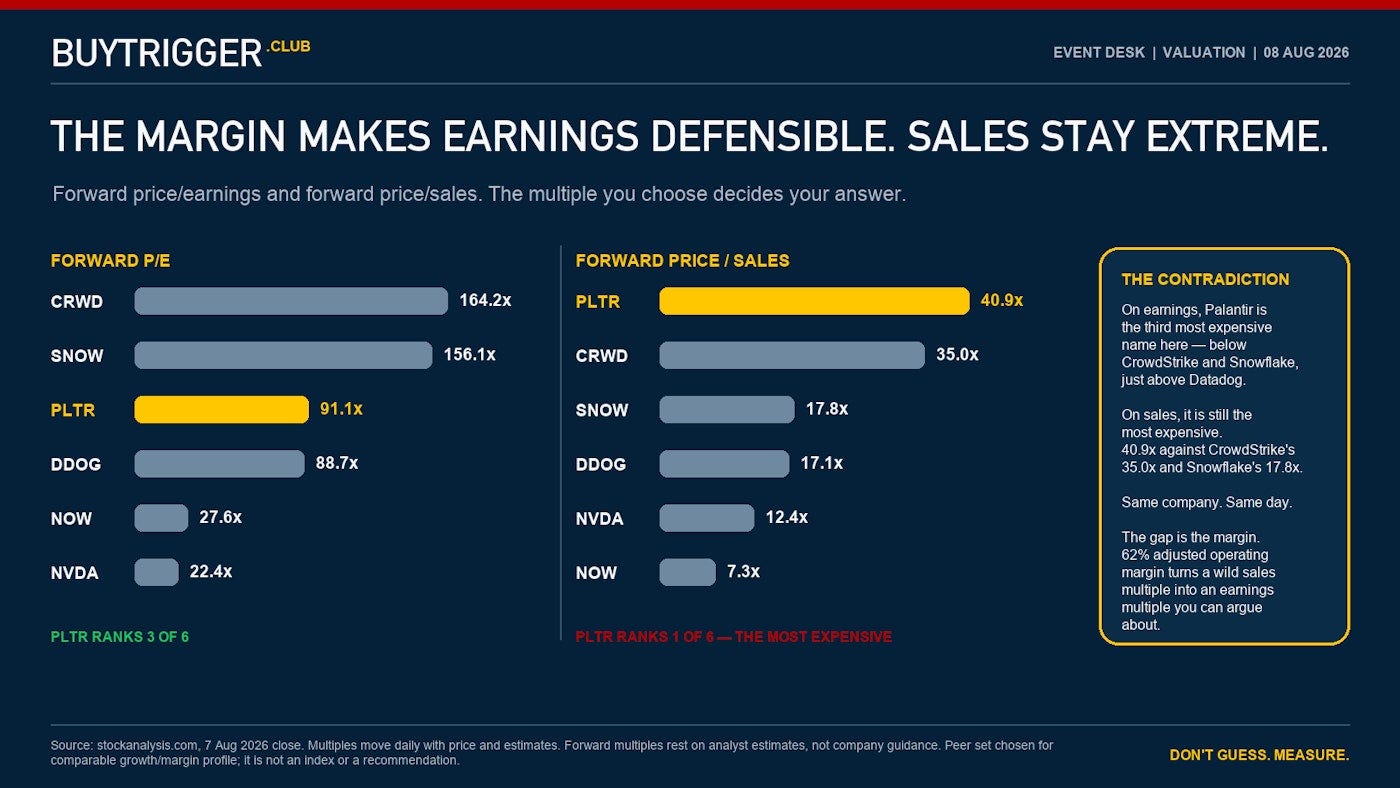
Forward multiples per stockanalysis.com, 7 August 2026. They move daily with price and estimates.
The share price assumes that today’s growth and margins will continue. At about 91 times forecast earnings and 41 times forecast sales, this is not a price for an average company.
The 62% adjusted operating margin is what keeps the argument alive. Palantir is extremely expensive against sales, but it turns an unusually large share of those sales into profit. That is why the earnings valuation looks less extreme than the sales valuation.
For a family investor, the conclusion is straightforward: the business has earned more confidence, but the share price still leaves little room for an ordinary quarter.
Above is the business in plain English. Below: why the standard BuyTrigger has improved from $75 to $90, why the separate Parallel Universe lens looks two years ahead, and what must happen for the bullish case to survive.
Comments
Nothing yet. Say the first thing.
Sign in to join the conversation.