
Turn on financial television this weekend and you’ll see the stories everyone is talking about.
Iran.
Oil.
The jobs report.
Another busy week of earnings.
Those stories matter. They can certainly move markets in the short term.
But if the headlines surrounding Iran are starting to feel a little like Groundhog Day, you’re probably not alone.
Ceasefire.
New tensions.
Oil spikes.
Oil drops.
Another round of speculation.
Each development is significant, and the human cost should never be minimized. Yet the market seems increasingly willing to absorb the news and return its attention to the questions that ultimately drive stock prices: corporate earnings, economic data, interest rates, and where institutional money is flowing next.
That’s where we try to look Beyond the Noise.
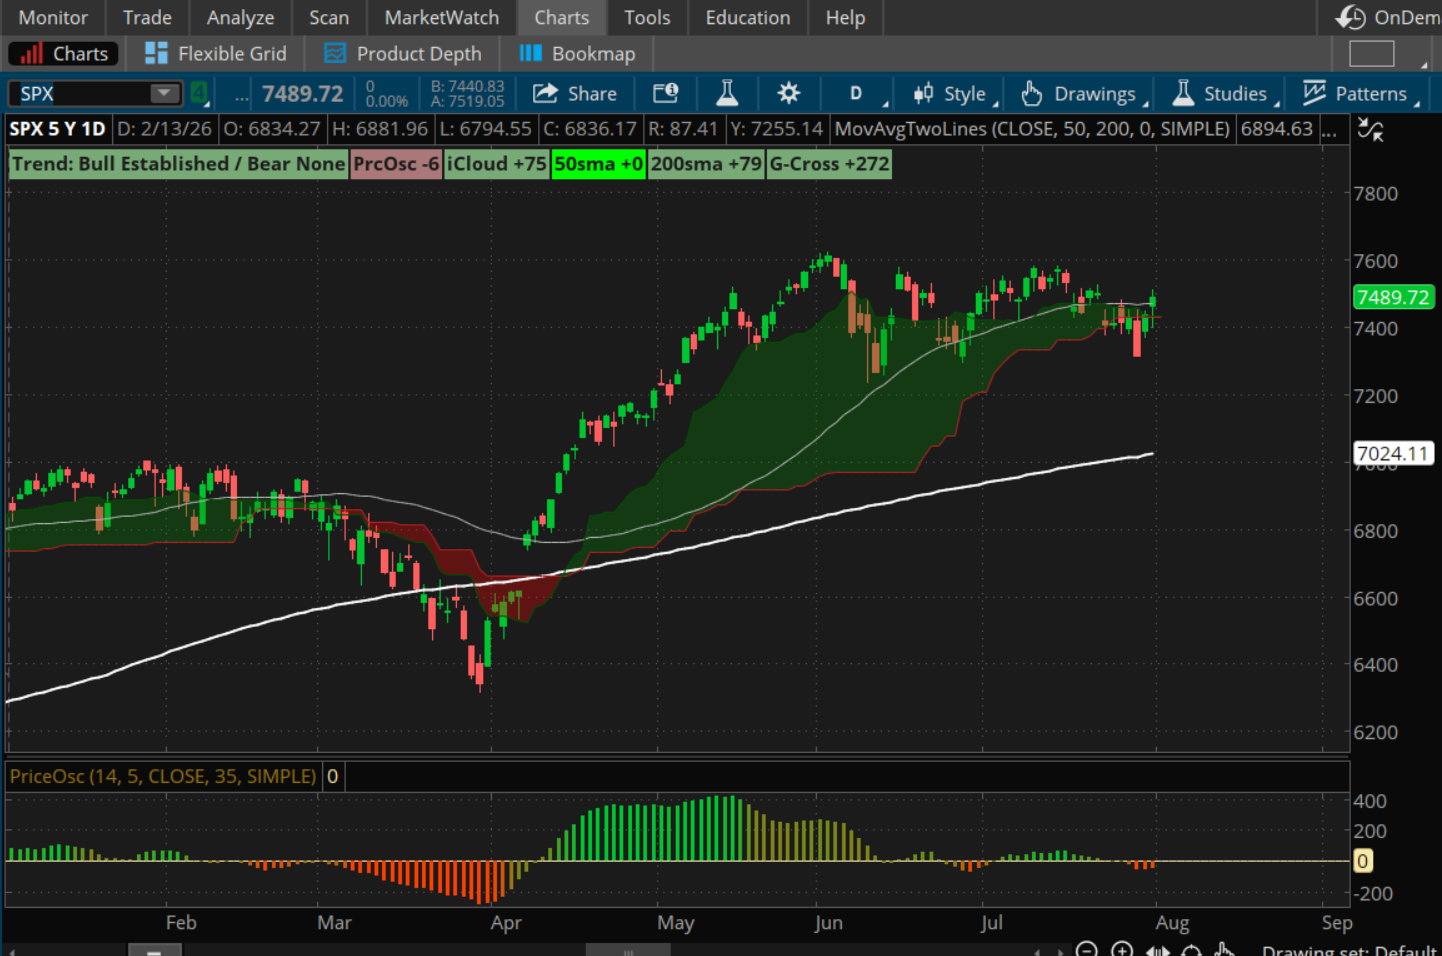
Last week, the S&P 500 briefly looked vulnerable. The index slipped below its 50-day moving average, raising the possibility that the recent consolidation might become something more serious.
Instead, buyers stepped back in.
By Friday’s close, the index had reclaimed the 50-day moving average, keeping the longer-term uptrend intact. Price action once again reminded us that markets often reveal more through their behavior than through the headlines dominating the news cycle.
The chart doesn’t tell us what tomorrow’s headlines will be.
It tells us how investors are voting today.
Markets often climb a wall of worry, and despite another week of geopolitical headlines, the S&P 500 regained its 50-day moving average and preserved its primary uptrend.
That’s valuable information.
The bigger story wasn’t the index itself.
It was what was happening beneath the surface.
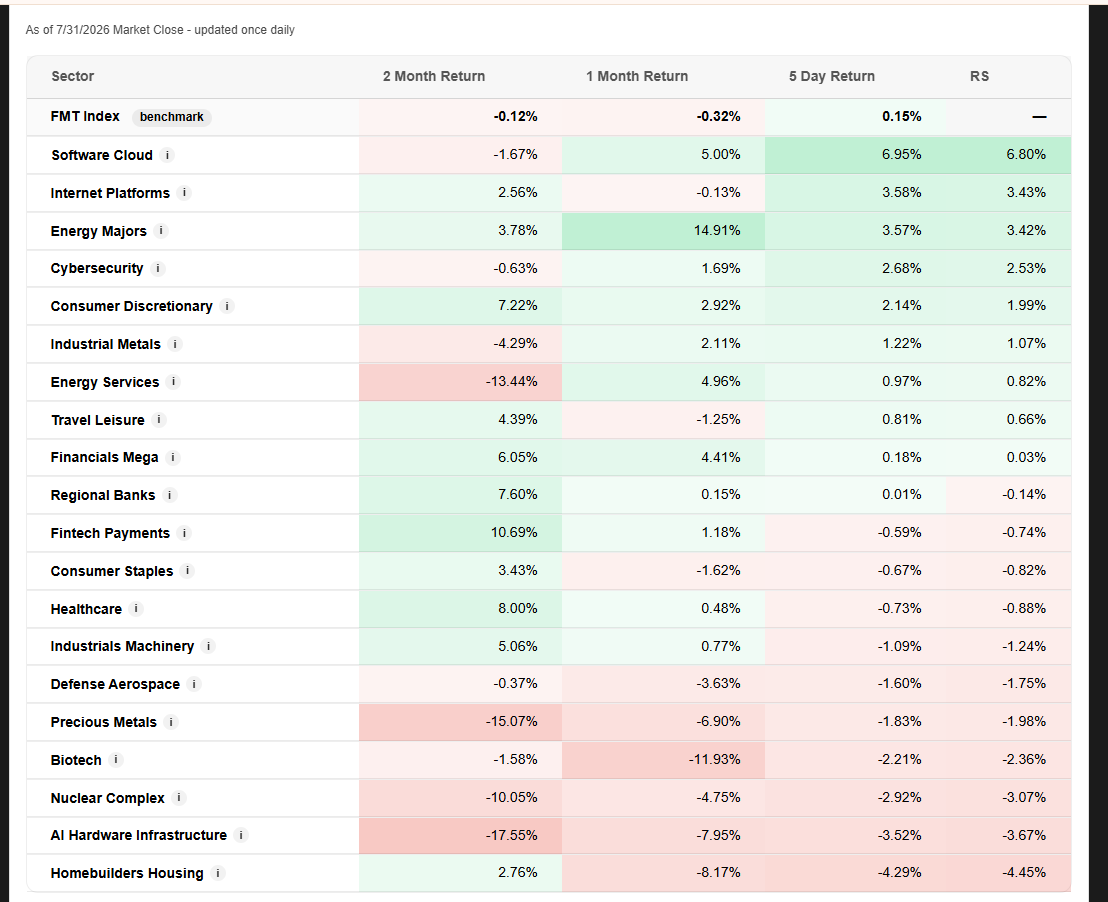
Just a week ago, Energy was leading our Relative Strength rankings. We focused our attention there and captured another profitable trade in Occidental Petroleum (OXY).
Before that, leadership was much less obvious. While many investors were still chasing the biggest AI names, our framework identified an opportunity in Etsy—a stock few people were talking about—which turned into one of our strongest trades of the summer.
This week, something different caught our attention.
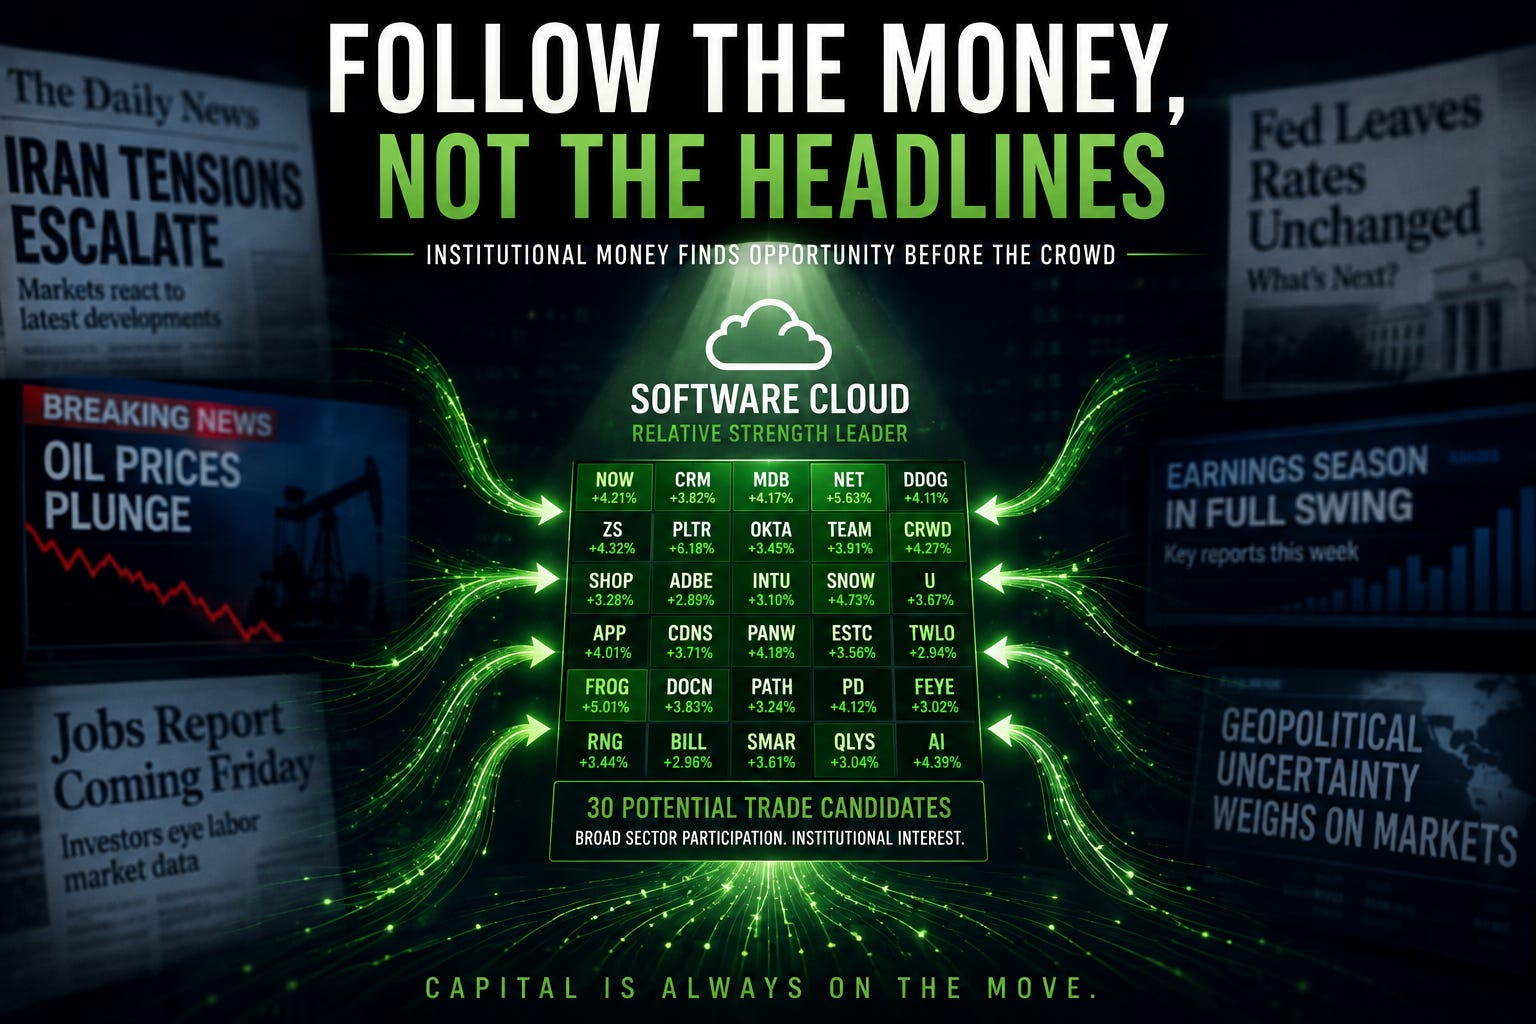
Software Cloud has quietly moved to the top of our Relative Strength rankings.
Even more interesting, our proprietary Software Cloud scan returned 30 potential trade candidates.
That doesn’t mean thirty buy signals.
It doesn’t even mean thirty stocks will continue higher.
What it does tell us is that we’re seeing broad participation across an entire sector.
One company can have a great earnings report.
An entire sector producing dozens of technically interesting charts at the same time is something very different.
That’s often what institutional accumulation looks like.
When our scans begin lighting up across an entire industry, we pay attention.
Not because we know exactly which stock will become the next winner...
...but because we know where professional money appears to be spending its time.
This week will provide plenty of opportunities for that picture to become even clearer.
Several influential companies—including Palantir, AMD, Disney, Uber, Airbnb, and Eli Lilly—will report earnings, giving investors another look at the health of several important sectors.
Then on Friday, we’ll receive the July Employment Report, one of the market’s most closely watched economic releases.
Those events will generate plenty of headlines.
Some will move markets.
Some won’t.
Our job isn’t to predict which headline will matter most.
Our job is to recognize where institutional money is actually moving after the headlines have been absorbed.
Last week, that was Energy.
Before that, it was an unexpected opportunity in Etsy.
Today, Software Cloud has our attention.
Next week, it may be something entirely different.
That’s perfectly fine.
We don’t build our investment process around predicting tomorrow’s news.
We build it around recognizing where institutional money is going today.
That’s what Relative Strength helps us measure.
That’s what our proprietary scans help us discover.
And that’s how we stay focused on what matters most—following the money, not the headlines.
If you’d like to see exactly how we identify these sector rotations before they become obvious to everyone else, I’d love to have you join us inside FMT Framework Stock & Option Picks.
You’ll receive our current portfolio, trade ideas, live market sessions, and the same Relative Strength tools and proprietary scans we use every day to follow institutional money.
Try it for just $37 for your first 30 days, backed by our 30-Day Money-Back Guarantee. After that, it’s $97 per month, and you can cancel anytime.
I hope to see you in the live sessions.
Dean
Comments
Nothing yet. Say the first thing.
Sign in to join the conversation.