
The Quarterly Workforce Indicators at the 6-digit industry level has been available since earlier this year. I used it to look at temp agencies in January. Recently I have been using it to explore seasonality of work, partially inspired by a comment by my co-author, Nick Graetz, and more directly inspired by the paper by Coglianese and Price on Income in the Off-Season. They use individual-level data from the SIPP and CPS to identify seasonal sectors in which there are recurrent annual job separations.
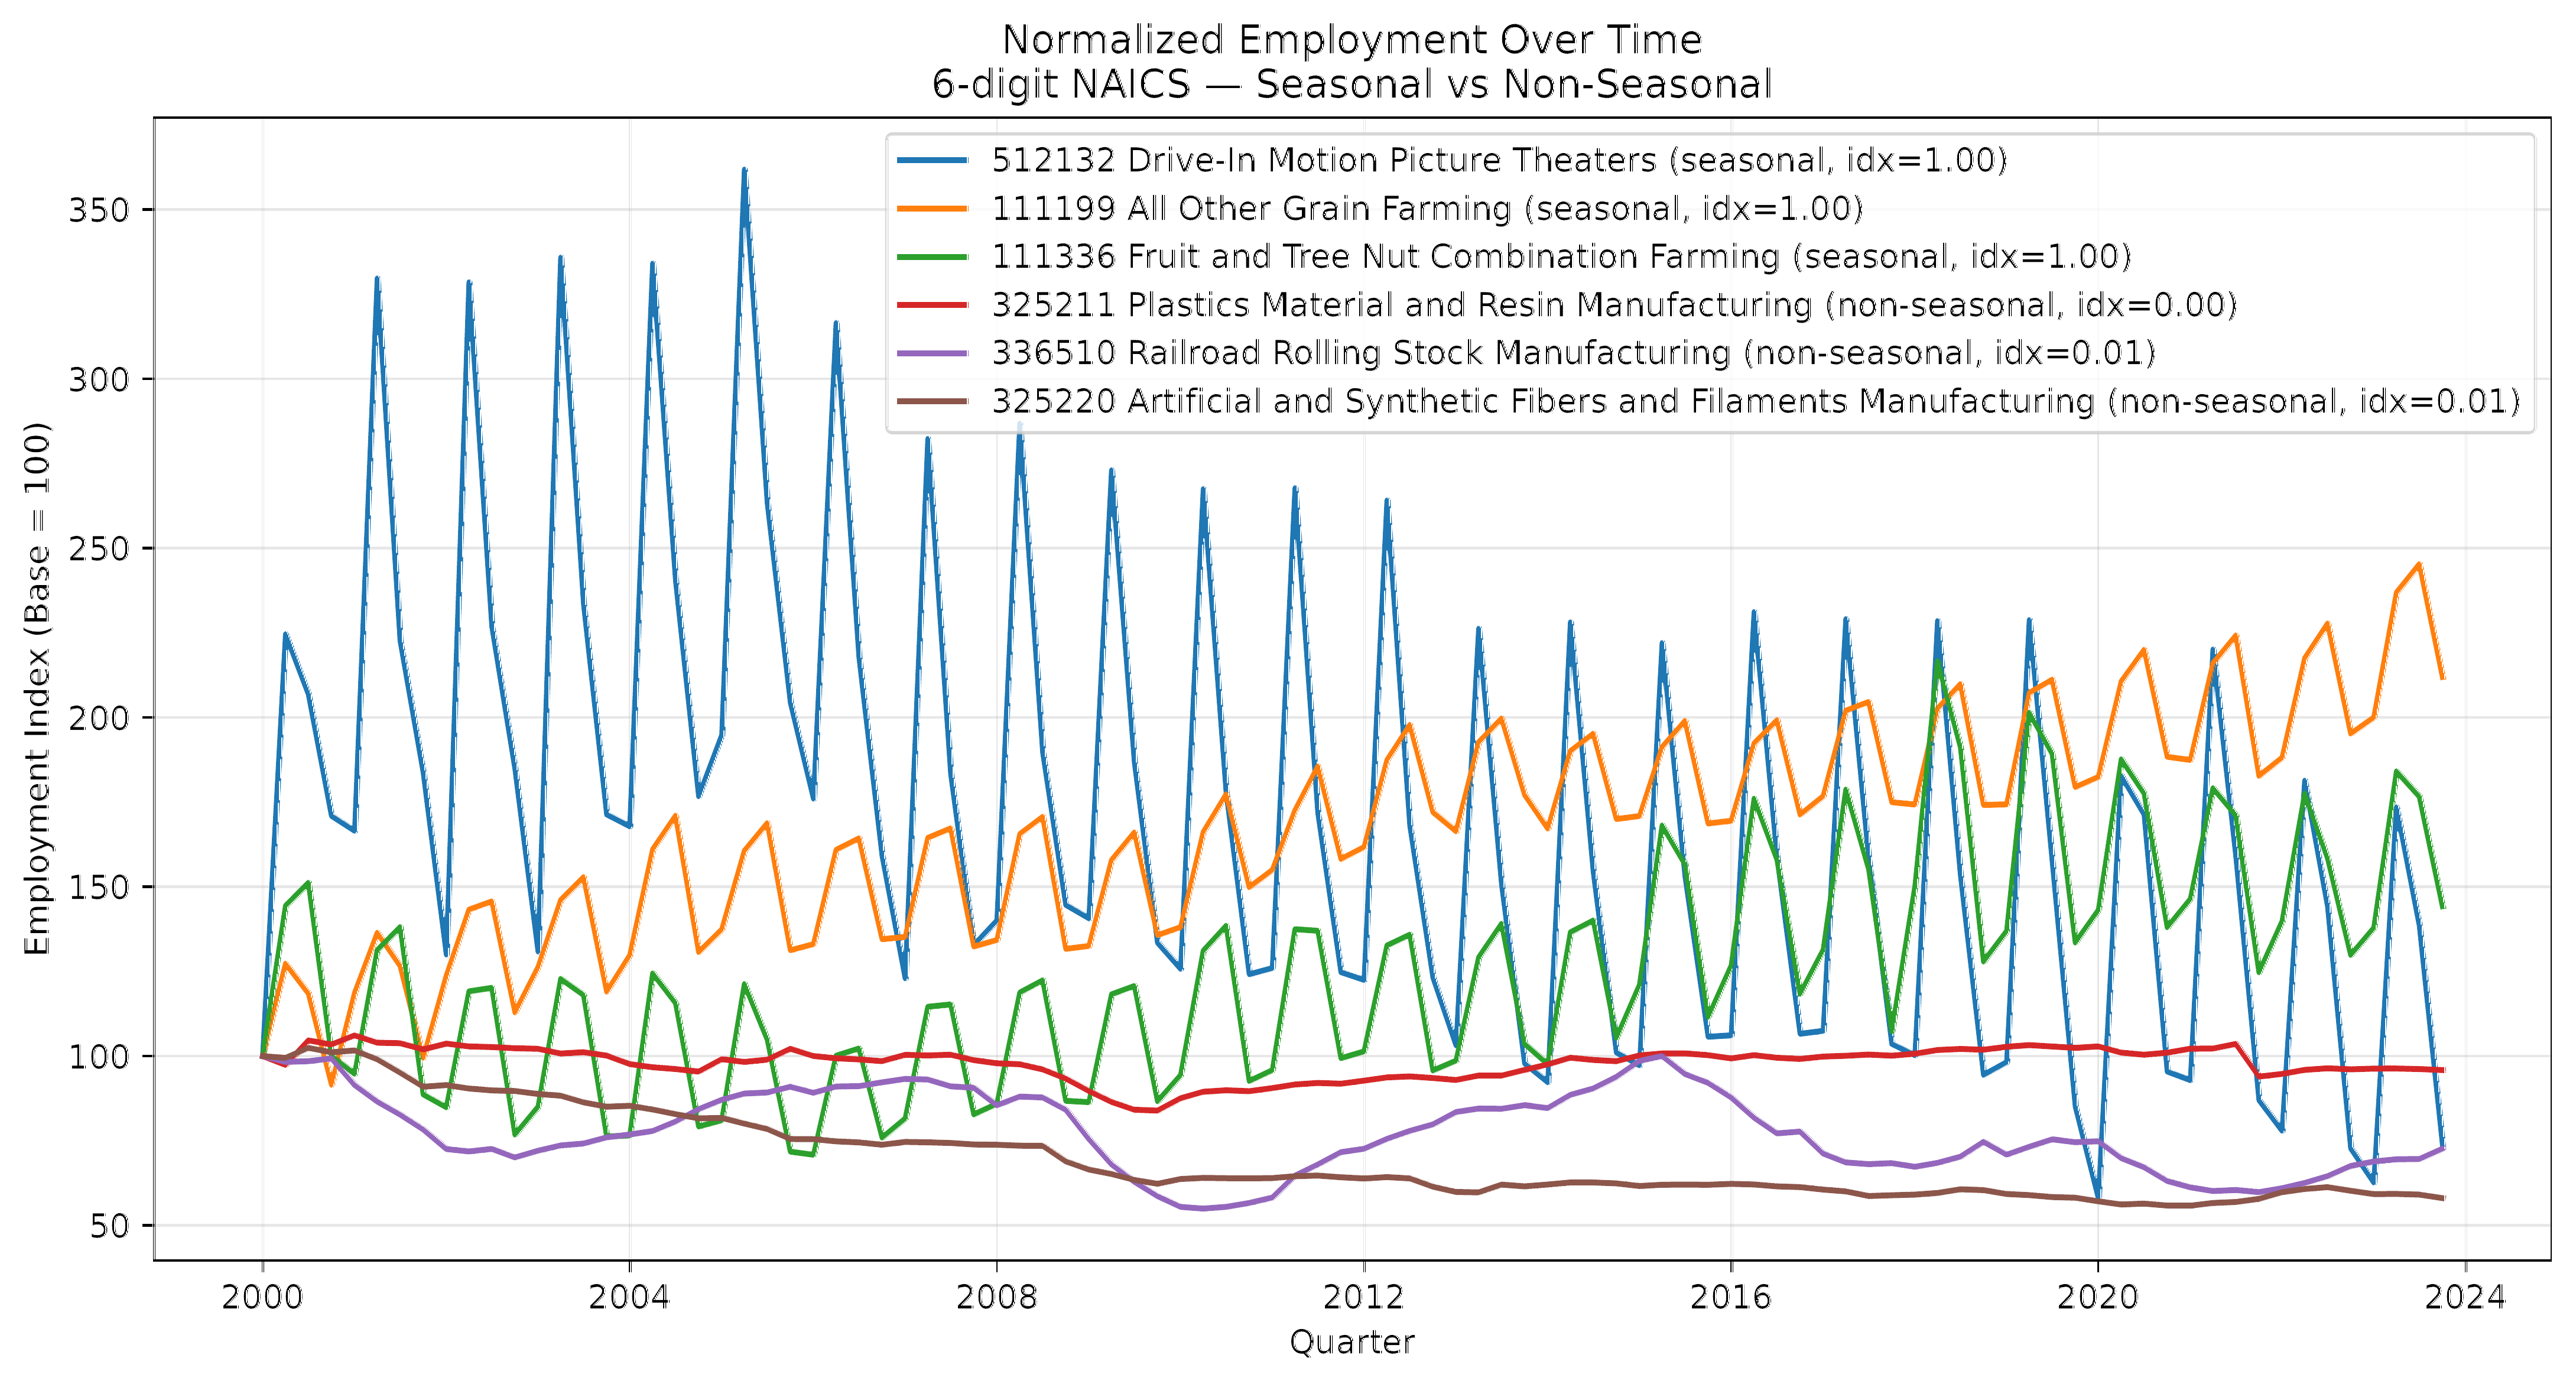
The QWI has the benefit of having much more detailed industry codes (even before 6-digit detail was available), but the drawback of being aggregate data and only having data at the quarterly frequency. I do a calculation inspired by Coglianese and Price, looking for recurrent employment declines at the same time of year, using job separations as my primary variable of interest (though using a stock measure of quarterly employment, rather than a flow would be an alternative way of measuring the concept of seasonality). I create a seasonality index based on the amplitude of the quarter of peak separation within each industry - with values closer to 1 being more seasonal and values closer to 0 being less seasonal.
Examples of seasonal and non-seasonal 6 digit industries:
Some interesting things I noticed when exploring the data by this index:
Like Coglianese and Price, the most seasonal sectors are Agriculture, Arts & Entertainment, Accommodation & Food, Education, and Construction, but there interesting individual industries both within and outside of these seasonal sectors.
Some of the most seasonal sectors (construction, education) have no individual industries that are among the most seasonal, but most industries in the sector are more seasonal than average.
Agriculture has most of the most seasonal industries, but there are some very seasonal industries in other sectors, such as Food Trucks (NAICS 722330) within Food & Accommodation, Drive in Movies (NAICS 512132) within the Information sector, and Recreational Good Rental (NAICS 532284) within the Real Estate & Rentals sector.
Although the Manufacturing sector is mostly not seasonal, there are seasonal manufactures related to agriculture, such as Beet Sugar Manufacturing (NAICS 311313) and Fruit and Vegetable Canning (NAICS 311421), as well as Ice Manufacturing (NAICS 312113) that are all very seasonal.
The agriculture that is not seasonal is interesting and mostly intuitive: Cotton Ginning (NAICS 115111), Mushroom Production (NAICS 111411), Logging (NAICS 113310), and most agriculture involving animals (Chicken Eggs, Chicken farming, Hog farming, Beef farming, etc).
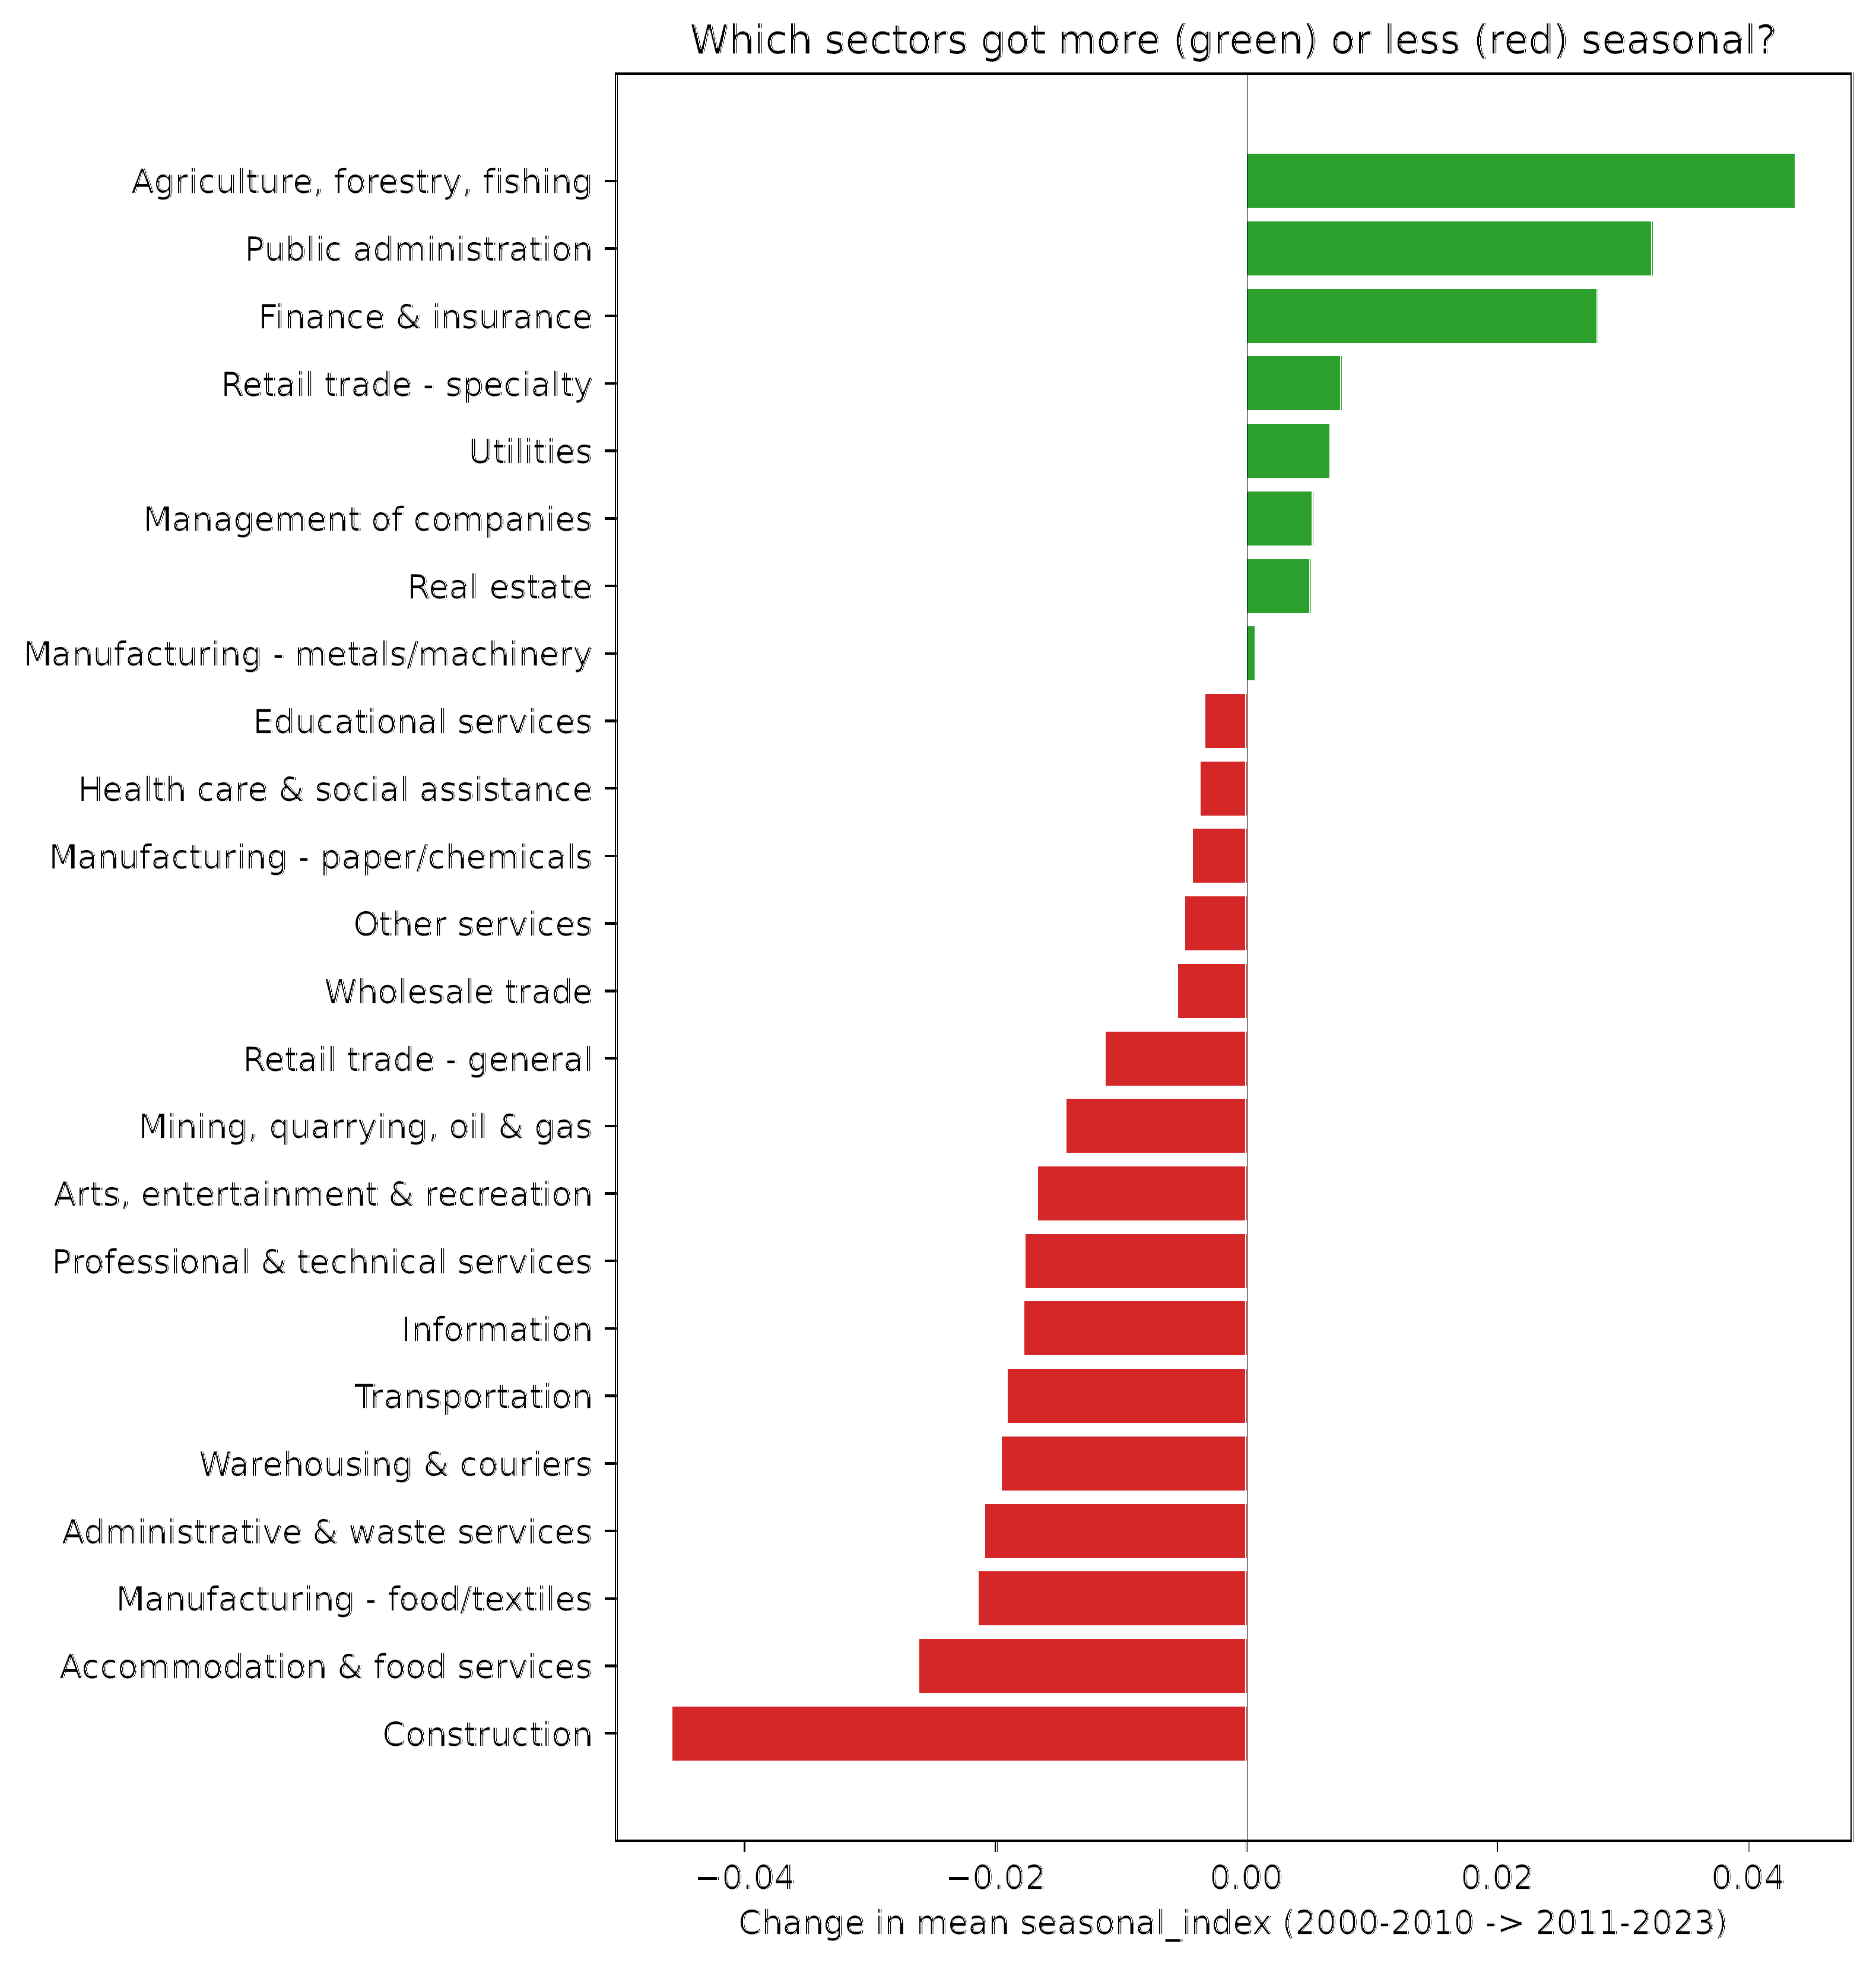
Splitting the period in two to look at 2000-2010 versus 2011-2023 shows that agriculture has gotten more seasonal in this decade relative to the previous decade, while construction has gotten less seasonal. It would be interesting to explore why this might be true (if it is in fact true, since this is just a first pass descriptive look). Maybe changes in weather/climate as the recent paper by Zivin, Lepinteur, Neidell, and Castro found for seasonal job loss?
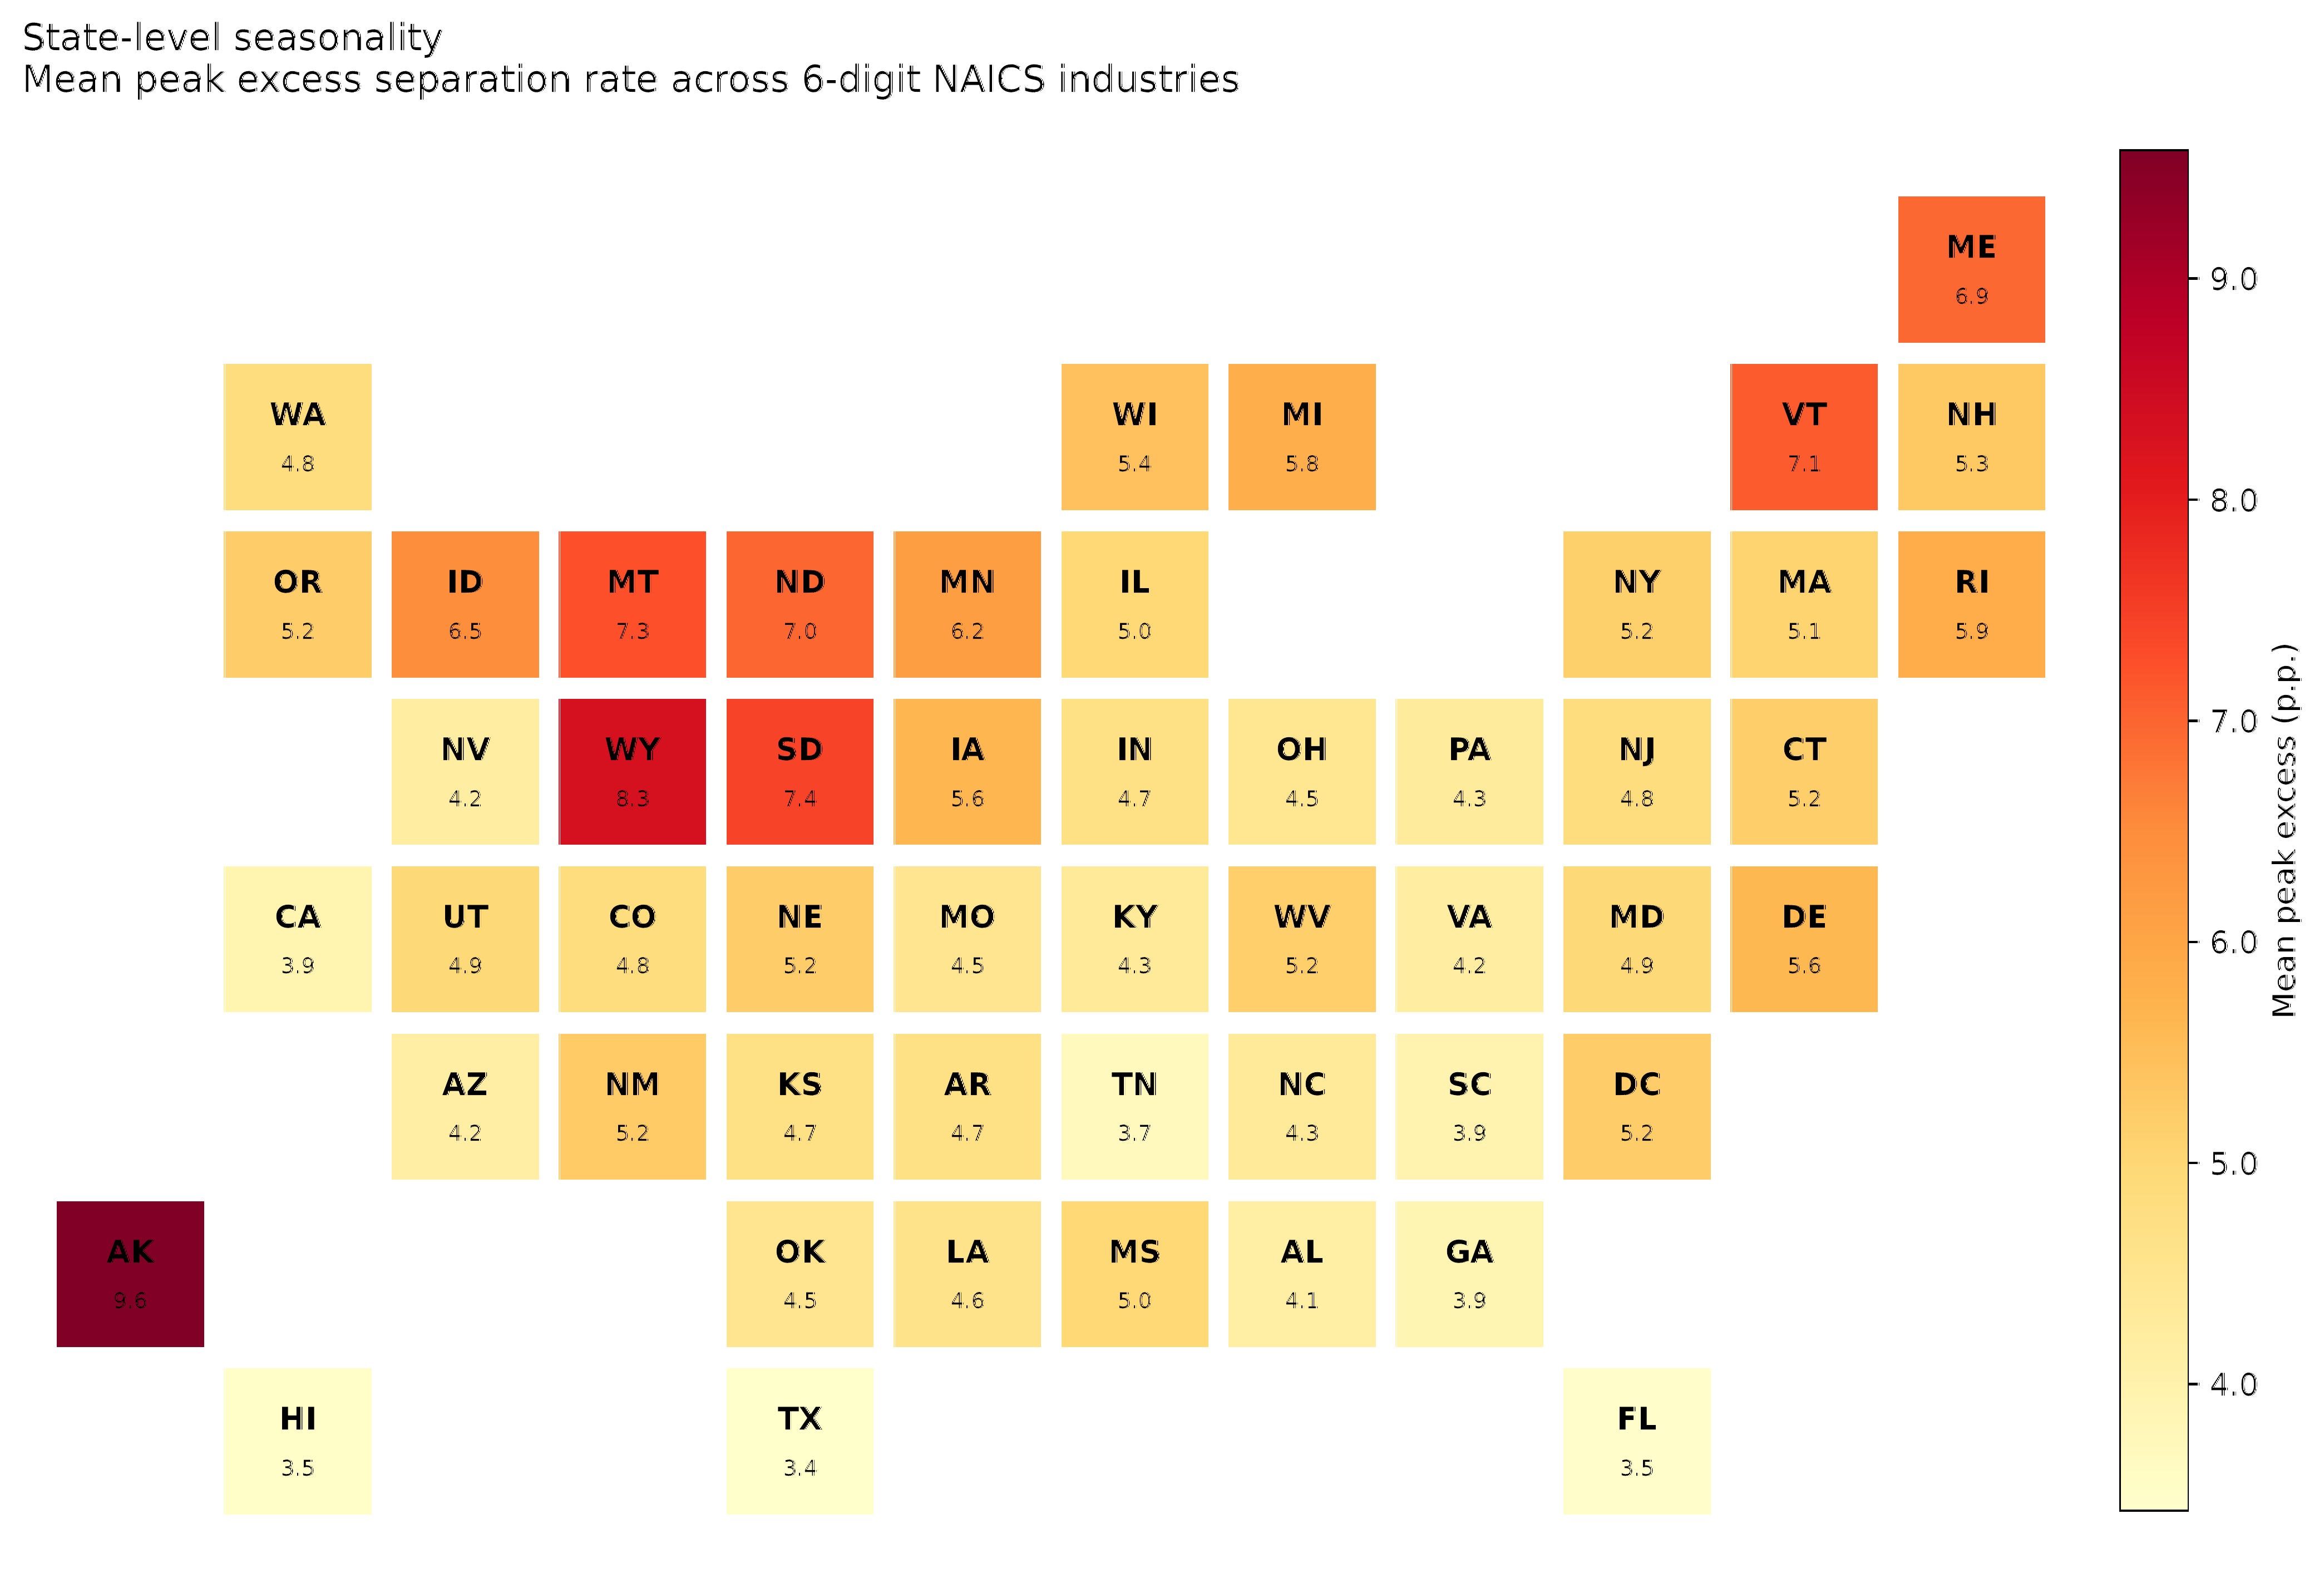
For industries where there was enough coverage, I calculated state-specific seasonality indices at the NAICS-6 level. Alaska is the most seasonal and Texas is the least seasonal overall.
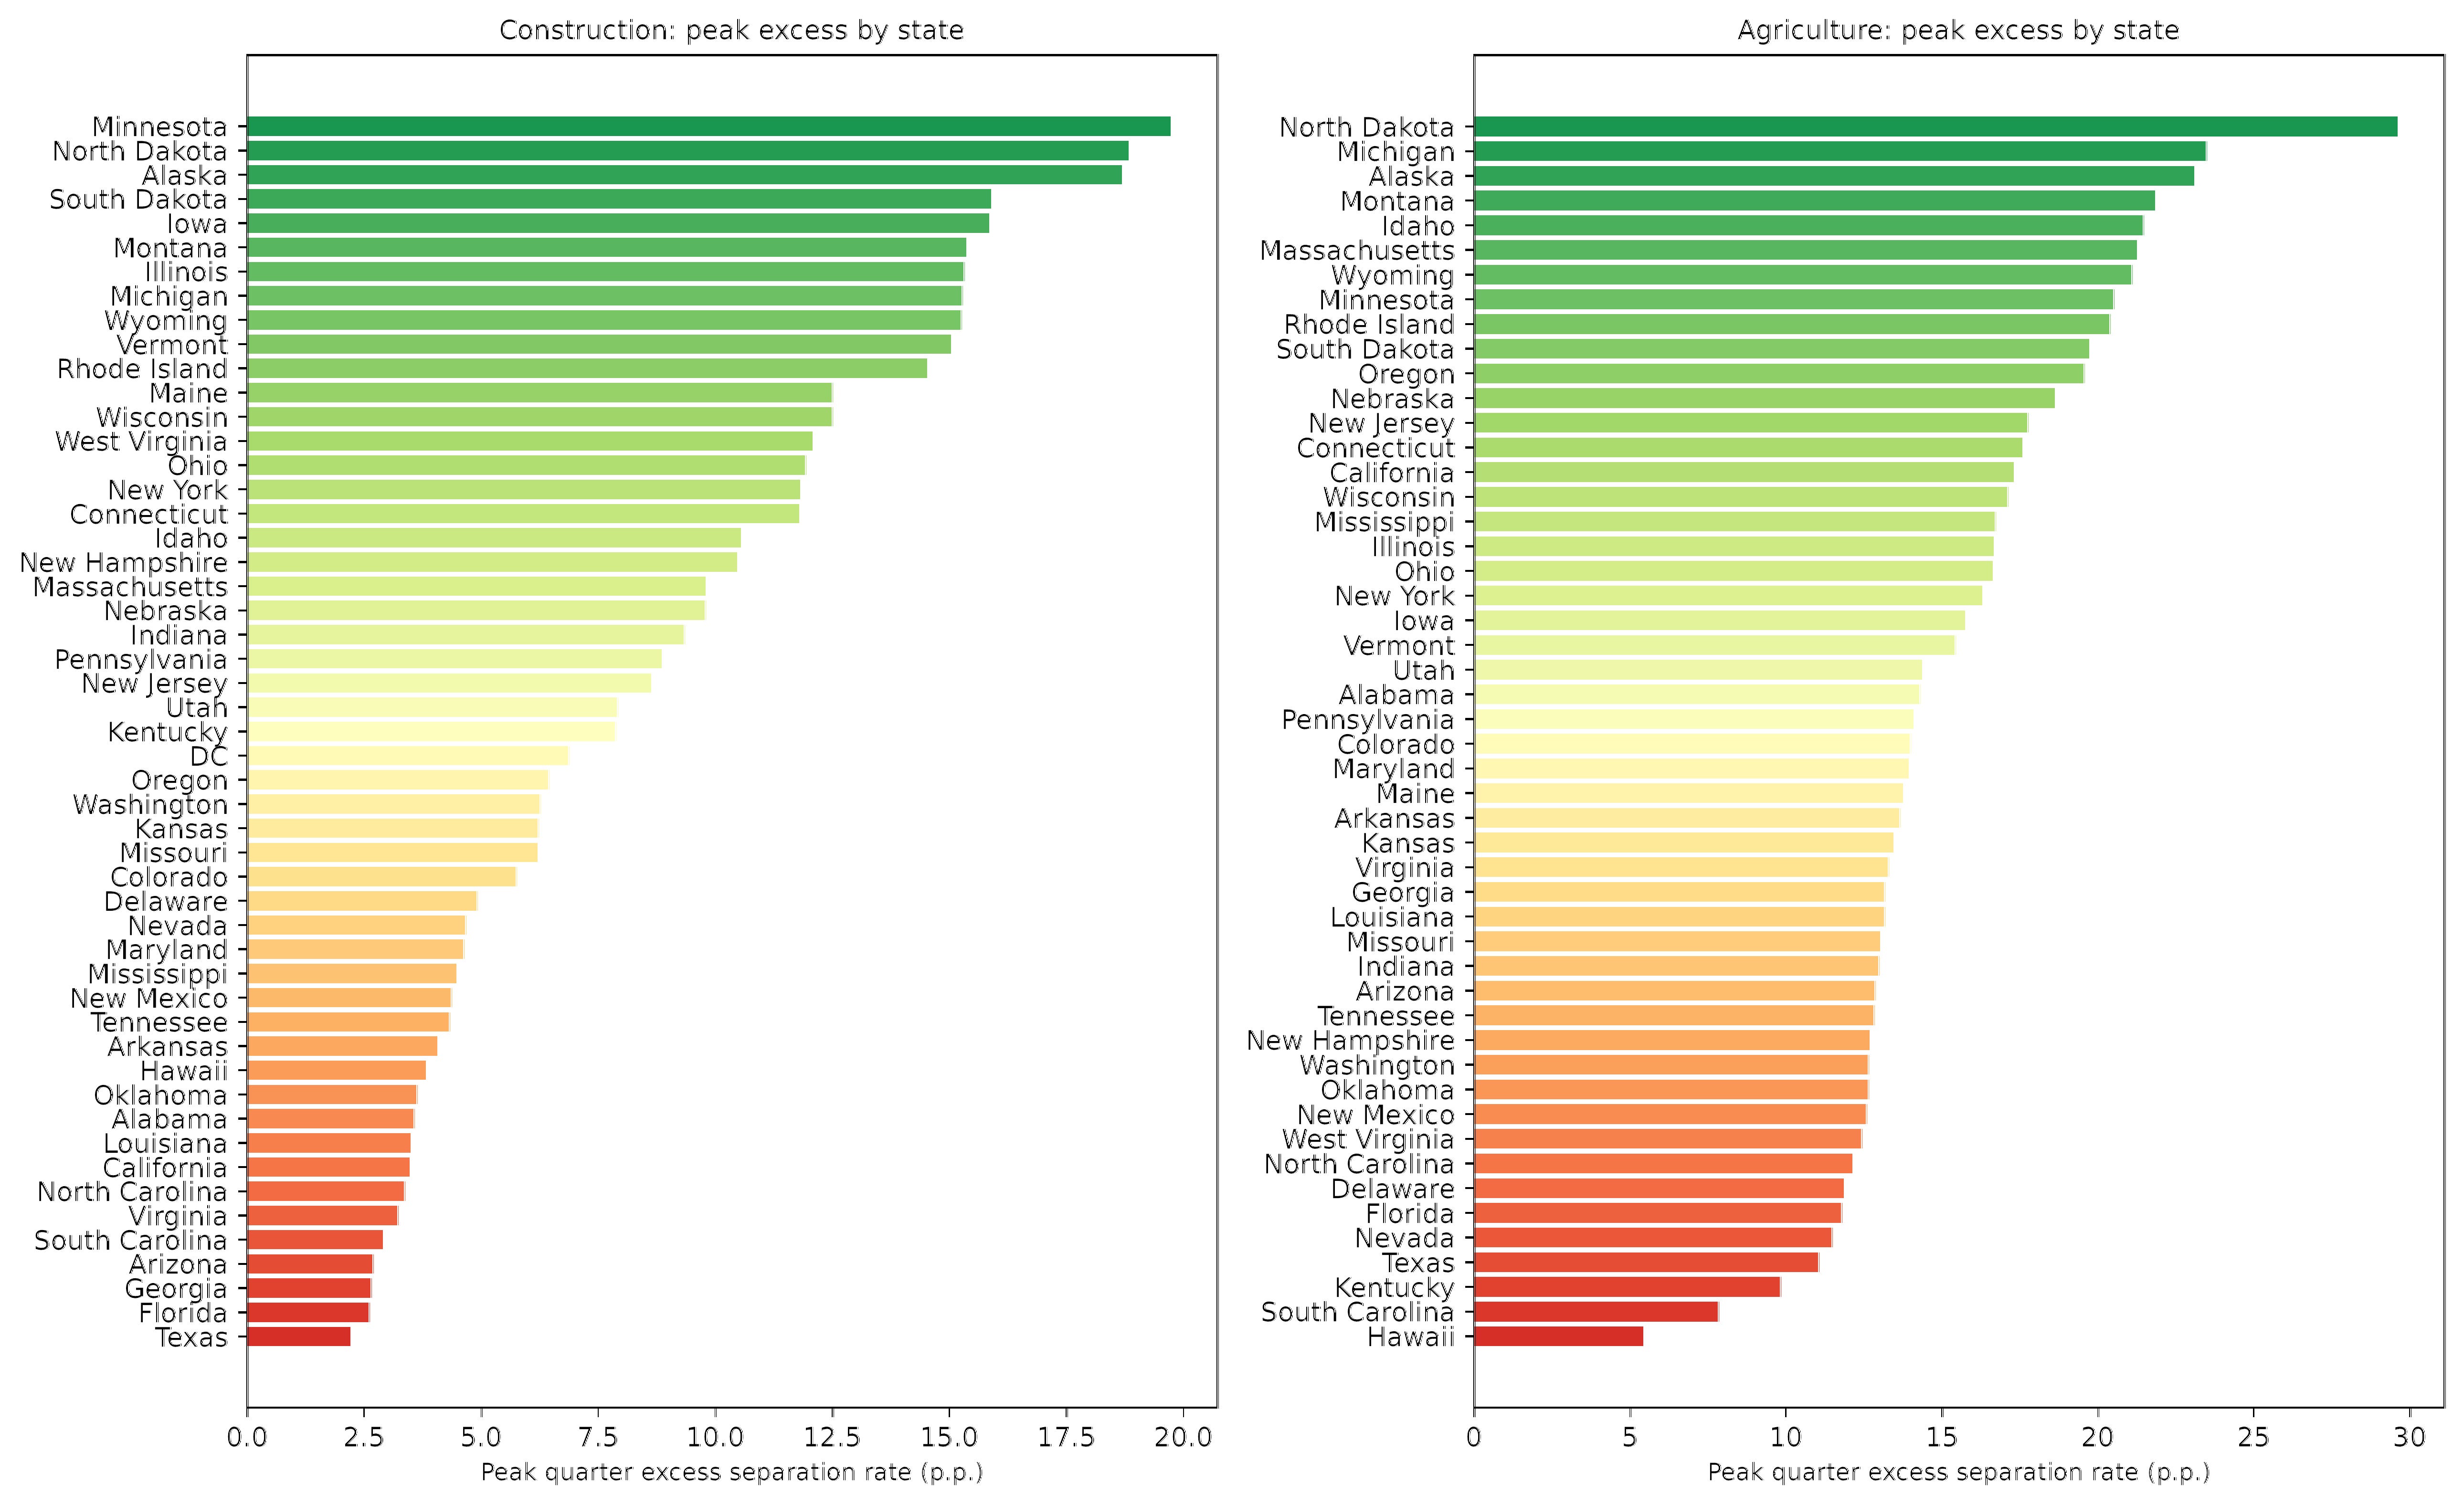
Minnesota has the most seasonal construction and Texas has the least seasonal, while Montana has the most seasonal agriculture and Hawaii has the least seasonal. California is relatively high on seasonality of agriculture, but low on seasonality of construction.
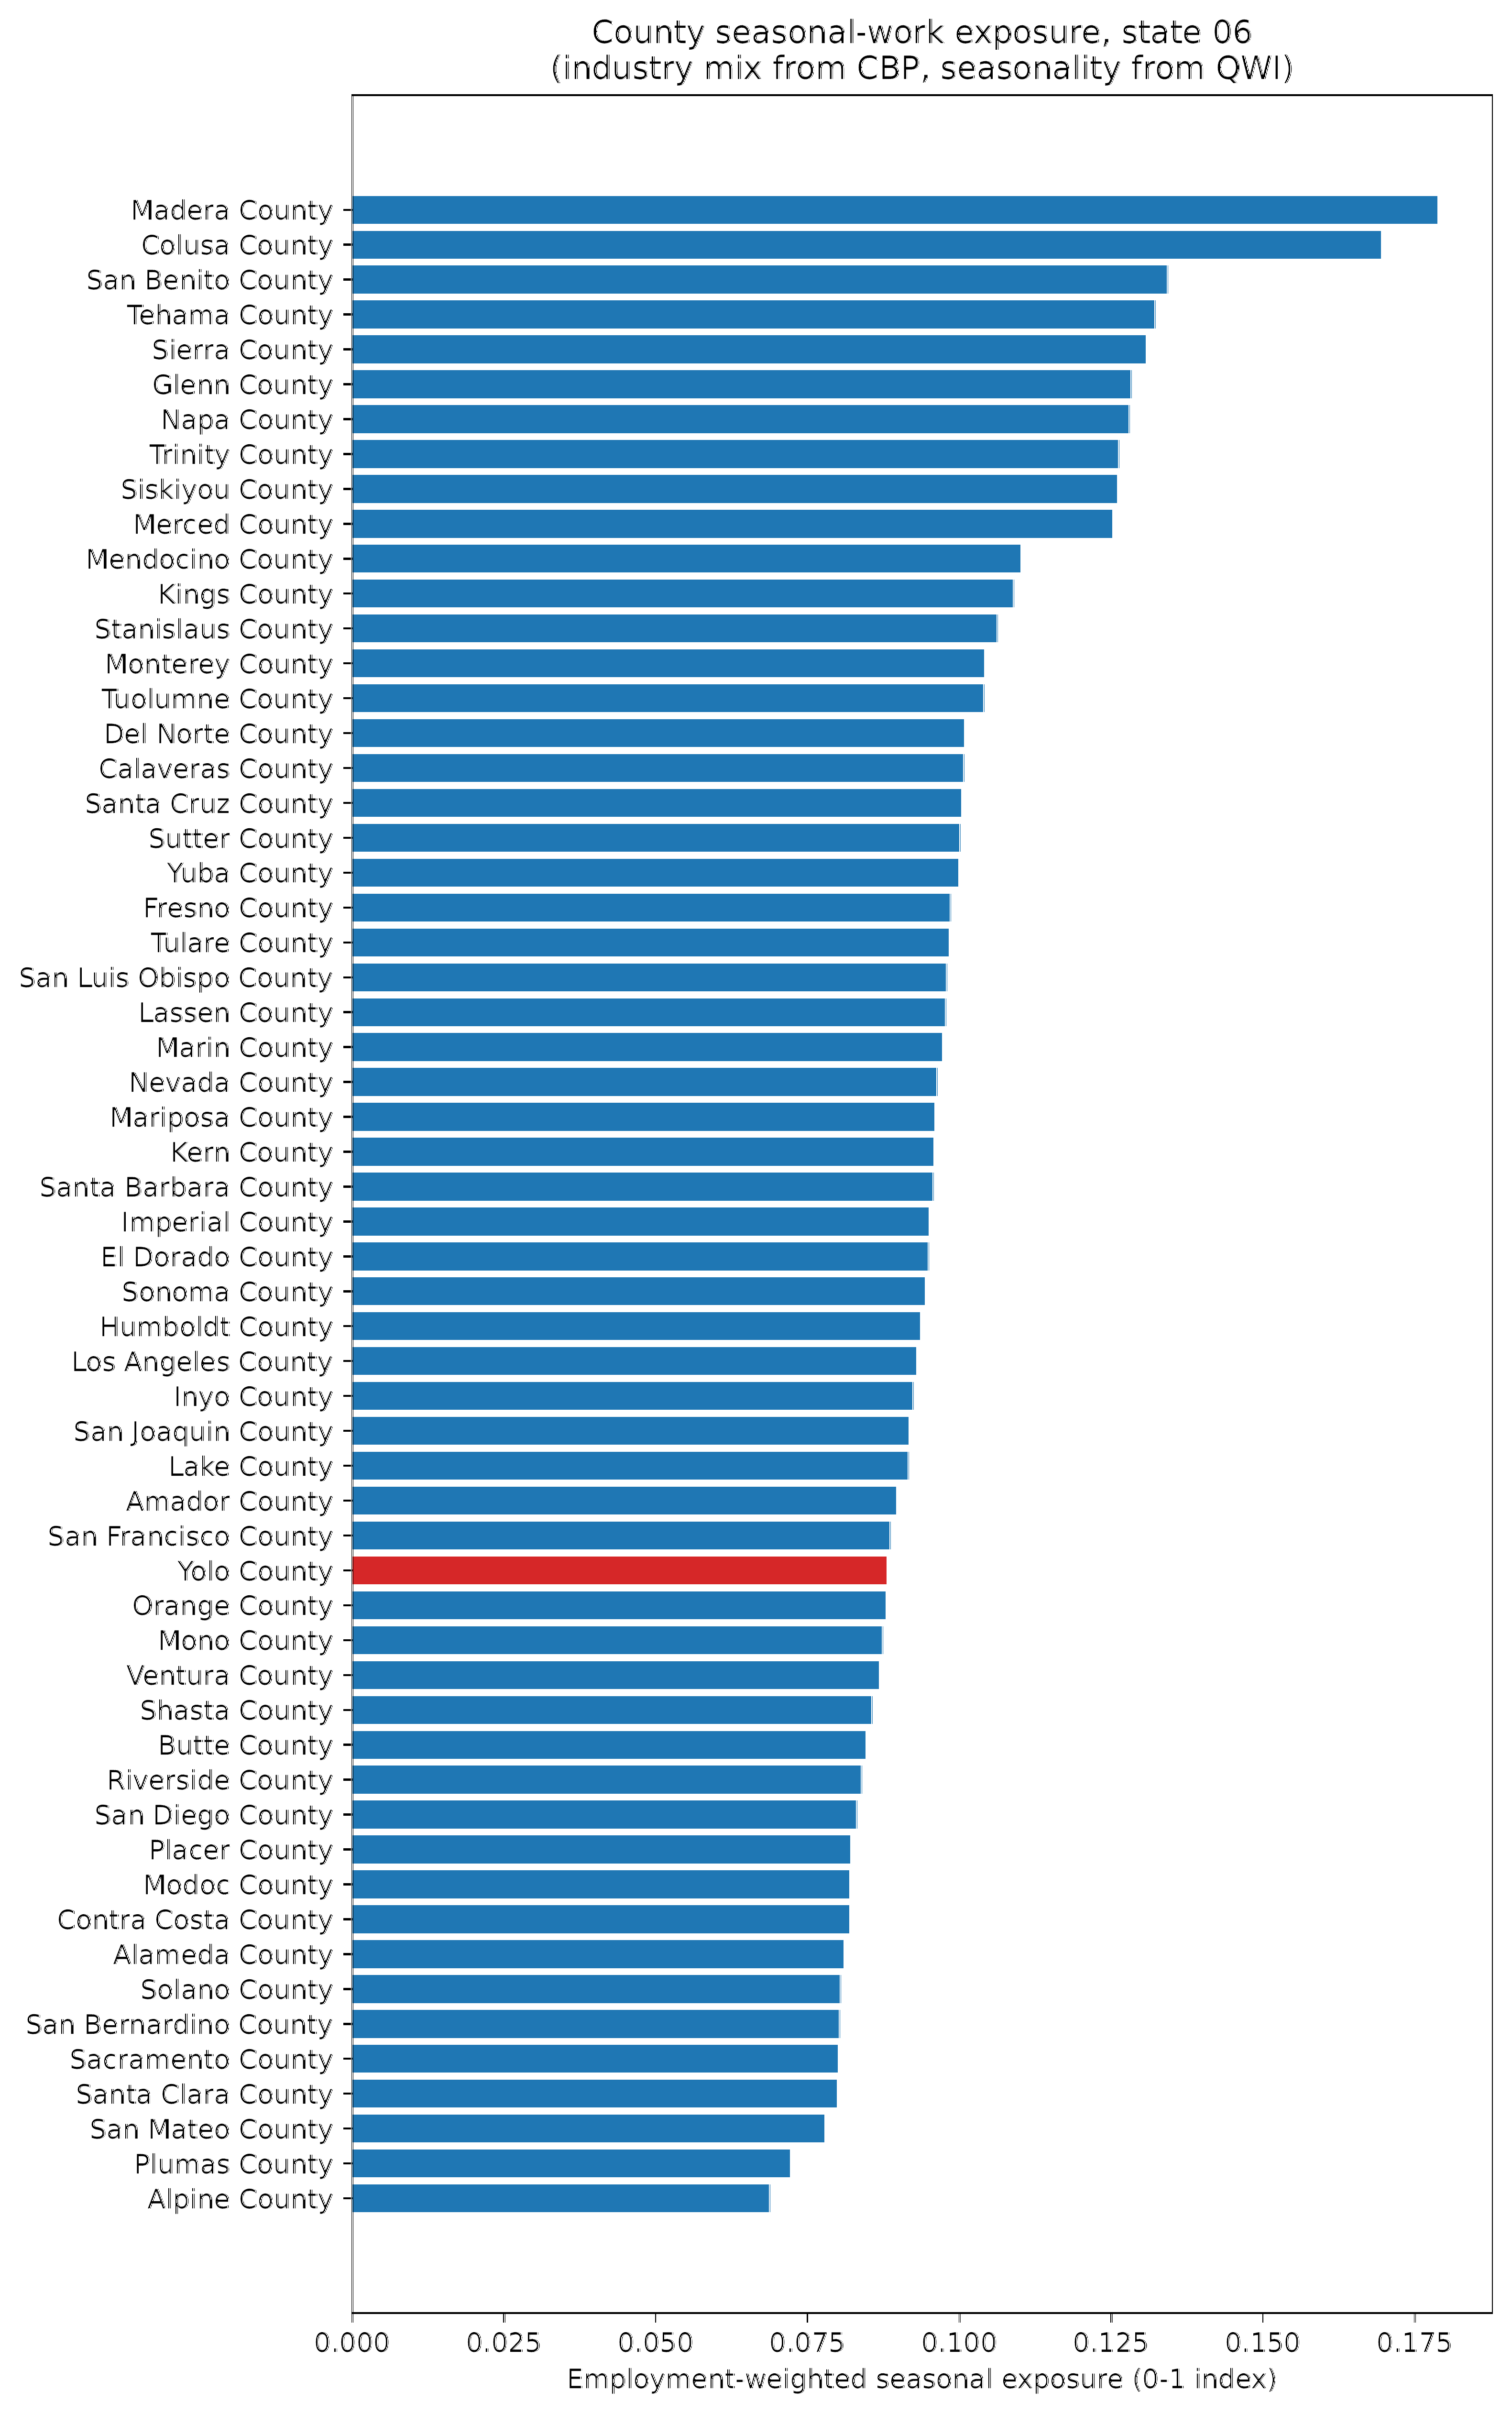
I was curious about how much my county of residence, Yolo County, California, was exposed to seasonality of work, so I downloaded California County Business Patterns data by NAICS-6 (reverting to NAICS-4 for county/industries where the NAICS-6 level data wasn’t populated). I created a employment-weighted seasonality index for each county in California, using the California-specific seasonality index when it’s populated, but using the national level when I didn’t have state-level coverage for that NAICS. Yolo County has around low to average exposure for California counties - higher exposure than some of the more urban counties, but much less than for the mostly rural, agricultural counties.
If you are interested, all of this analysis (and more that I didn’t bother describing) is here, along with the CSV files with the indices: https://github.com/dismalscientist86/Seasonal_work
No posts
Comments
Nothing yet. Say the first thing.
Sign in to join the conversation.