
Here’s what we cover this week across the world of sustainability, risk, and finance:
At a glance:
Risk | 42B in Nat Cat Losses in the first half of 2026
Finance | Extreme Heat Could Cost Europe A Year’s Worth of Economic Growth
Regulation | EU Sustainable Packaging Regulation Goes into Effect
Policy | Why Most Sustainable Finance Taxonomies Miss Transition Finance
Research | AI Productivity Gains: Fossil Fuels vs. Renewable Energy
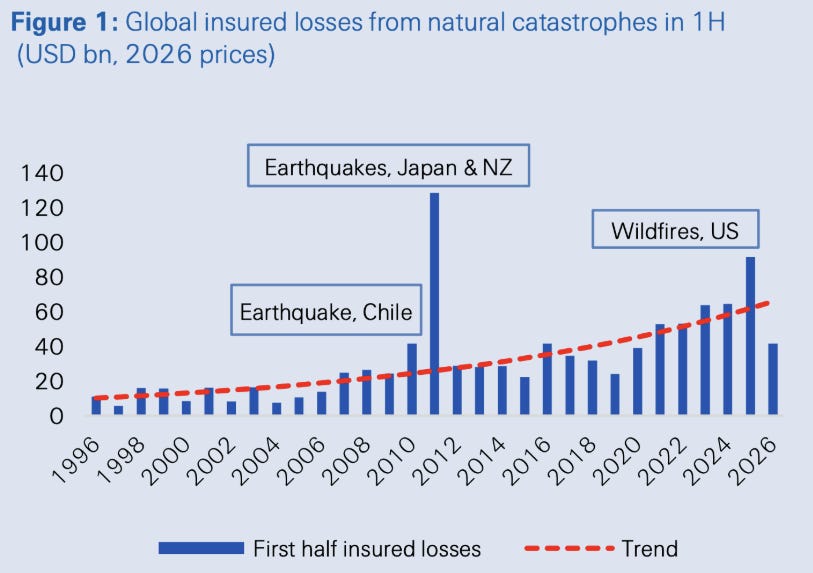
Swiss Re Institute estimates that global insured natural catastrophe losses reached USD 42 billion in the first half of 2026. Losses were driven mainly by severe convective storms in the US, including thunderstorms, hail, tornado outbreaks and straight-line winds, alongside winter storms in the US and Europe.
These are the key stats:
Insurance covered around 42% of USD 100 billion in total economic losses, above the 30-year average of 33%.
The Venezuela earthquake was the costliest event of H1 at USD 20 billion, becoming Latin America’s costliest natural catastrophe since the 2010 Chile earthquake.
Western Europe experienced its hottest June on record, and now experiences around 64% more hot days each year (21-26) than in the 1950s
Historically, 58% of insured natural catastrophe losses occur in the second half of the year. While a strengthening El Niño may suppress North Atlantic hurricane activity, the risk of a major landfall remains.
So what?
Just this week, an earthquake disrupted Columbia, a typhoon made landfall in China, the UK entered its 5th heatwave and France’s severe drought continued.
This makes structural risk reduction and resilience increasingly important. Extreme heat, storms, droughts, and other hazards can disrupt supply chains, damage infrastructure, and strain energy and water systems. Companies that understand where they are exposed and invest early in adaptation and resilience will be better positioned as physical climate risks become more frequent and costly.
Read more from SwissRe
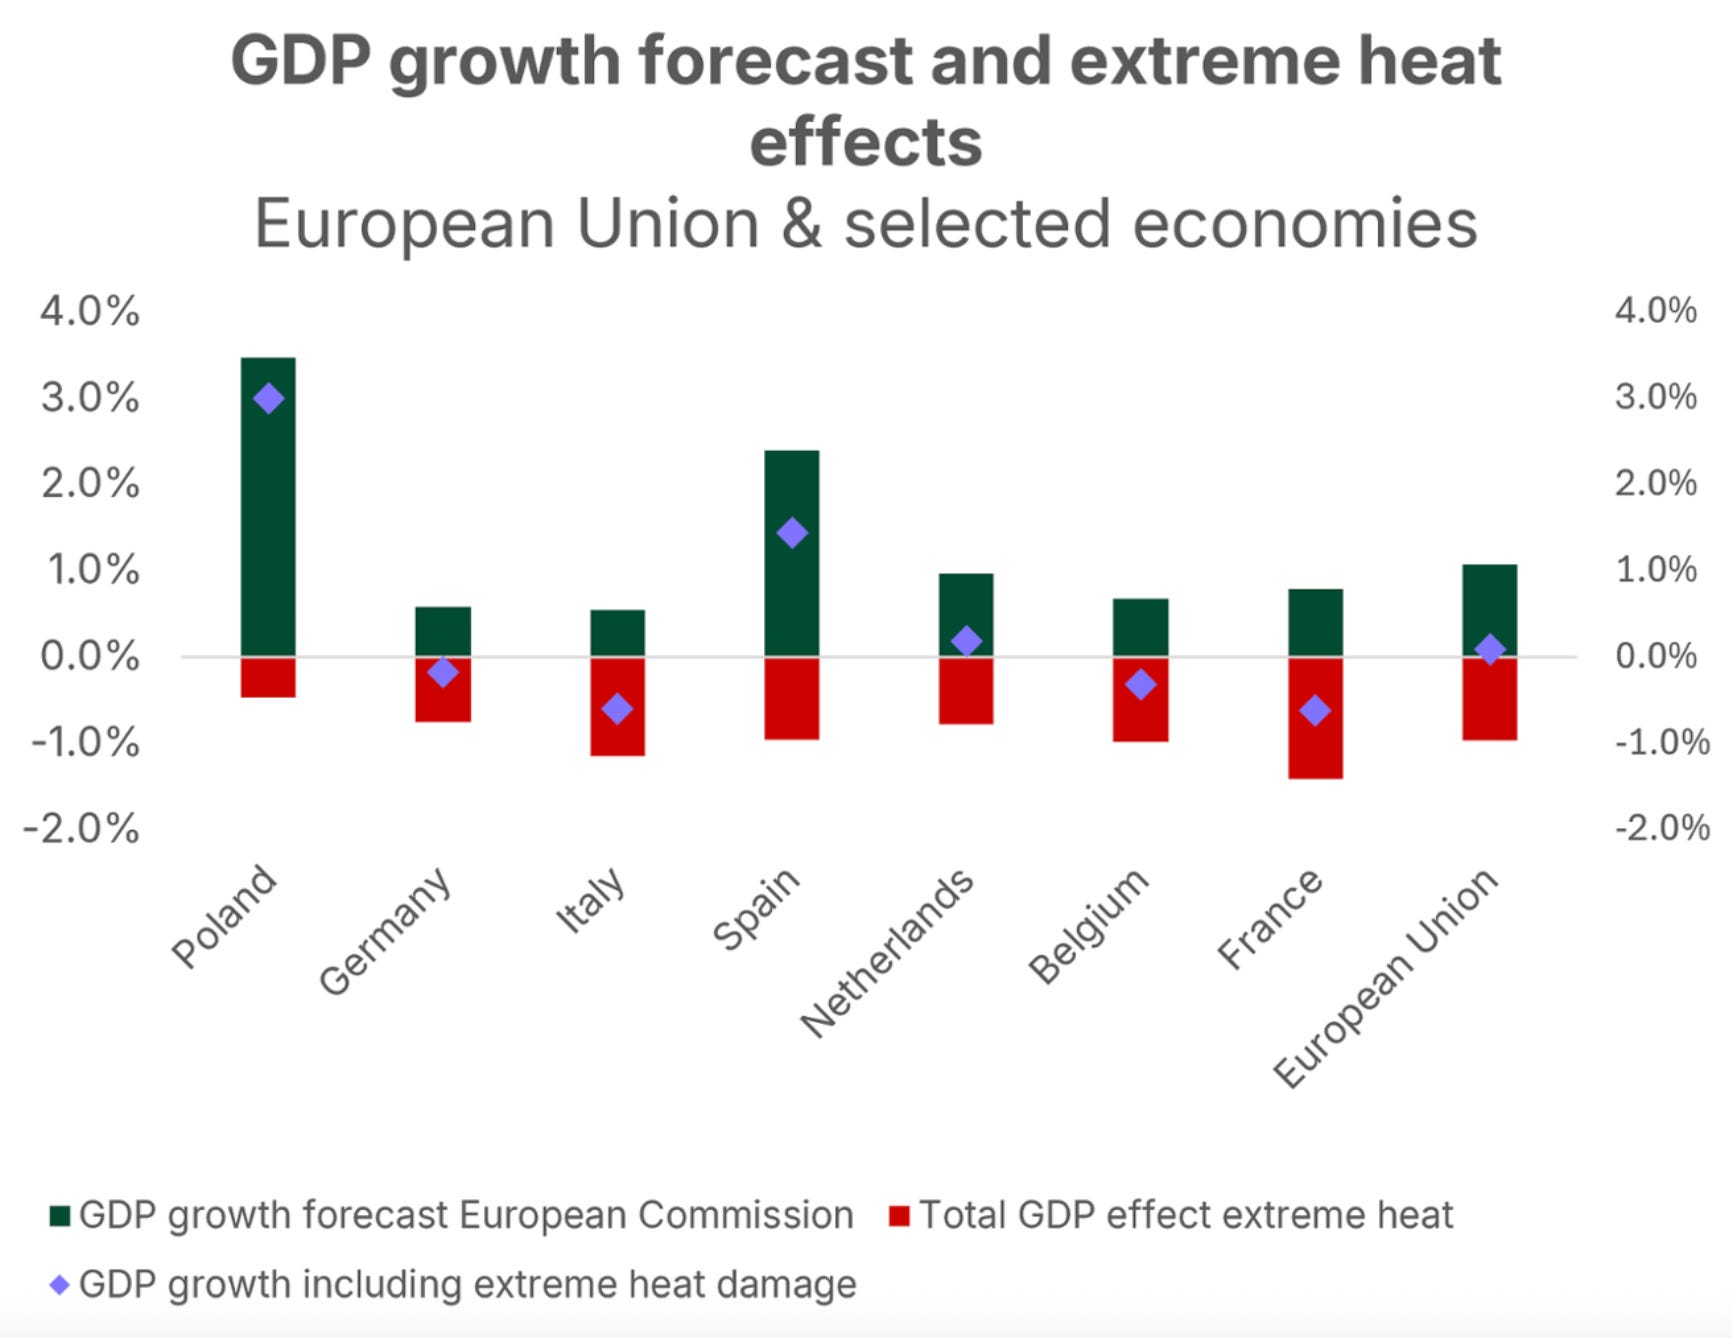
Dutch bank Triodos estimates that this summer’s extreme heat and drought could wipe out much of the economic growth expected across Europe in 2026. The bank estimates that heat-related disruption could reduce EU GDP by around 1%, equivalent to roughly €180 billion due to weaker labor productivity and falling agricultural output. The European Commission and the IMF forecast 1.1% and 0.9% EU GDP growth in 2026.
More specifically, the report found:
Labor productivity losses could reduce EU GDP by around 0.6%.
Agricultural output is expected to fall by 3% to 7%.
France, Italy, Spain and Belgium could face the most significant losses.
Besides reducing productivity, Triodos cites higher food prices, constrained power generation, rising electricity costs, and disruption to roads, railways and inland waterways as spillover effects of extreme heat.
So what?
This analysis shows how extreme heat creates meaningful economic impacts today. While its most direct impact is lower labor productivity, the effects spread across agriculture, food prices, electricity systems, and transport. When those pressures occur simultaneously, they can significantly reduce growth across an entire economy and even tip it into recession.
Adaptation measures like cooling workplaces, strengthening infrastructure and improving water management will all matter, but they cannot fully offset rising temperatures. Without stronger mitigation, the economic cost of heat will continue to grow.
Read more from Triodos
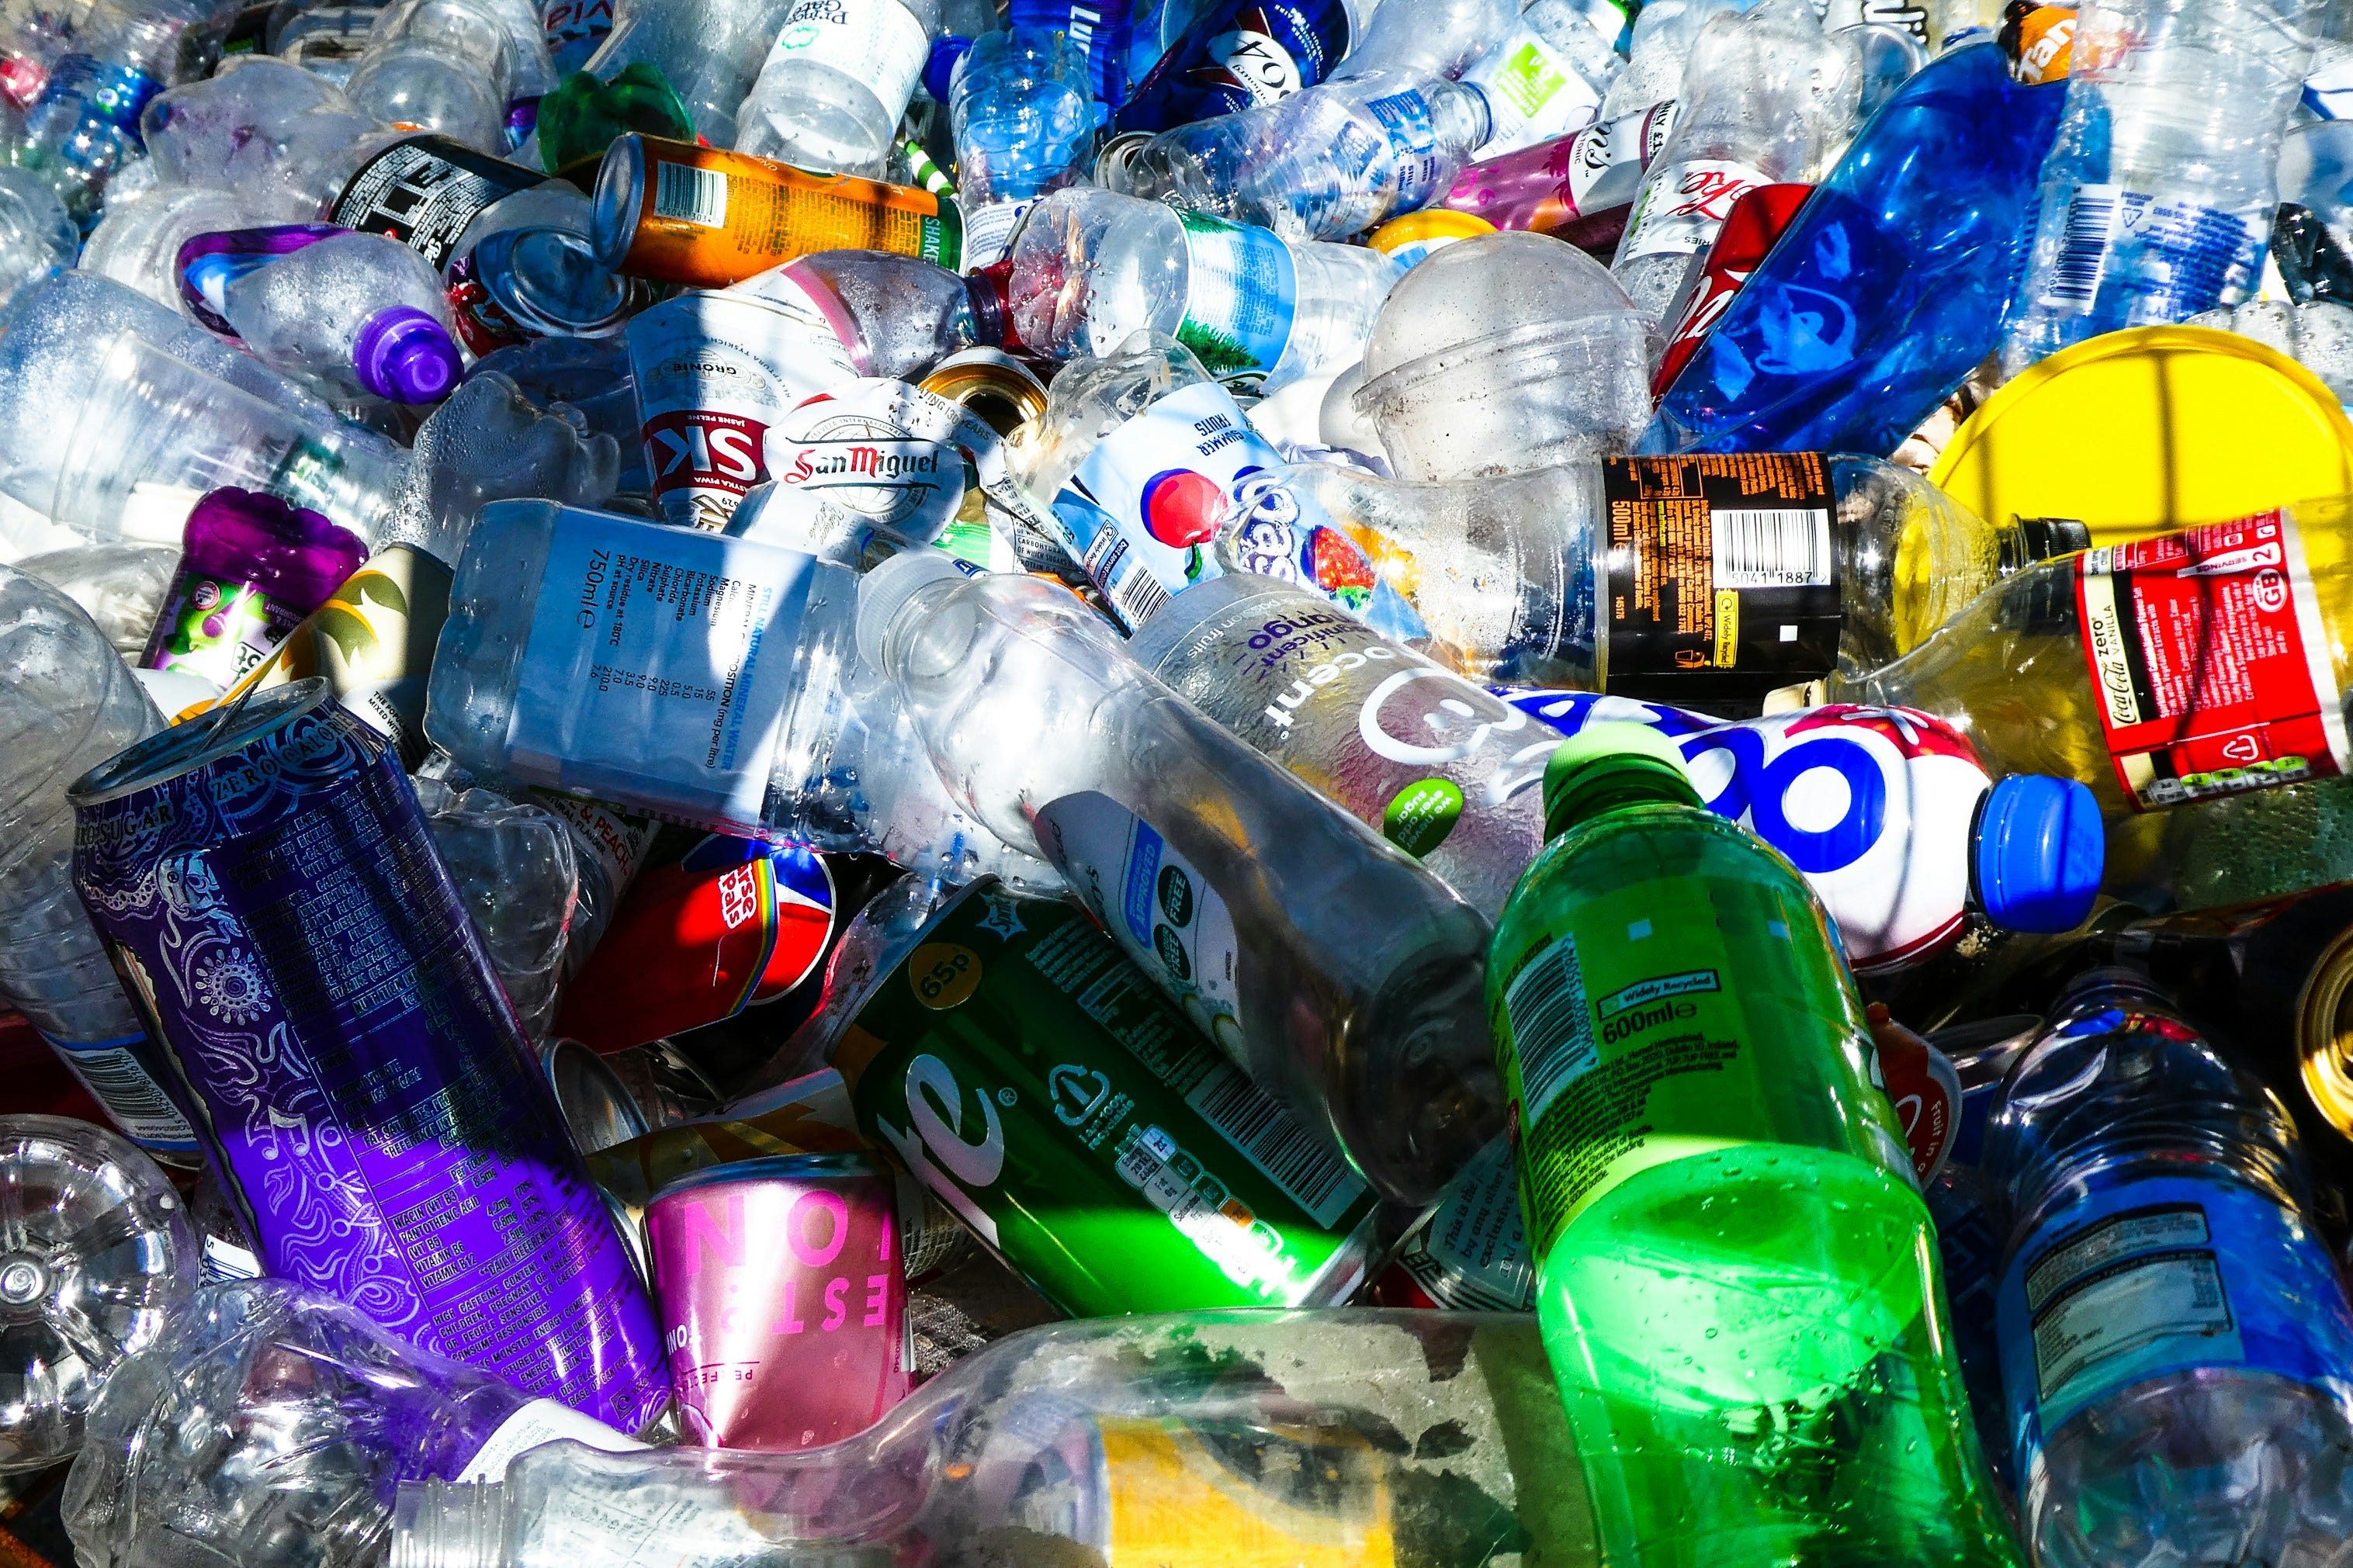
The EU’s revised Packaging and Packaging Waste Regulation came into effect this week, starting a multi-year rollout of rules designed to reduce packaging waste, increase recycling and limit harmful substances.
The rules in effect today include PFAS limits on food-contact packaging sold in the EU along with new traceability and identification requirements to hold manufacturers and importers accountable. A harmonized EU-wide packaging labelling system will apply from 2028.
By 2030, all packaging must be designed for recycling, with recycling at scale required by 2035. Moreover, certain single-use plastic packaging, including some food, hospitality and toiletry formats, will be banned from 2030.
The scale of the challenge is significant. The EU currently generates around 186 kg of packaging waste per person each year, while packaging accounts for 40% of plastics and 50% of paper used across the bloc.
So what?
The PPWR shows how regulation can reshape markets well before the final deadlines arrive. The direction is clear: less waste, more recyclable packaging, tighter controls on harmful substances, and greater use of circular materials.
For companies importing to Europe, these changes will affect product design, sourcing, labelling, and supplier relationships. With major requirements coming into force from 2028 onwards, firms will need to adjust well before 2030.
It’s great to see regulation increasingly setting the commercial conditions for circularity. Companies that move early will be better placed to manage transition costs, reduce exposure to restricted materials, and compete as packaging standards tighten across the EU.
Read more from ESG Today
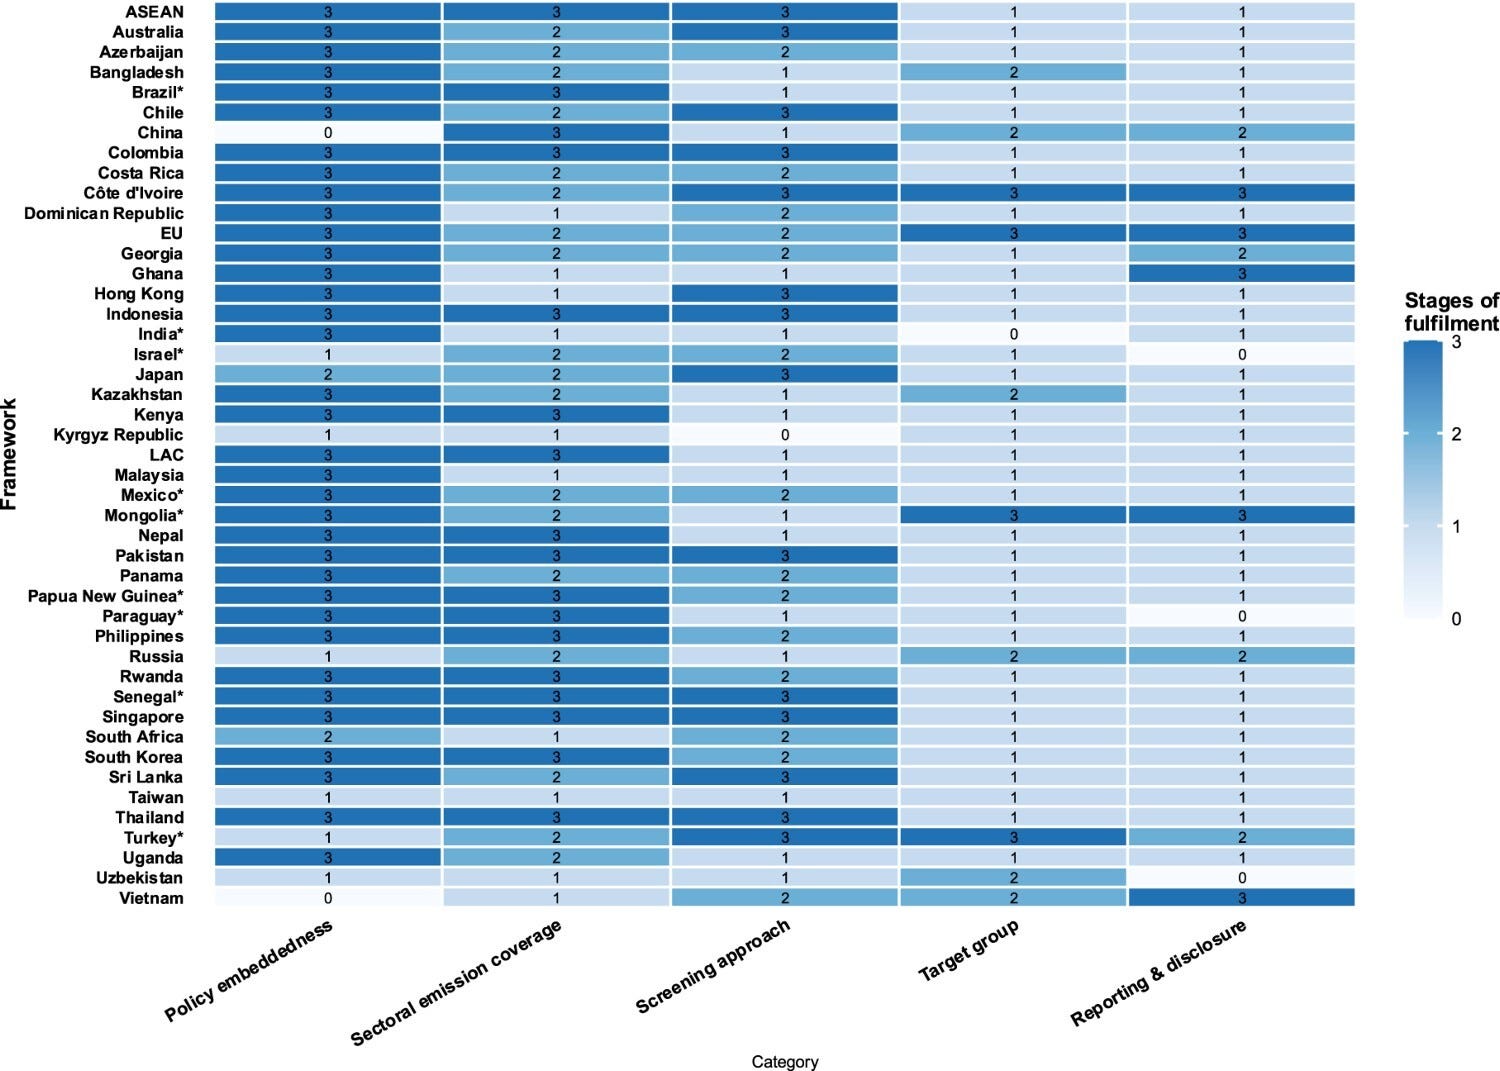
A new study compared 45 sustainable finance taxonomies worldwide. The authors systematically reviewed each taxonomy against five design criteria:
Policy embeddedness: whether it was linked to national climate targets, NDCs, the Paris Agreement or other sustainability policies.
Sectoral emissions coverage: which parts of the economy were covered and what share of national emissions those sectors represented.
Screening approach: how activities qualified, for example through technical screening criteria, whitelists or principles, and whether there were specific provisions for transition activities.
Target group: who the taxonomy applied to, such as banks, investors or companies, and whether its use was mandatory or voluntary.
Disclosure and reporting: whether users had to disclose taxonomy alignment and whether reporting was tied to standards such as ISSB, CSRD or TCFD.
The review found that most frameworks are somewhat connected to climate policy but weaker on the features needed to support transition finance. Most taxonomies identify activities that are already environmentally sustainable, while relatively few provide clear, time-bound pathways for high-emitting activities to become aligned with net zero.
The researchers argue that stronger transition criteria should include interim targets, clear timelines, net-zero pathways and links to corporate transition plans, so investors can distinguish credible transition plans from activities that remain high-emitting without a clear path to decarbonize.
So what?
The study highlights a major gap in sustainable finance. Most taxonomies are good at identifying activities that are already green, but the harder task is determining which emissions-intensive businesses are genuinely moving towards net zero.
That distinction matters because much of the transition will take place in sectors such as energy, manufacturing, transport, and mining, where low-carbon alternatives cannot always be deployed quickly. A credible taxonomy must show the direction and speed of travel, using interim targets, transition pathways and clear timelines rather than relying only on a static classification.
Interoperability is also important. As more countries develop their own frameworks, greater alignment around standards would make it easier to compare transition activities and direct capital towards credible decarbonization across markets.
Access the study here
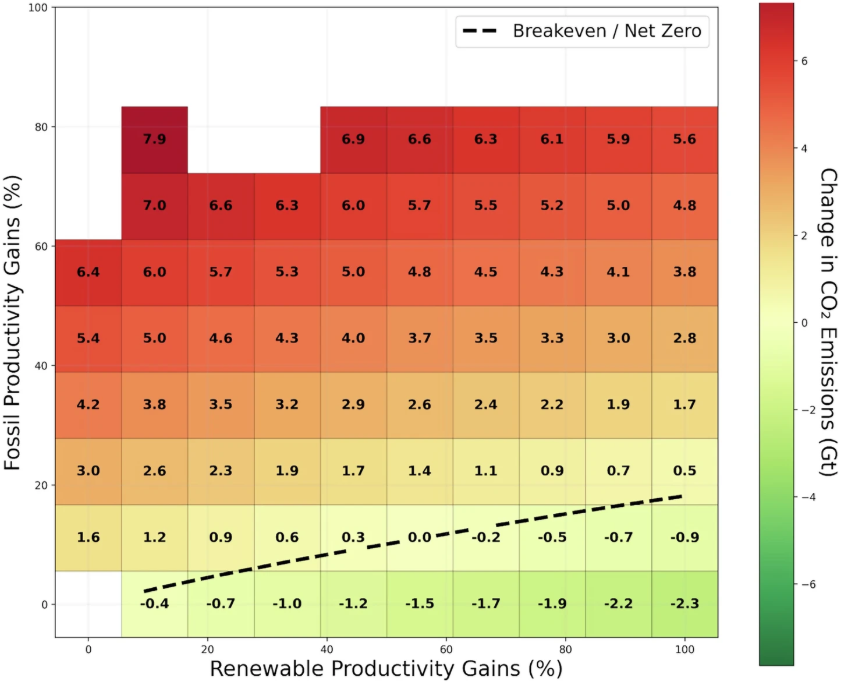
A new study examines an overlooked part of AI’s climate impact: how AI can improve productivity across both clean energy and fossil fuels.
The researchers used an economic model that tracks how productivity changes in one part of the economy affect production, prices and demand elsewhere. They modelled AI-driven productivity improvements across fossil fuel extraction and power generation, renewable energy, grid infrastructure and selected energy-intensive industries.
They found:
Under scenarios where AI adoption advances similarly across fossil fuels and renewables, the model estimates a net increase in annual global CO₂ emissions of 0.47–1.8 Gt, equivalent to 1.2–4.8% of 2024 global energy-related emissions.
AI-driven improvements in fossil fuel productivity could enable 0.6–2.4 Gt of additional annual CO₂ emissions. The largest effect comes from AI improving upstream fossil fuel extraction, which makes fossil fuels cheaper and more economically competitive, increasing consumption across the wider economy.
For AI to reduce net emissions, the model finds that productivity improvements in renewables would need to be roughly 4–5 times greater than improvements in fossil fuels. Every 1% improvement in fossil fuel productivity would require around 4–5% improvement in renewables to offset it.
Improving grids and energy efficiency reduced emissions but was not enough to outweigh the fossil fuel effect when AI simultaneously improved fossil fuel productivity.
Carbon pricing narrowed the gap but did not eliminate it under equal AI adoption. Even at $308/tCO₂, the model still produced a small net increase in emissions.
So what?
AI is a general-purpose technology. It can optimize a renewable grid, but it can also make oil and gas exploration and extraction more productive. Today’s global economy remains heavily dependent on fossil fuels, so improving productivity across the energy system may strengthen incumbent fossil fuel industries faster than it accelerates their displacement.
That has important implications for AI governance and climate strategy. Measuring data center emissions alone misses this important element. We also need to understand whether efficiency gains from using AI reduce total emissions once changes in production and demand are considered.
Access the paper here
Enjoyed this analysis? D. A. Carlin & Company helps clients navigate a changing world through strategic briefings, practical capacity-building workshops, and regulatory support. Book a call with us today (info@dacarlin.com) and find out how we can give you and your team the future-ready skills and strategies you need.
No posts
Comments
Nothing yet. Say the first thing.
Sign in to join the conversation.