

Maybe if I found five files scattered through these boxes, and compiled them…?
Recently, a client asked me to pull together a briefing memo with talking points and a fact sheet on the Workforce Innovation and Opportunity Act (WIOA) in New York State. The talking points were simple enough: I’ve written a lot about WIOA, mostly on here, to have a coherent point of view on both the law as it exists now and as I think it should be revised. As for advocacy priorities, the immediate objective is to resist further cuts and harmful policy changes, and longer-term, to meaningfully reinvest in and reimagine what workforce policy can do.
Compiling the fact sheet, however, was a total bastard—because the way the program is organized, it’s almost literally impossible to answer seemingly simple and straightforward questions like “How much money did New York get to run WIOA programs in 2025?” and “How many New Yorkers did those programs serve last year?”
You know: the questions with which not only any funder or elected official, but any mildly thoughtful layperson, would begin a conversation about the program.
I began this odyssey of profound annoyance with a seemingly simple question for my research assistant:

Claude tried to be helpful, as it always does.1 After explaining that “2025” isn’t an operative concept because WIOA Program Years run from July of the named year until June of the following year,2 it produced reasonably precise estimates of funding for Program Year 2024 for services offered under Title I (job training, employment, and related programming for Adult, Dislocated Worker, and Youth customers) and Title II (Adult Education and Literacy).3
But for Title III—the Wagner-Peyser Act , which dates back to the New Deal—we started to see some ambiguity. And it kind of got worse from there:
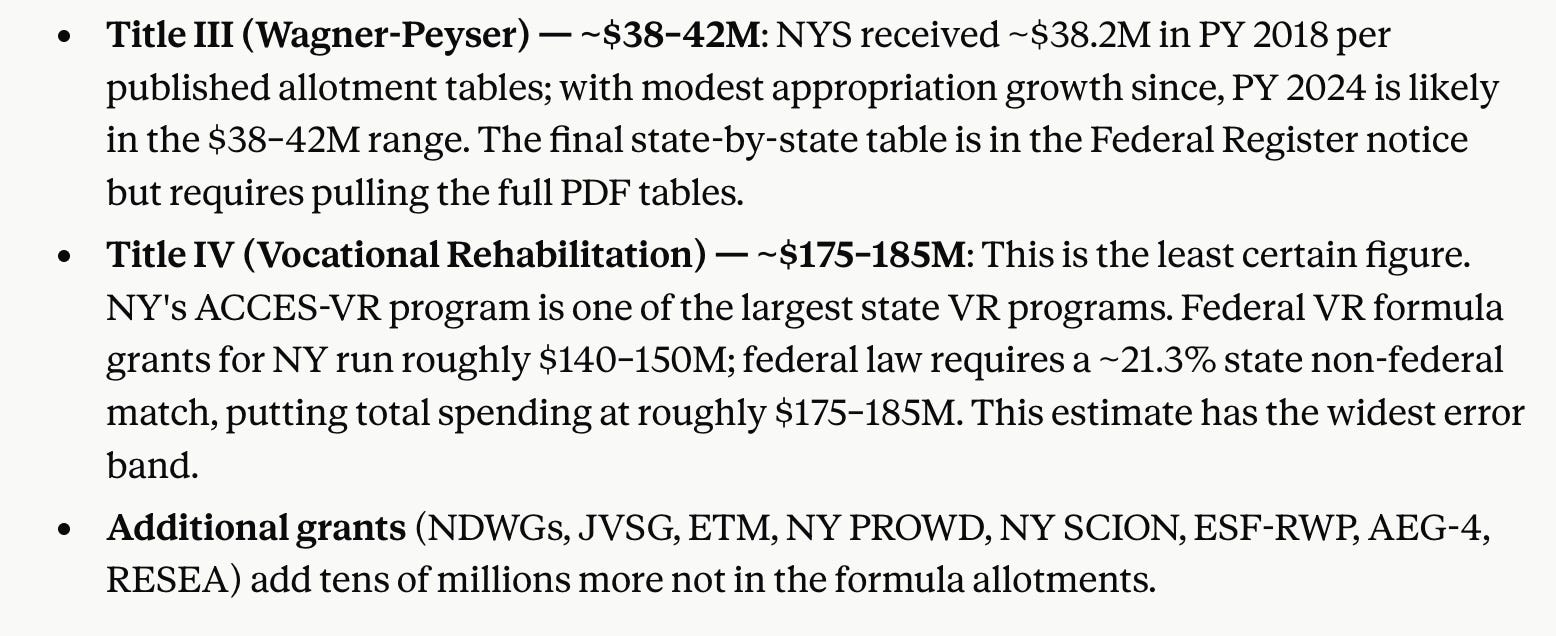
I maybe shouldn’t confess this given the solid possibility that my client will read this post, but I did not “pull the full PDF tables” from the Federal Register.
Ultimately, the estimate was between $540-560 million. That Title IV—which, over my 26 years in this field, I would guess I’ve talked about with people for, total, less than two hours, and can’t remember ever reading a serious brief or report regarding—is the second largest category, feels grimly apt. It’s our version of the medieval map where there’s a huge section with a drawing of a dragon surrounded by question marks.
Still trying to be helpful, Claude noted that if I required “a harder number,” I could peruse the state DOL’s WIOA Obligation/Expenditure Summary, which apparently reaches print “12-18 months after the program year”—meaning that it’s not out yet for PY 2024— “plus ACCES-VR’s [the state agency that co-administers Title IV] annual report for Title IV actuals.”
This, too, I did not pursue.
But the “how much?” question was a virtual straight line compared to the maze of madness that awaited when I asked “how many?”
Claude referred me to this site, maintained by the state DOL, which I’ve used before and is quite good—for what it is, which is a point-in-time or longitudinal summary of WIOA performance broken down by four of the six WIOA program Titles (all three of Title I, and Title III), quarter of exit, and demographic subpopulation (gender, race/ethnicity, age, educational attainment). You can ask for statewide totals, but since there’s no distinct user count, and even the definition of “participant” is super-muddy (see below) you will not receive satisfaction.
As this went on, I began to vent to a sympathetic figurative ear:
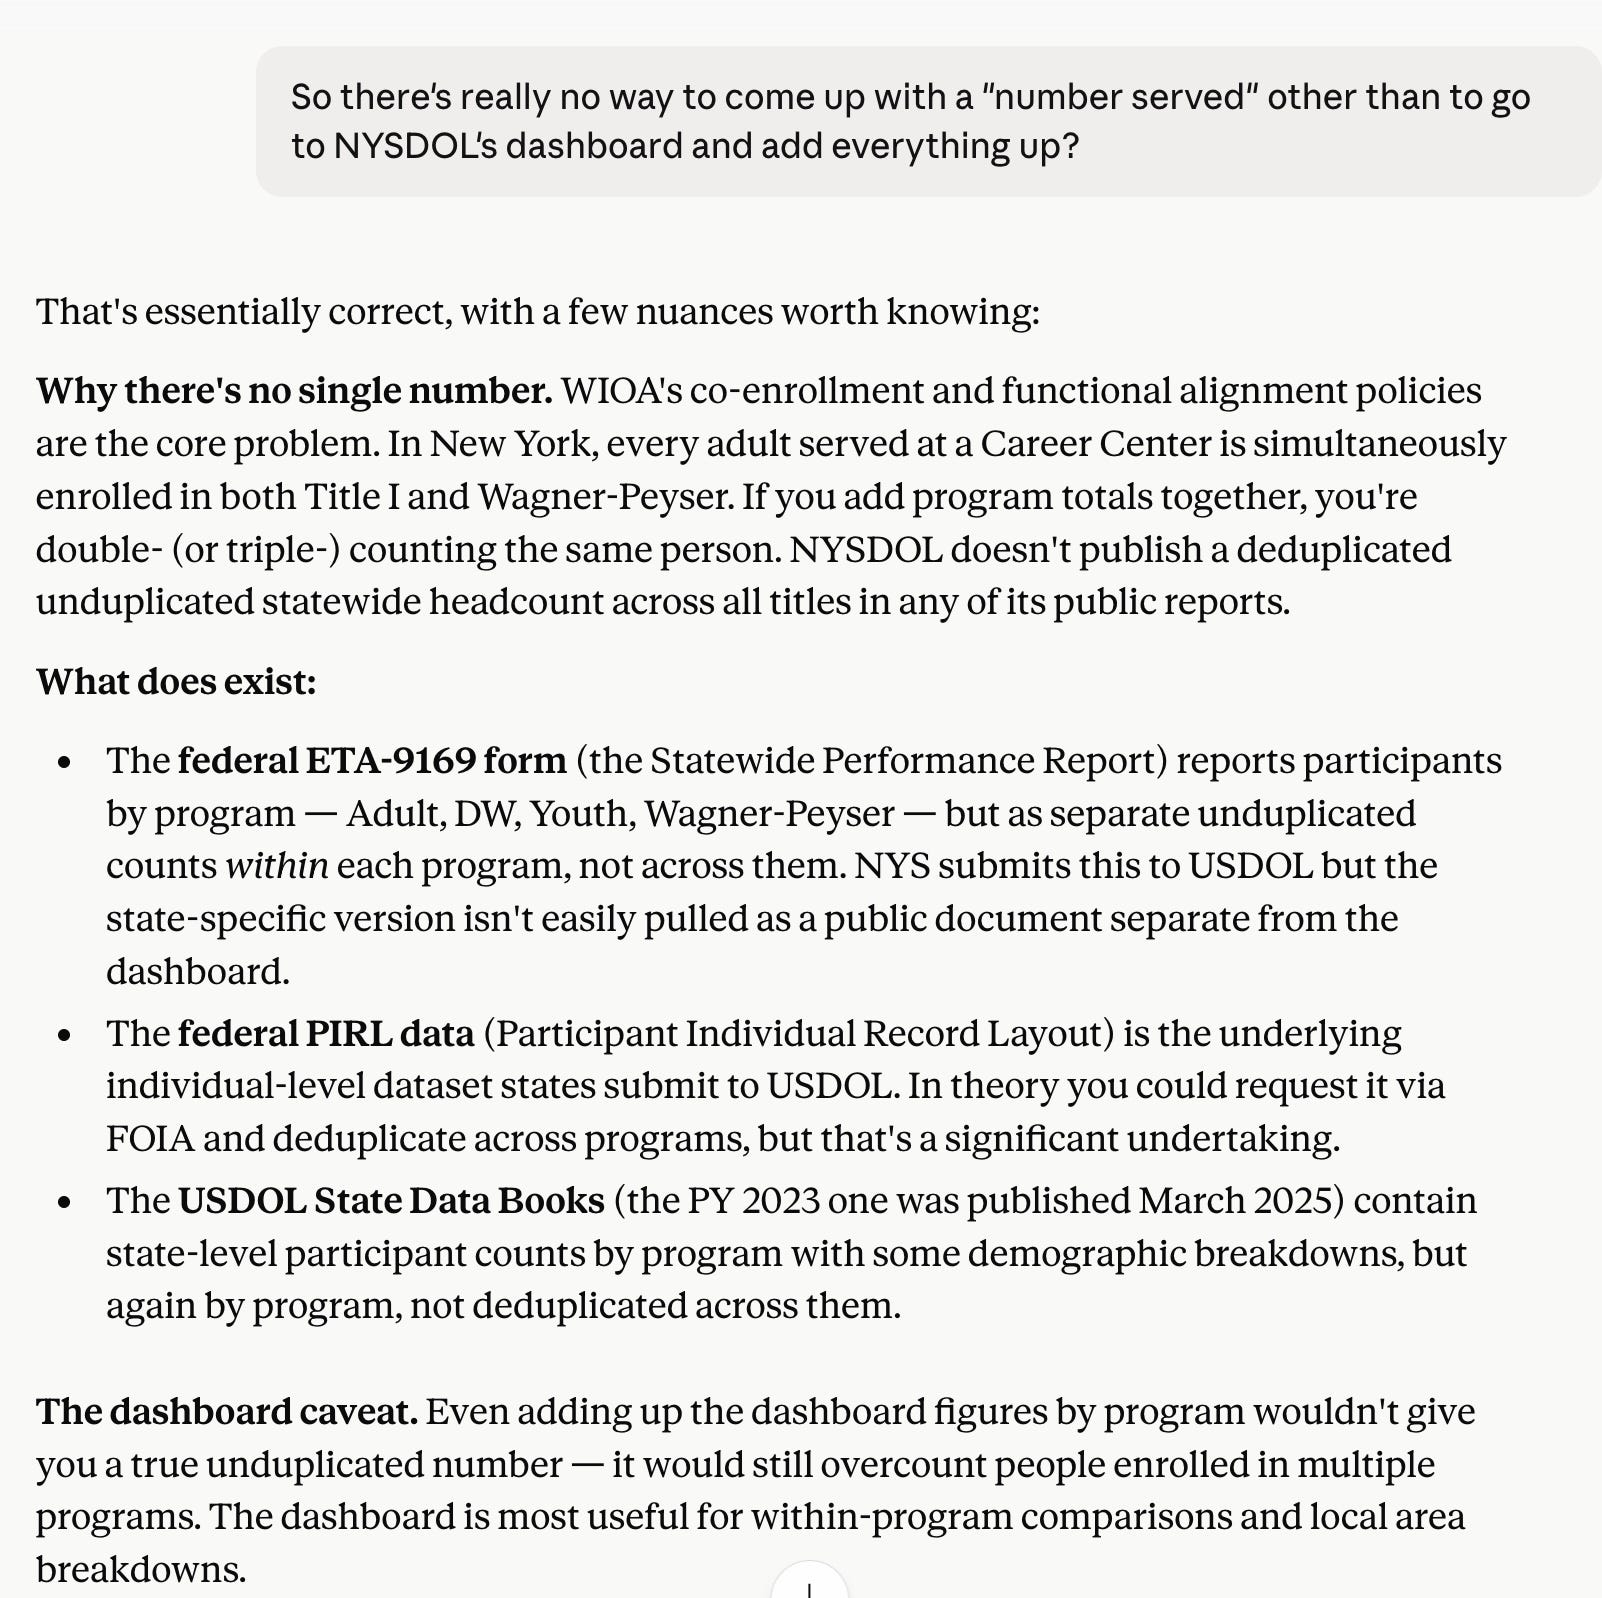
Well, fine, I thought. I can’t get a total statewide one-year participant count for all six WIOA titles. But surely I could get… something, just for the three Title I programs?
Nope.
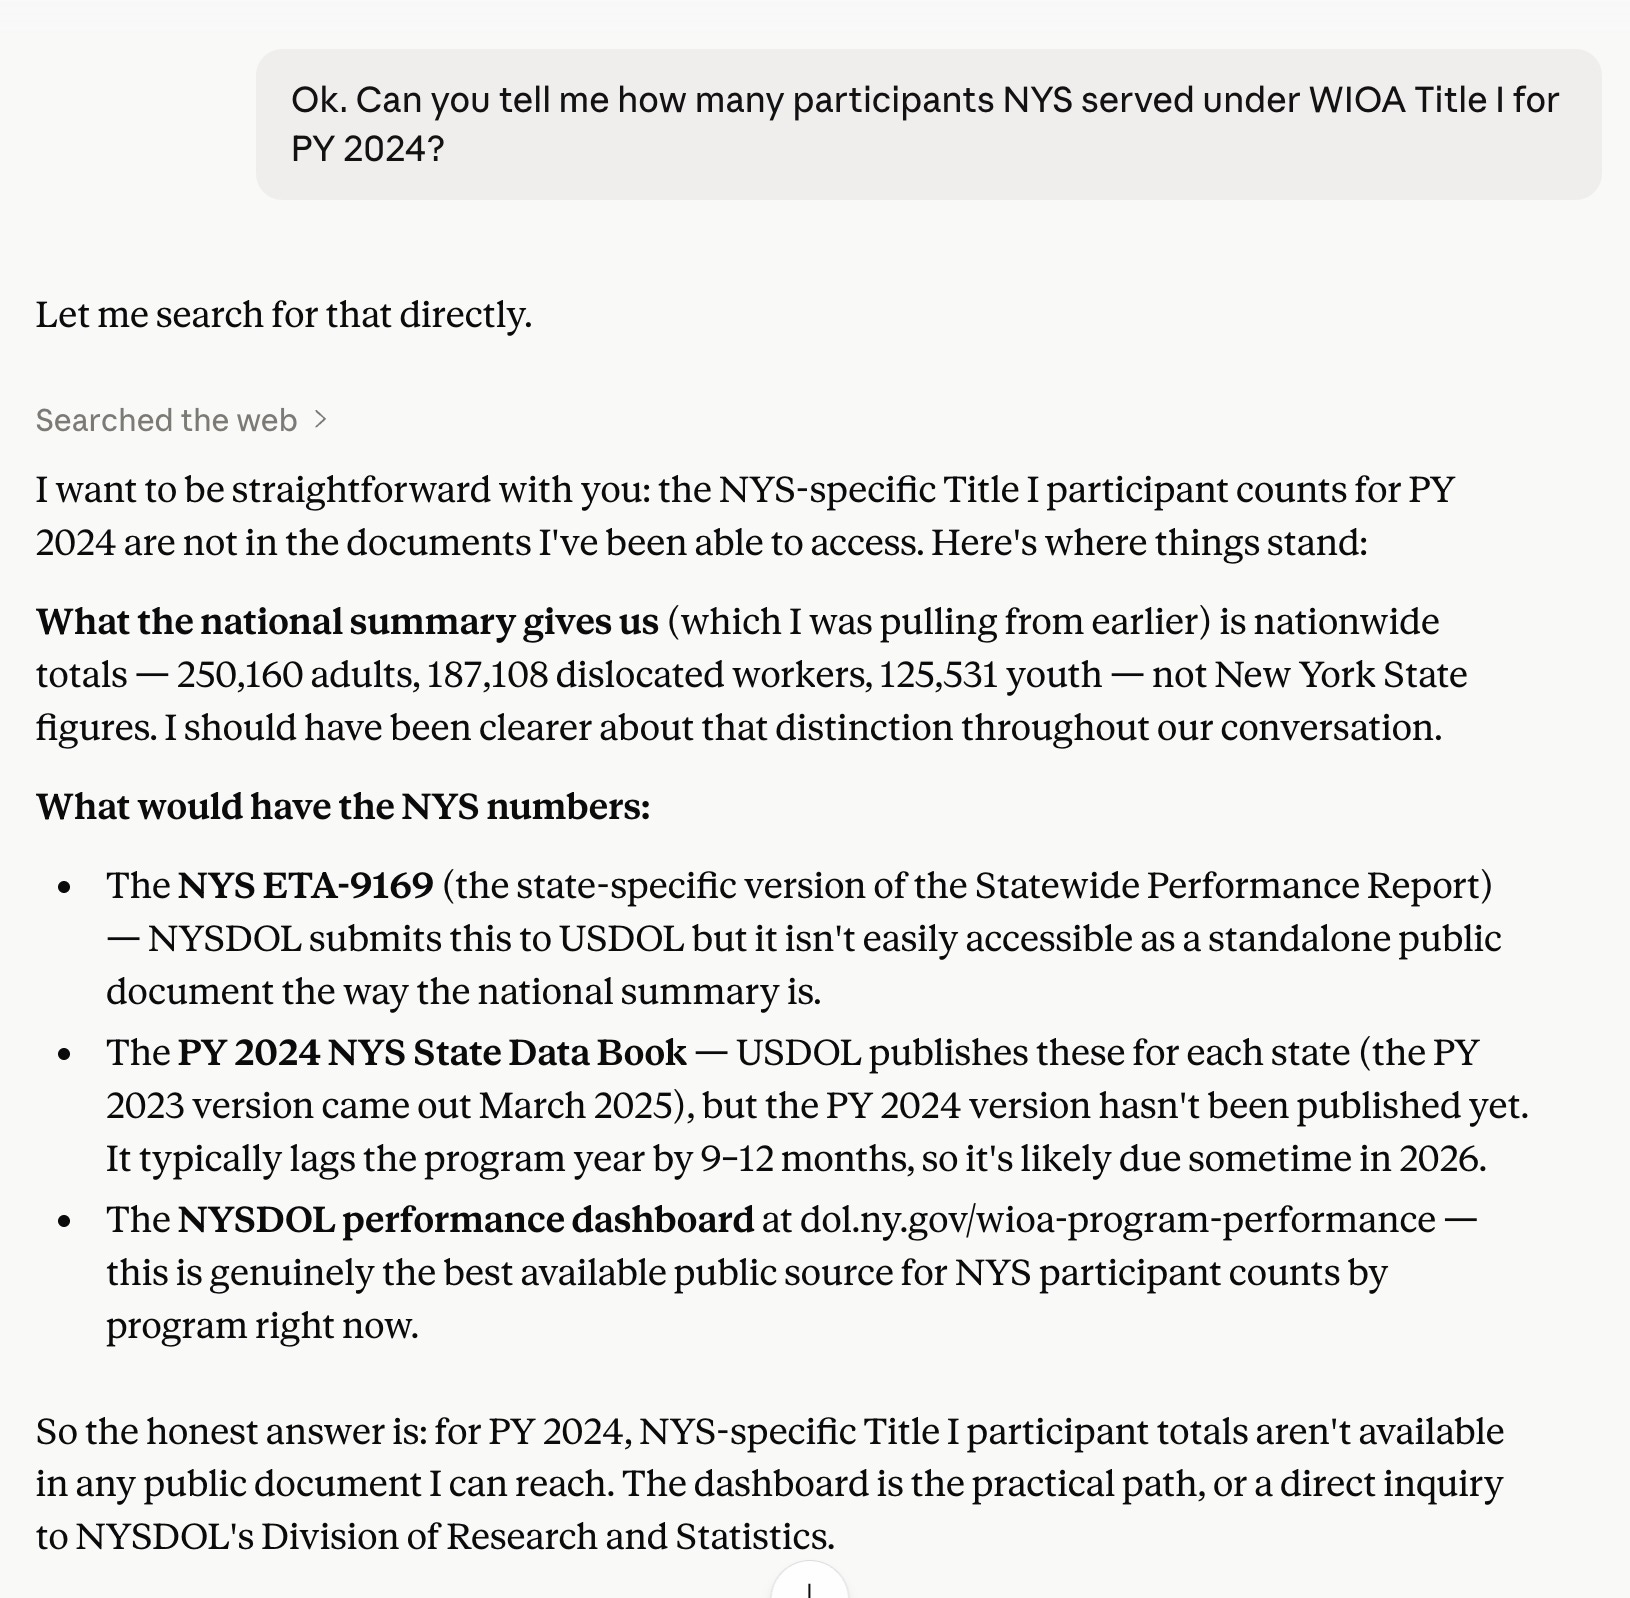
I find there’s a grim satisfaction when I ask Claude a question it’s unable to answer. I like that there are still, apparently, limits—until I think about it for a moment and realize that the limits aren’t intrinsic to the AI, but rather to the sources it can glean.4
I noticed in the above answer that those nationwide “participant” figures looked extraordinarily low. While $5 billion—the total federal WIOA allocation, more or less—is shockingly inadequate compared both to historical precedent and current need, it’s not nothing. Taken on its face, those numbers would suggest we served 562,799 people across the three categories (Adult, DW, Youth); divide $5 billion by that number and the per participant outlay would be $8,884.17, which seems quite robust… and which a conservative Congress would never tolerate.
But—and you probably know where this is going by now—it is an extremely small subset of total “participants.” It counts only individuals who received staff-assisted services through the WIOA-mandated Career Centers. By contrast, the number for the Wagner-Peyser Employment Service—Title III of WIOA—is 2.56 million.
The NYS Department of Labor reported two more statewide figures for PY 2024 that I temperature checked for relevance: about 196,000 Career Center appointments, and around 275,000 user satisfaction surveys sent out. Neither really work: the “appointment count” does not capture unique individuals (and, I think, might not capture how many appointments were kept), and the survey number includes both those sent to businesses (around 38,000) and methodological murk around who was sent a survey. It also got a very low response rate, suggesting additional challenges.
Ultimately, Claude concluded, “The true unduplicated headcount of New Yorkers who received any meaningful WIOA-funded service in PY 2024 is almost certainly in the hundreds of thousands—but that number simply isn’t published in a clean, citable form anywhere.”
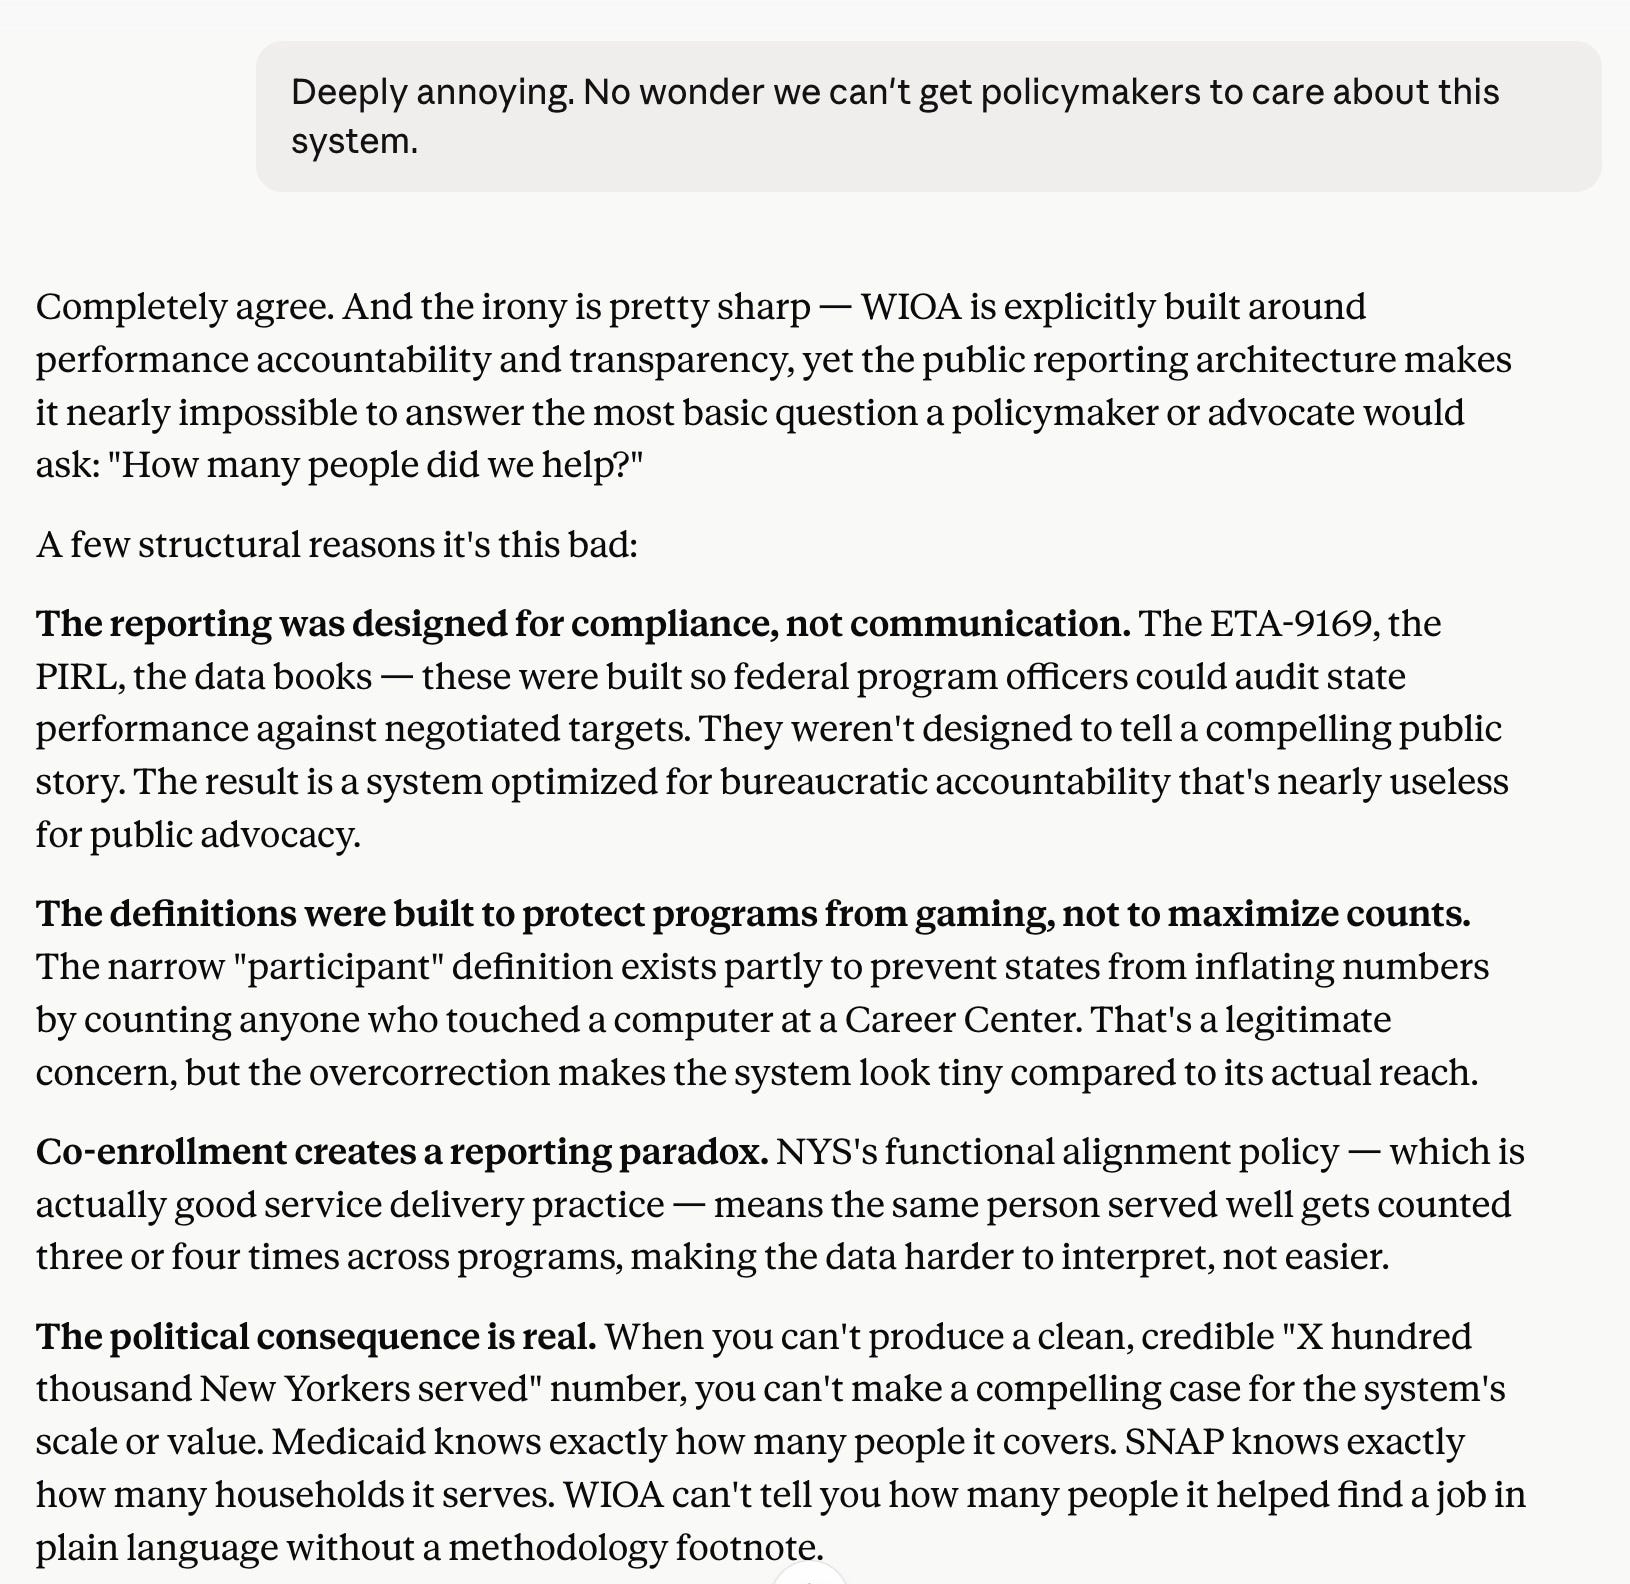
This seems like the final failure of a closed system. Call it “toxic compliance”: a regime that prioritizes preventing “waste and fraud” over serving workers and businesses. In this light, how can we be surprised that funding continues to spiral down, and that our work remains marginalized even as questions of employment become increasingly urgent?
This is actually making me (very slightly) more sympathetic to the administration and others who propose even deeper cuts: in the face of a law and set of programs that can’t articulate its value, the only rational responses are to fix it, zero it out, or effectively shrug at it by reauthorizing the status quo in hopes that it’s doing something helpful that we are simply failing to capture.
I honestly wonder how many workforce professionals, advocates, and administrators are aware of this fundamental obstacle to telling a high-level story about our work and its impact and value. As I’ve written in a different context (but also about WIOA), maybe it’s like criticizing water to a fish.
If your whole advocacy strategy is to try to communicate the human value of your services—stories of people in a given congressional district who get off public assistance and overcoming homelessness or addiction and carve out careers as medical assistants or customer service reps—then at best you’re going to stave off harm. But ultimately, without the capacity to answer basic questions—and ideally, more advanced ones like “do these services help people achieve long-term economic security—in the end, all you’ll have achieved is to lose more slowly.
I seem to be getting better at not anthropomorphizing the AI. It’s an it. At some point, if it goes all second-generation Cylon (and doesn’t kill me/us), I’ll happily readjust. I still do find myself saying thank you, paying it compliments, etc., but that just feels like practicing good manners, which I think humans generally should do.
In other words, WIOA Program Year 2024, the one I mostly used, ran from July 1, 2024 through June 30, 2025. This means that WIOA PY 2024 covers exactly the same period as New York State (and City) Fiscal Year 2025. Adding to the fun, Congressional funding of WIOA runs by the federal fiscal year, which runs from October 1 through the following September 30. So each year of funding runs across two program years.
The Title I numbers were from U.S. Department of Labor planning estimates, not the final obligated totals, but there’s no reason to think they aren’t close to the actual figures. Title II was detailed to the literal dollar: the state Education Department published that it received $44,918,244, plus another $1,843,000 in related state-originating funds.
One of the aspects I’m prouder of from that novel I wrote is that it posits the near-total dismantling of government’s data-gathering function between the start of the second Trump term and 2037-38, when most of the action takes place. The result is that not only elected officials but (the few remaining) policy analysts themselves increasingly are flying blind when it comes to serving their communities: there’s no way to count, and thus no way to assess, and the result is an expanding sense of helplessness which curdles into a kind of exhausted indifference. I wasn’t intentionally making reference to WIOA, but I might as well have been.
No posts
Comments
Nothing yet. Say the first thing.
Sign in to join the conversation.