
Crypto Super Hub — Weekly Market Intelligence | 21 June 2026
It was quiet on the desk again this week. Not panic-quiet. Bored-quiet. The phones don’t ring because nobody wants to think about Bitcoin at all.
That sounds like bad news. After enough cycles, you learn to read it as the opposite.
Bitcoin doesn’t always bottom on a single violent crash that washes everyone out in an afternoon. Sometimes it bottoms on exhaustion. A slow grind, sideways and down, until the last person who was going to give up finally has, and stopped looking at the chart.
There are two kinds of capitulation. Price capitulation is loud: the crash, the red candle, the headline. Time capitulation is silent, and it’s the harder one to sit through, because nothing tells you it’s over. You just slowly stop caring. The boredom does the work the crash usually does.
That second kind is what this feels like. And I’ve stopped fearing it, because it’s the stage that comes before the turn, not after. So this week I stopped trying to pick the exact low and went looking for something more useful: what the data actually does before a bottom arrives.
The CSH Score sits at 21.2 today, with Bitcoin around $64,200. On 7 June it dipped into the mid-teens at the $60,862 low, putting us in the bottom 7% of every reading since 2011. On a fifteen-year scale of cheap to expensive, we’re near the cheap end.
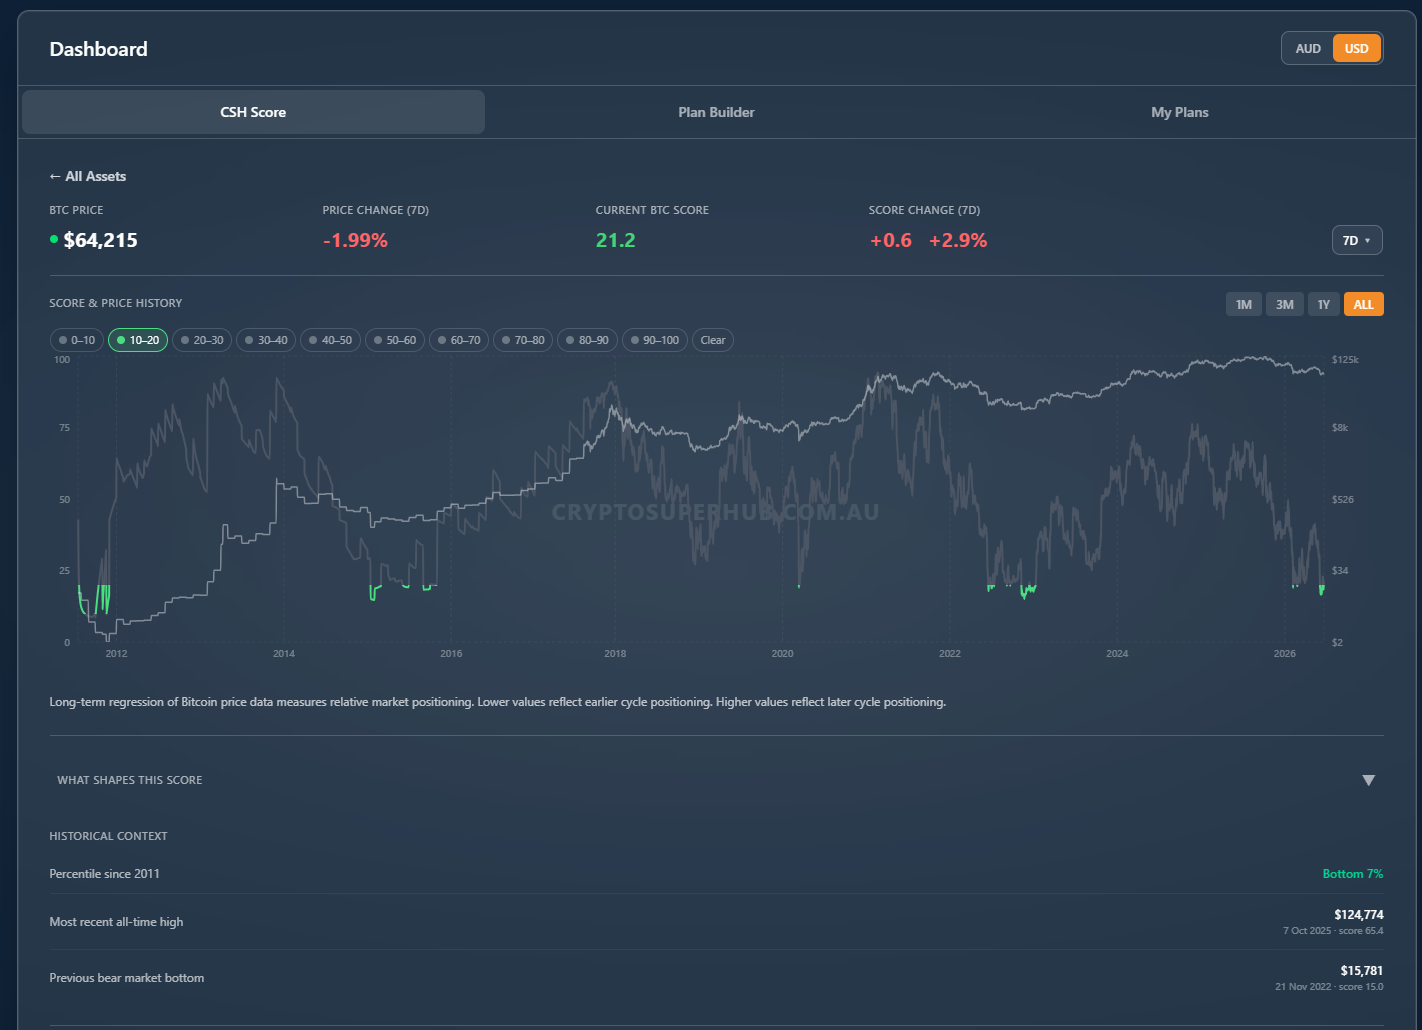
Here’s the part I only saw this week. Digging through our all-time chart, the one that lets you click any era and read what the Score said at the time, and I went hunting for one thing: where did the Score sit right before each bear market ended.
The pattern was cleaner than I expected. In four of the last five bears, the Score fell below 20 before the bottom was in. 2015 hit 15. The 2020 COVID crash hit 19. 2022 hit 15. The only exception in fifteen years was 2018, which bottomed without the Score ever leaving the high 20s.
This cycle has already been below 20. That doesn’t time the bottom, and I won’t pretend it does. It tells you which neighbourhood you’re standing in, and right now it isn’t the expensive one. That’s the whole job of a risk gauge. Not prophecy. Position.
For the curious, what’s driving the Score today: long-term price position is doing the heavy lifting at 19.8, short-term momentum at 25.8, sentiment at 23.0. All low. None screaming. A quietly cheap market, not a crashing one.
Half my inbox is some version of the same question: is this the bottom. I can’t answer it, and you should be wary of anyone who says they can.
So instead of an answer, here’s a system that doesn’t need one.
Start with the calendar. The second half of US midterm years (2014, 2018, 2022) has historically been one of the stronger windows to be buying Bitcoin on a schedule. We’re in one now. Pair that with a Score in its bottom decile and you don’t have a prediction, you have a starting point. A reason to buy steadily, on a schedule, without needing to nail the exact low.
Now the chart I keep coming back to, because it’s the heart of this issue and simpler than it sounds.
It’s the percentage of supply in profit versus in loss. Picture every coin in existence. For each one, ask: was it last bought above or below today’s price? Above, it’s “in profit.” Below, it’s “in loss.” Add it all up and you get two lines that map the mood of the whole market. When nearly everything’s in profit, people are complacent. When the loss line climbs and a big share of coins are underwater, that’s pain, and pain is what bottoms are made of.
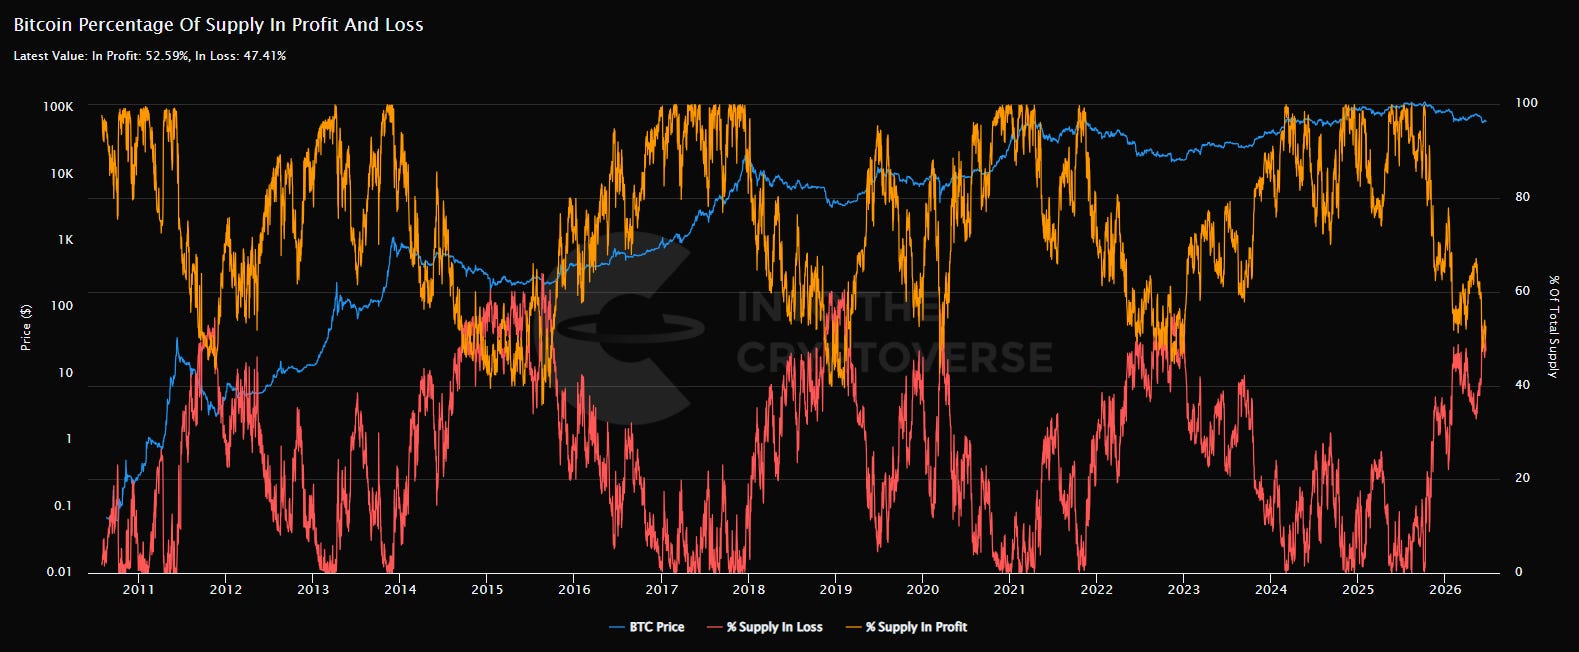
Here’s the history. At each of the last three bear bottoms, the loss line climbed above the profit line first, then the price low followed. But the gap between the cross and the low was different every time, and naming those gaps is the honest way to use this:
2015: the lines crossed in January, and the low landed within days.
2018: they crossed during the November capitulation, and Bitcoin bottomed on 15 December, around three to four weeks later.
2022: they first crossed mid-year after the spring crash, and the low didn’t arrive until 21 November. Roughly five months.
So the same setup has resolved anywhere from days to five months out. The cross is a precondition, not a starting gun. Right now the lines read 52.6% in profit, 47.4% in loss, churning around the halfway mark, the zone they pass through before a bottom forms. We’re in the right part of the story. We’re not necessarily on the last page.
Which is why I’ve stopped trying to be right about the low and started being consistent about the buy. When this cycle’s in the rear-view, it’ll matter far more that I kept accumulating through the boring part than whether I called the day. Nobody rings a bell. The schedule is the bell.
Most of my spare hours this week went into refining that all-time chart and digging through what it shows. The idea was simple: stop asking people to trust the number and let them check it instead. Click back to any point since 2011 and see what the Score read at the time. Every top. Every bottom. Mark our homework yourself.
But with the whole fifteen-year history open, a second chart caught my eye, and it’s the uncomfortable one. I’d be doing you a disservice to leave it out just because it doesn’t fit the bullish story.
It’s the Terminal Price model, and what matters is two reference lines. The Realized Price is roughly what the whole market actually paid for its coins, the market’s cost basis. Below it sits the Balanced Price, a deeper fair-value line. The pattern: in every previous bear, price didn’t just dip toward these lines, it sliced through the Realized Price and wicked down toward the Balanced Price before the selling was done. That’s what a full detox has looked like every time.
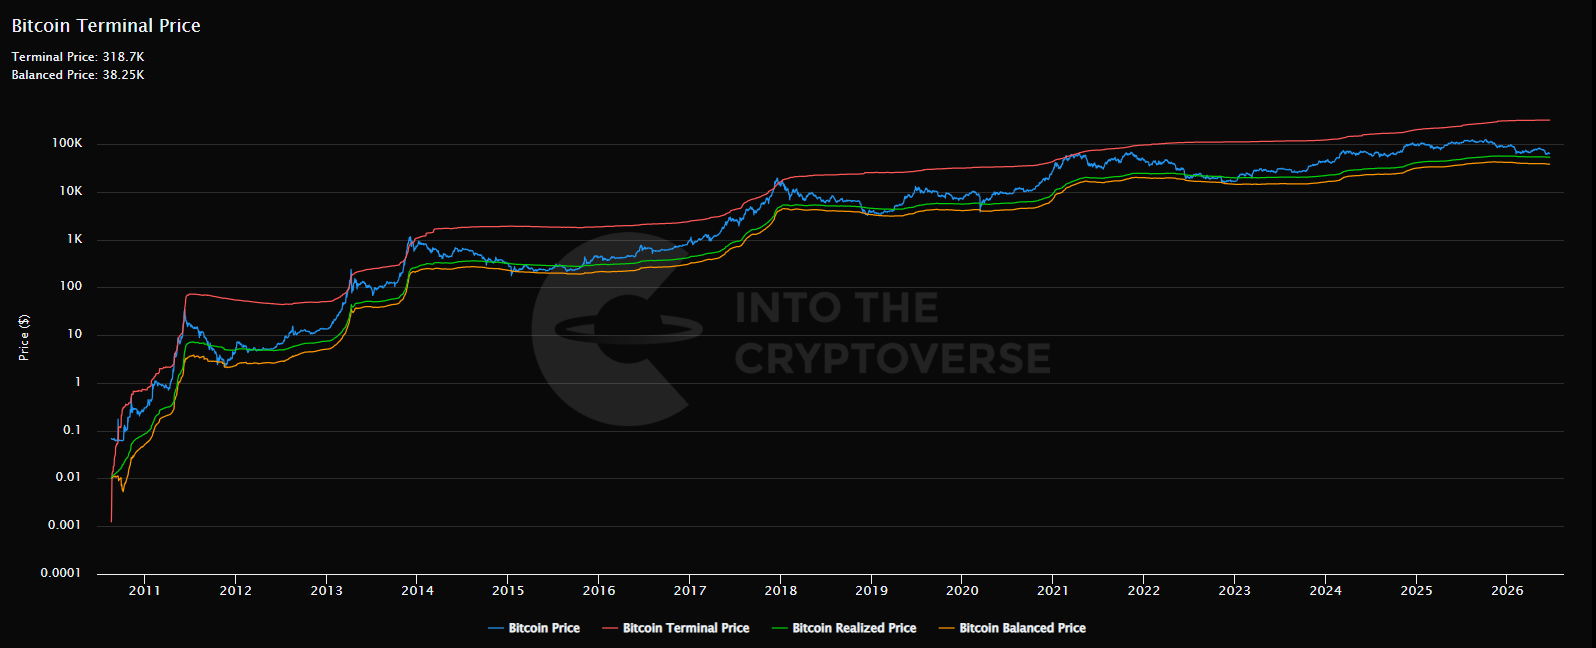
Today, Realized sits around $53K, Balanced near $38K, and Bitcoin at roughly $64K. We haven’t even touched the first line, let alone the second. If this cycle rhymes with the last three, there’s a path into the low $40s before it’s genuinely over.
So here’s where I stand, both things at once. My base case is constructive: the Score’s in the bottom 7%, the seasonal window is favourable, and I’m still accumulating with conviction. But I’d rather show you the bearish read I can’t rule out than sell you a floor I can’t promise. A system that only works if the number goes up isn’t a system. It’s a hope with a logo.
One more thing, quietly. A few of the people testing the chart have started asking how to get the full version. It’s coming. More on that in the weeks ahead.
The Score hit its lowest since the last bear bottom. It touched the mid-teens at the 7 June low of $60,862, the cheapest reading on our gauge since 2022.
The market is split roughly 50/50 underwater. Supply in profit/loss reads 52.6% / 47.4%, the lines churning in the zone they’ve crossed before past bottoms.
The US and Iran signed a ceasefire framework, and for us it’s an oil story. It’s a 60-day memorandum to negotiate, signed 17 June, not a done deal, and already strained. The angle that matters here: a calmer Strait of Hormuz means easier oil, and oil has been the main thing feeding the inflation that keeps the Fed hawkish. Less oil pressure, more room for risk assets to breathe. Worth watching, not banking on.
Kevin Warsh ran his first Fed meeting, and the style change is the story. Rates held at 3.50 to 3.75% on 17 June. The shift was how he communicates: forward guidance dropped, no rate projection of his own, the statement cut to 130 words. Markets sold off after. His line is that markets “perform best when they react to incoming data,” which means less hand-holding and sharper moves both ways. A less predictable Fed is a choppier ride for everything, Bitcoin included.
Division 296, the $3M super tax, becomes law on 1 July. The threshold is per person, so a couple can hold up to $6M across two balances before it bites. Relevant for anyone weighing Bitcoin inside an SMSF.
A lot of smart people are circling October, twelve months on from the October 2025 top, as the seasonal window for a low. I lean that way too. But markets owe us nothing, and a macro shock could force the loud kind of capitulation before the slow kind finishes. What I’m watching:
A new Fed chair finding his feet. Warsh will guide the market less and let the data talk more. Expect sharper reactions to each inflation and jobs print while everyone learns his style.
Whether the Iran ceasefire holds. A fragile 60-day framework, not peace. If the Strait of Hormuz genuinely calms, oil eases and so does inflation pressure. If it breaks, the opposite. The macro swing factor for the next two months.
Seasonality, honestly. September has historically been the weakest month for equities, though that softens when the trend going in is healthy. Worth knowing, not worth fearing.
Whether the IPO froth cools. SpaceX just completed the largest listing ever, with Anthropic and OpenAI lined up behind it. A wobble in that enthusiasm tends to spill into crypto risk appetite.
None of these are forecasts. They’re the cracks worth watching while you keep executing your plan.
Boredom isn’t the enemy. It’s the toll you pay on the way to the other side. The people who build a plan during the quiet don’t have to make decisions during the noise.
The whole issue in three lines: the data says we’re in the right neighbourhood, one honest model says we might still have lower to go, and neither changes what you actually do. Keep buying the plan. Stop trying to be right about the day.
Build the plan. Run it. Let the boredom do its work.
— Jake
No posts
Comments
Nothing yet. Say the first thing.
Sign in to join the conversation.