
In Part 1 I introduced a selection of the most important and useful NumPy statistical methods. In this article I will look at the histogram method which returns the frequencies of ranges of data, each range being termed a “bin”. This might seem simple and straightforward but the whole topic of histograms is huge and complex so I can really only scratch the surface here. However, the NumPy histogram method has a few options which can make it more useful and versatile.
The code for this article lives in a file called nphistdata.py which you will find in the GitHub repository. The code needs NumPy to be installed and you might like to read my NumPy Reference if you are new to the topic.
This is the whole of nphistdata.py.
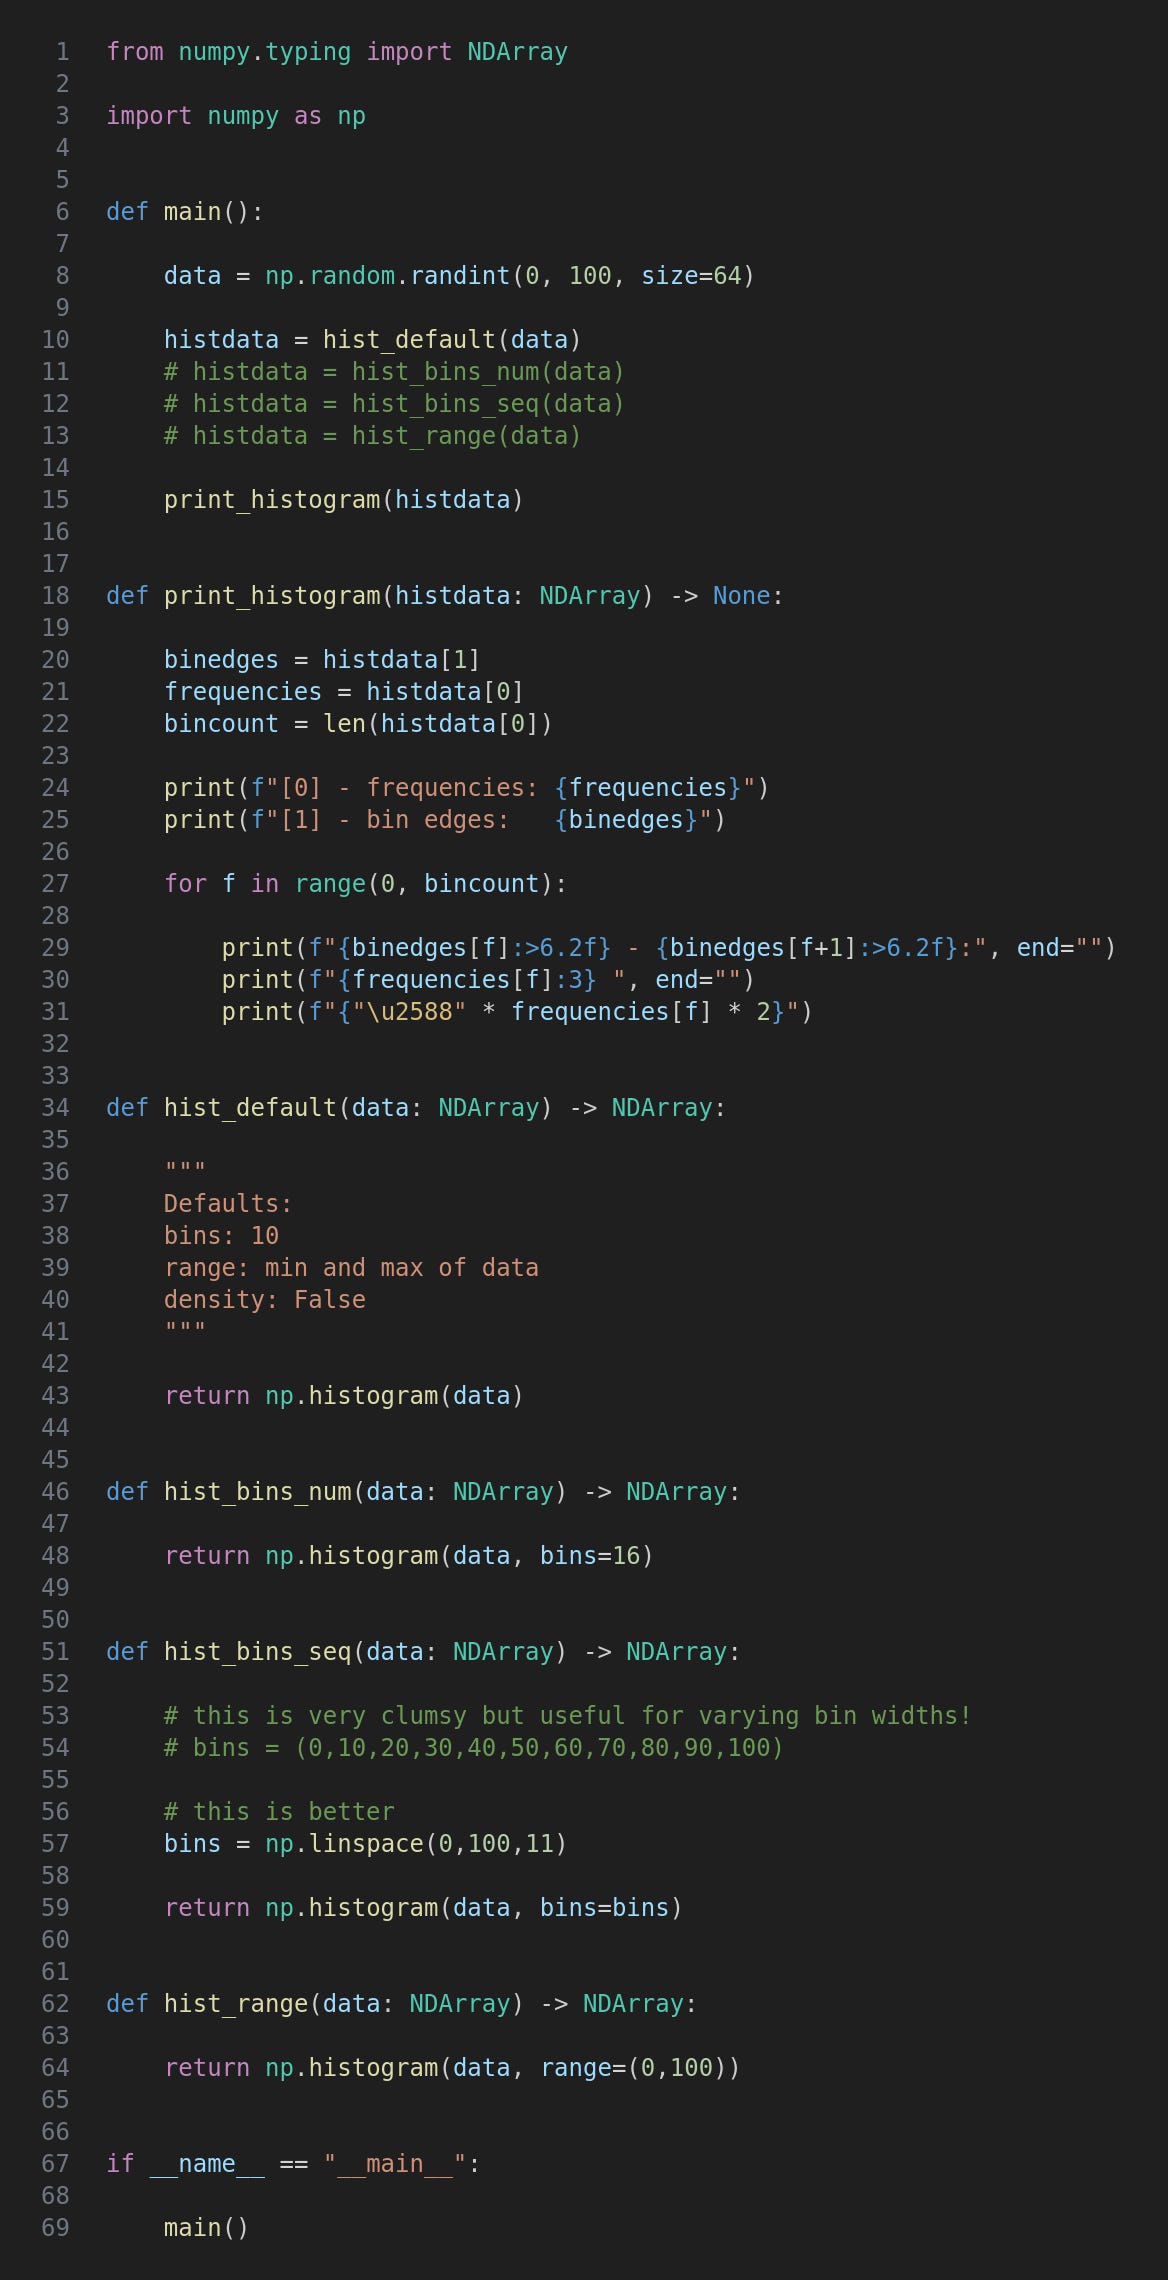
Firstly a NumPy array of random data is created which is then passed to one of the four functions which use the NumPy histogram method in various ways. The return value is then passed to print_histogram which I’ll describe next.
The results of the NumPy histogram method are passed to this function as the histdata argument. It contains two arrays, the first being the frequencies and the second being the bin edges, ie. the minimum and maximum values for each bin. At the start of this function I have assigned these to separate variables simply because this makes any subsequent code using them more readable. I have also picked up the number of bins as bincount from the length of the frequencies array; note that the bin edges array has an extra value.
Next we print the frequencies and edges as raw data before iterating the results to print them in a more user friendly format. Each frequency has its own line showing the bin edges, the bin frequency and a very primitive histogram consisting of solid characters. (This is sufficient as a demo but is not a general solution as real world data could easily use up the entire width of the terminal.)
This is a simple one-liner which uses the histogram method’s defaults which are shown in the docstring.
Run the code with this terminal command.
python3 nphistdata.py
This is the output using hist_default function; the data is random so yours will be different.
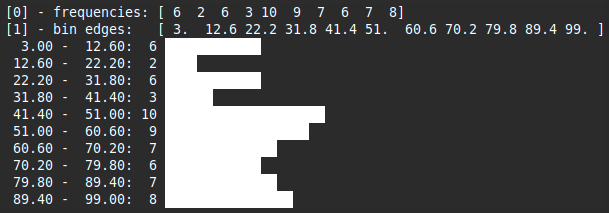
Using the min and max data values as the lowest and highest bin edges gives results which are pretty scrappy but as we’ll see it is easy to customise these into something more sensible.
The number of bins defaults to 10 irrespective of the data. This is a sensible enough default which is acceptable much of the time but we can pass a different value as the bins argument as I have done here. If you uncomment the call to hist_bins_num in main and run the program again you’ll get something like this.
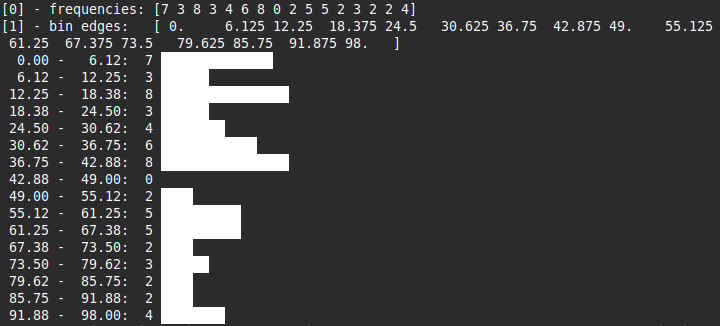
Having 16 bins isn’t ideal for this particular data so in the next two sections I’ll show how to set the edges precisely.
In this function I have set the bins argument to a sequence. This can be hard-coded as in the commented out code and this is useful if you need bins of varying widths. However, using the NumPy linspace method is simpler if you need fixed width bins between certain min and max values. Remember that you need one more value than the required number of bins.
We have now solved the problem of inconvenient bin sizes but the sequences may still need to be changed for specific data sets if you write code that uses a variety of data sources. Running this function produces something like this.
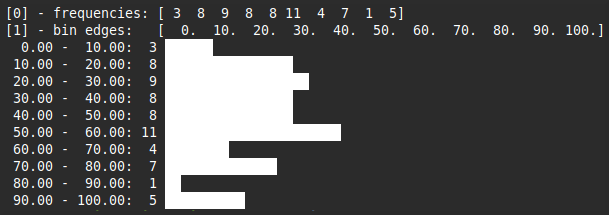
The random data I have used for this article could be percentage data in which case you are likely to want the bin edges to be between 0 and 100, probably with nice neat intermediate edges every 10%, 20% or whatever. The best way of handling this is to hard code the range, possibly also hard coding a bin count if you don’t want the default value of 10.
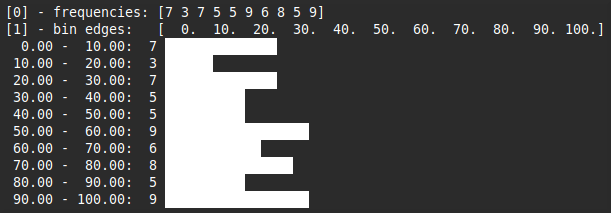
Here is the result of setting the range to between 0 and 100.
There are a couple of important options in the histogram method which I haven’t covered here as they deserve their own dedicated articles. They are:
A bins string argument specifying a method used to determine the number of bins
Obtaining probability densities rather than frequencies
For updates and random ramblings please follow me on Bluesky.
No AI was used in creating the code, text or images in this article.
Comments
Nothing yet. Say the first thing.
Sign in to join the conversation.