

Martin Buchheit is many things: scientist, coach, performance director, serial self-experimenter. And now, officially, guinea pig.
Our latest paper in Sport Performance & Science Reports is a case report. The subject? A 47-year-old male, 182 cm, 80 kg, marathon prep meets recreational padel. That subject is Martin. Strapping himself to a neuromuscular assessment device across nine different training modalities spanning the full HIIT Science taxonomy is probably the most direct validation of a framework we’ve been building together since 2013.
I’m not going to pretend to be unbiased here. We co-wrote the original two-part Sports Medicine review. We wrote the textbook. So take this for what it is: a proud co-author, genuinely excited by what the data actually shows.
When Martin and I published the HIIT Science classification back in 2013, we split training types by their aerobic, anaerobic, and neuromuscular demands. Types 1 through 6 (see Figure 1).
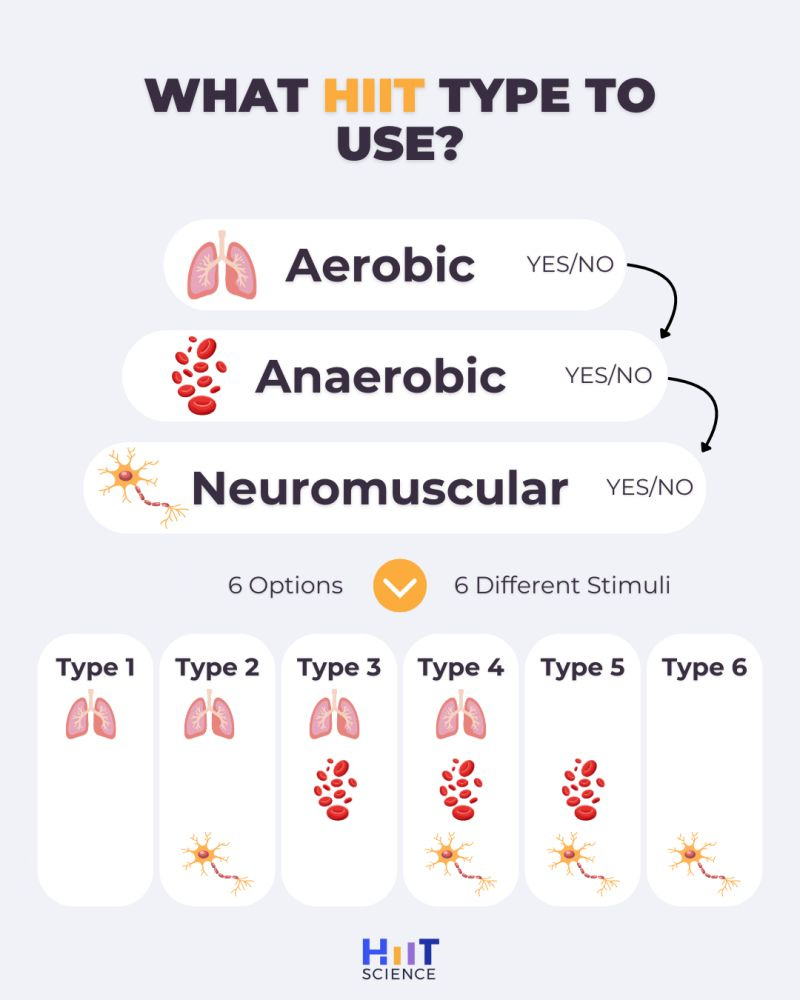
The metabolic side had decent support: VO2 kinetics, heart rate data, lactate, all reasonably well-characterised. The neuromuscular side was always the weakest link. We knew the load was there. We could reason from first principles about acceleration density, eccentric stress, change-of-direction demands. But objective biological evidence of the neuromuscular response? We were inferring. Educated guessing, really.
That’s what this paper fixes.
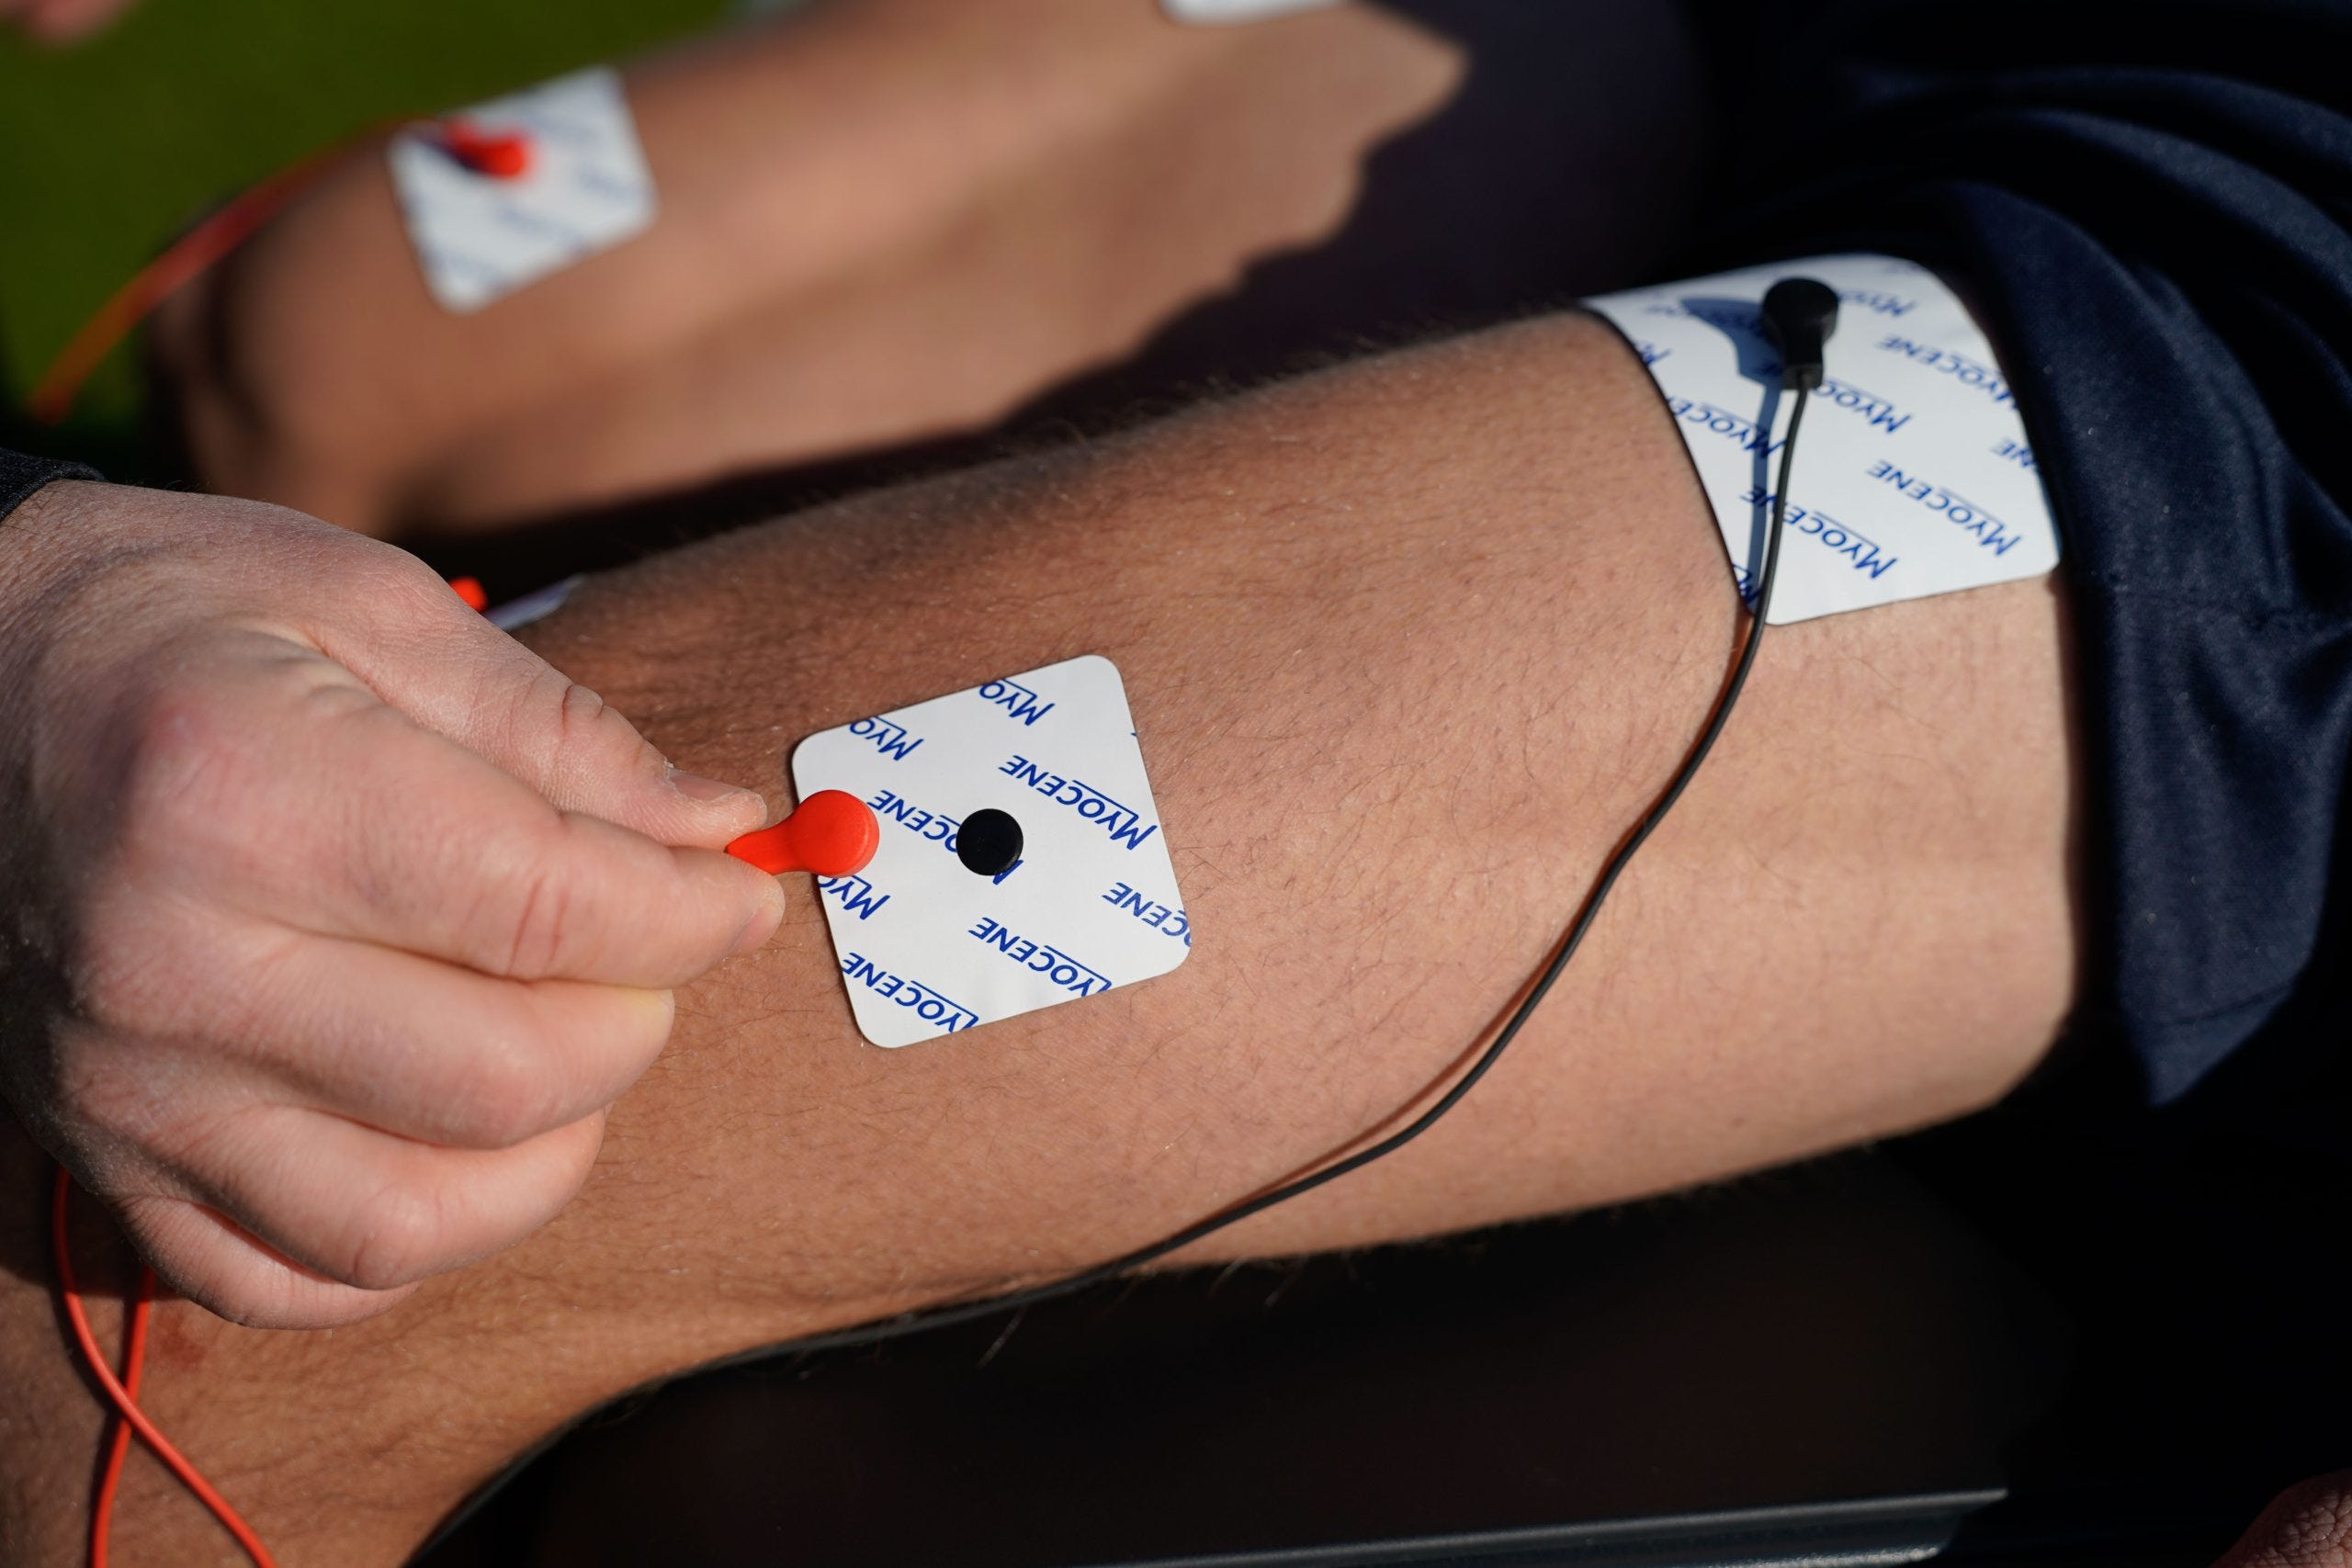
He used a device called Myocene, a portable electrical stimulation system that measures low-frequency fatigue (LFF) in the quadriceps without requiring any maximal effort from the athlete (Figure 2). You sit to contract, it stimulates at high frequency then low frequency, and the ratio between the two force responses gives you a fatigue index called Powerdex. When the muscle is fresh, the low-frequency response is roughly 70-80% of the high-frequency response. When you’re smashed, that drops to 60% or lower. No maximal intent required. You can’t fake it.
Martin measured himself before and after nearly every type of HIIT session (immediately post, then out to 48 hours) across Zone 2 runs, a sauna bike, small-sided football games, short HIIT (15s:15s), RSA sprints with change of direction, Wingate-style cycling SIT, and a gym session with resisted accelerations. Nine sessions spanning the HIIT Types (Figure 1). Nine recovery curves.
The HIIT taxonomy predicted the ordering. The data confirmed it (Figure 3).
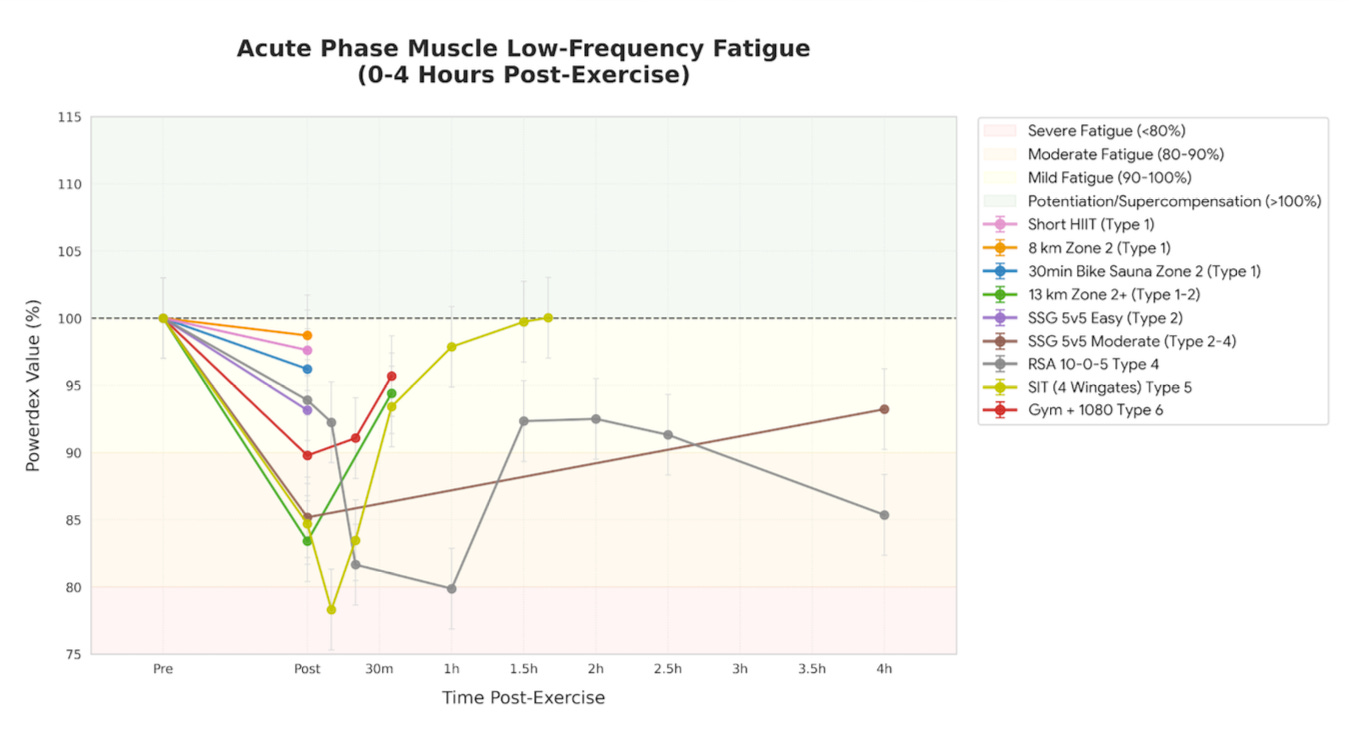
Type 1 work (Zone 2 runs, the sauna bike) didn’t move the needle. Powerdex stayed within the 3% measurement noise threshold. No real LFF. This includes short HIIT (15:15 at 90% vIFT), which people often assume is hard on the legs. Metabolically demanding, yes. Neuromuscularly? Barely a scratch. That’s exactly what the taxonomy predicted.
Type 5 and Type 4 were a different story. Four Wingates dropped Powerdex below 80%. Severe fatigue territory. RSA sprints with changes of direction did the same. At the cellular level, this reflects impaired excitation-contraction coupling: inorganic phosphate accumulating in the sarcoplasmic reticulum, reducing Ca2+ release and troponin sensitivity. The muscle can’t generate force at low stimulation frequencies even when central drive is fine.
The recovery curves are where it gets interesting for programmers (Figure 4).
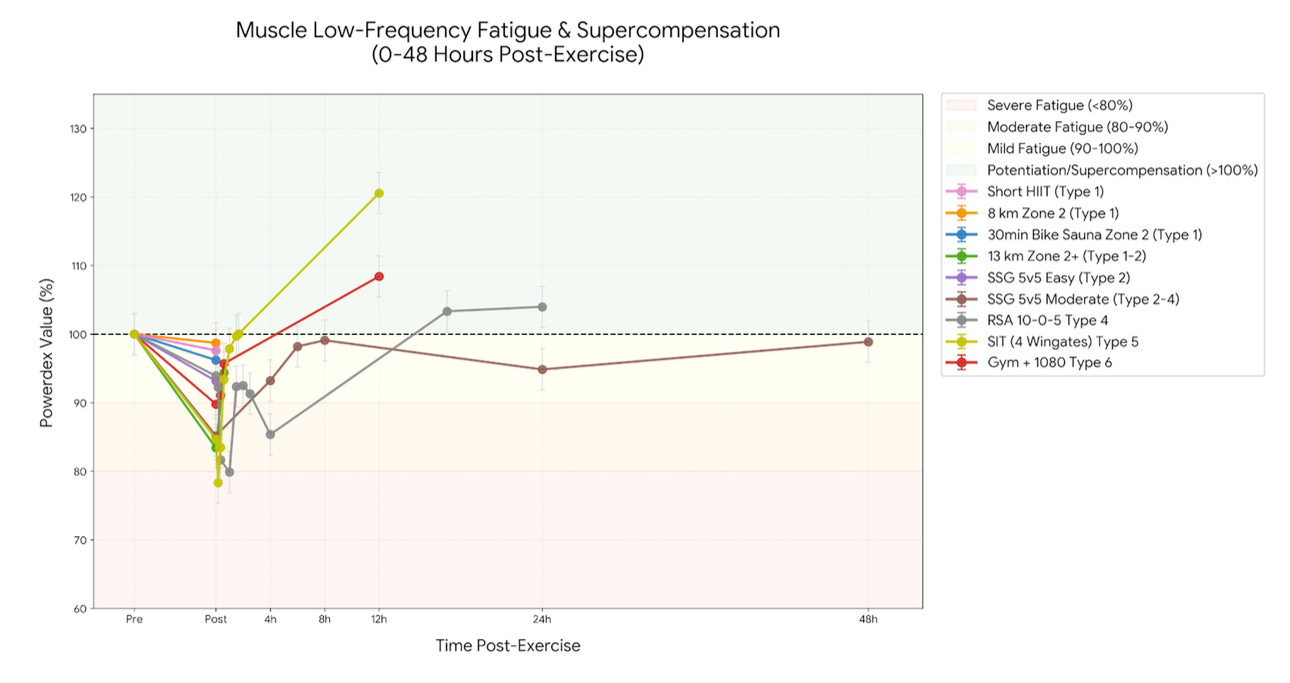
After the Wingates (pure concentric, no eccentric component), Powerdex rebounded to 121% of baseline by 12 hours. The gym session with complete rest between sets hit 108%. RSA with change of direction and SSG moderate took 24-48 hours just to return to baseline. No supercompensation. Just a long tail.
The difference comes down to eccentric loading combined with metabolic stress. The deceleration-heavy, multi-directional sessions leave structural damage that requires time to resolve. Concentric-dominant sessions clear the metabolite-driven E-C coupling impairment quickly, and the contractile apparatus rebounds.
Martin mentioned this on our podcast: he’s been doing short cycling SIT efforts two days before marathons for years, knowing it made his legs feel better. He just didn’t have the data to explain why until now.
For coaches without access to a Myocene, this is the part that matters most.
The correlation between acute Powerdex drop and Neuromuscular RPE (perceived muscle heaviness, rated separately from overall session RPE) came out at r = -0.89. Global RPE was r = -0.68. Time above 85% HRmax was r = -0.55. Time above 75% HRmax was r = 0.04. Basically useless for predicting neuromuscular cost.
So: if your athlete is in good communication with their body, their perception of muscle heaviness after a session is your best available proxy for neuromuscular contractile cost. Better than heart rate zones. Better than overall RPE. Not a replacement for objective measurement, but a genuinely strong signal.
Ask your athletes how their legs feel, specifically. Not “how hard was the session?” That conflates metabolic, cardiac, and psychological effort. Ask about the legs. The sauna bike in this study drove global RPE to 7 with neuromuscular RPE only 2, precisely because the cardiovascular demand was high but the quad contractility was untouched.
The case report frames it around a masters athlete doing concurrent training. But the logic applies to all of us programming training sessions across a week.
If Powerdex is >6% below an athlete’s rolling baseline, or an athlete is reporting heavy legs when they show up to train, the contractile apparatus hasn’t recovered. Loading a strength or power session on top of that doesn’t just reduce the quality of that session. It actively reduces effectiveness of the session. The residual fatigue adds injury risk to your planning with reduced chance you’ll achieve the adaptations you’re trying to drive.
The sequencing principles that fall out of this data:
Type 1 work costs almost nothing neuromuscularly. It’s your tool for maintaining aerobic volume when the legs aren’t ready for more.
Type 4 and 5 sessions (RSA, moderate-to-high density SSG) requires a deliberate 48-hour window before the next high-intent neuromuscular session. There’s no shortcut through the eccentric-neuromuscular tax.
None of this is brand new as coaching intuition. What’s new is the objective evidence that these intuitions were correct.
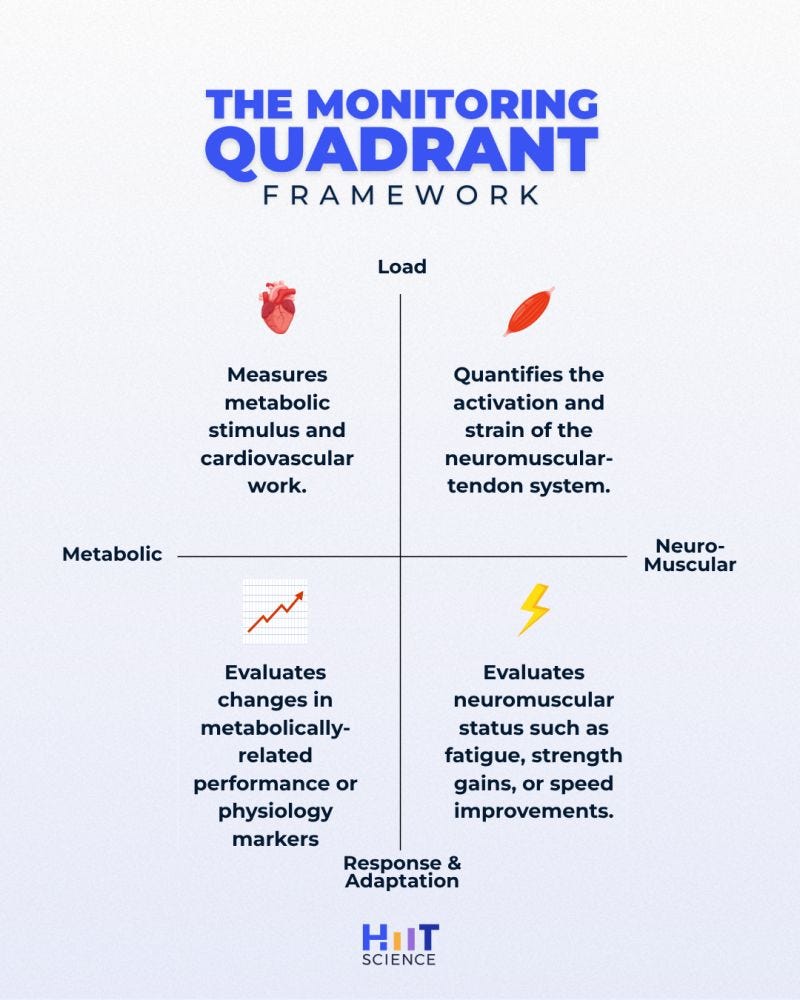
Martin has rebuilt his 2018 HIIT Science load and response monitoring course around this data. His new course covers the full four-quadrant framework (metabolic and neuromuscular, load and response) with the LFF work now integrated as the most recent applied evidence for the neuromuscular side (Figure 5).
If you’re a sport scientist, S&C coach, or performance practitioner working in any environment where training load decisions matter, this is the most organised and honest account of what we actually know and don’t know about monitoring that I’ve come across. Martin spent 15 years at PSG, Lille, Lyon, and Aspire building these systems in real environments with real constraints. The course reflects that.
Monitoring Load and Response in Elite Football
The paper itself is free and open-access at Sport Performance & Science Reports.
I’ve been co-authoring with Martin for over 25 years. I’ll admit a bias. But watching a framework we built on logic and physiology get confirmed in objective contractile data, in the person who helped build it. That’s a good day.
The neuromuscular variable always was the most important one to understand. We just finally have the tools to see it.
Listen to the full conversation with Martin on the Training Science Podcast.
Comments
Nothing yet. Say the first thing.
Sign in to join the conversation.