
It has been a while since I looked at deaths in Germany. Now that figures for the 2024/2025 season are in (a season running from July to June), I will check again. Main sources are:
year-end population of Germany by age from destatis table 12411-0013 (preferable to 12411-0005 because age stratification extends to 90 years)
deaths by age group per month and calendar week from the destatis special report
incidence rates for respiratory infection (ARE) and influenza-like illness (ILI) from the RKI’s GrippeWeb surveillance system
Let’s start with monthly data. The following diagram shows all seasons from 2000/2001 until 2024/2025. The dashed red curve corresponds to
total number of deaths in that month
divided by total population in that month (in order to get a death rate; I interpolated between the year-end population figures, which introduces a bit of local error I declare acceptable)
divided by the number of days in the month (in order to make the months comparable).
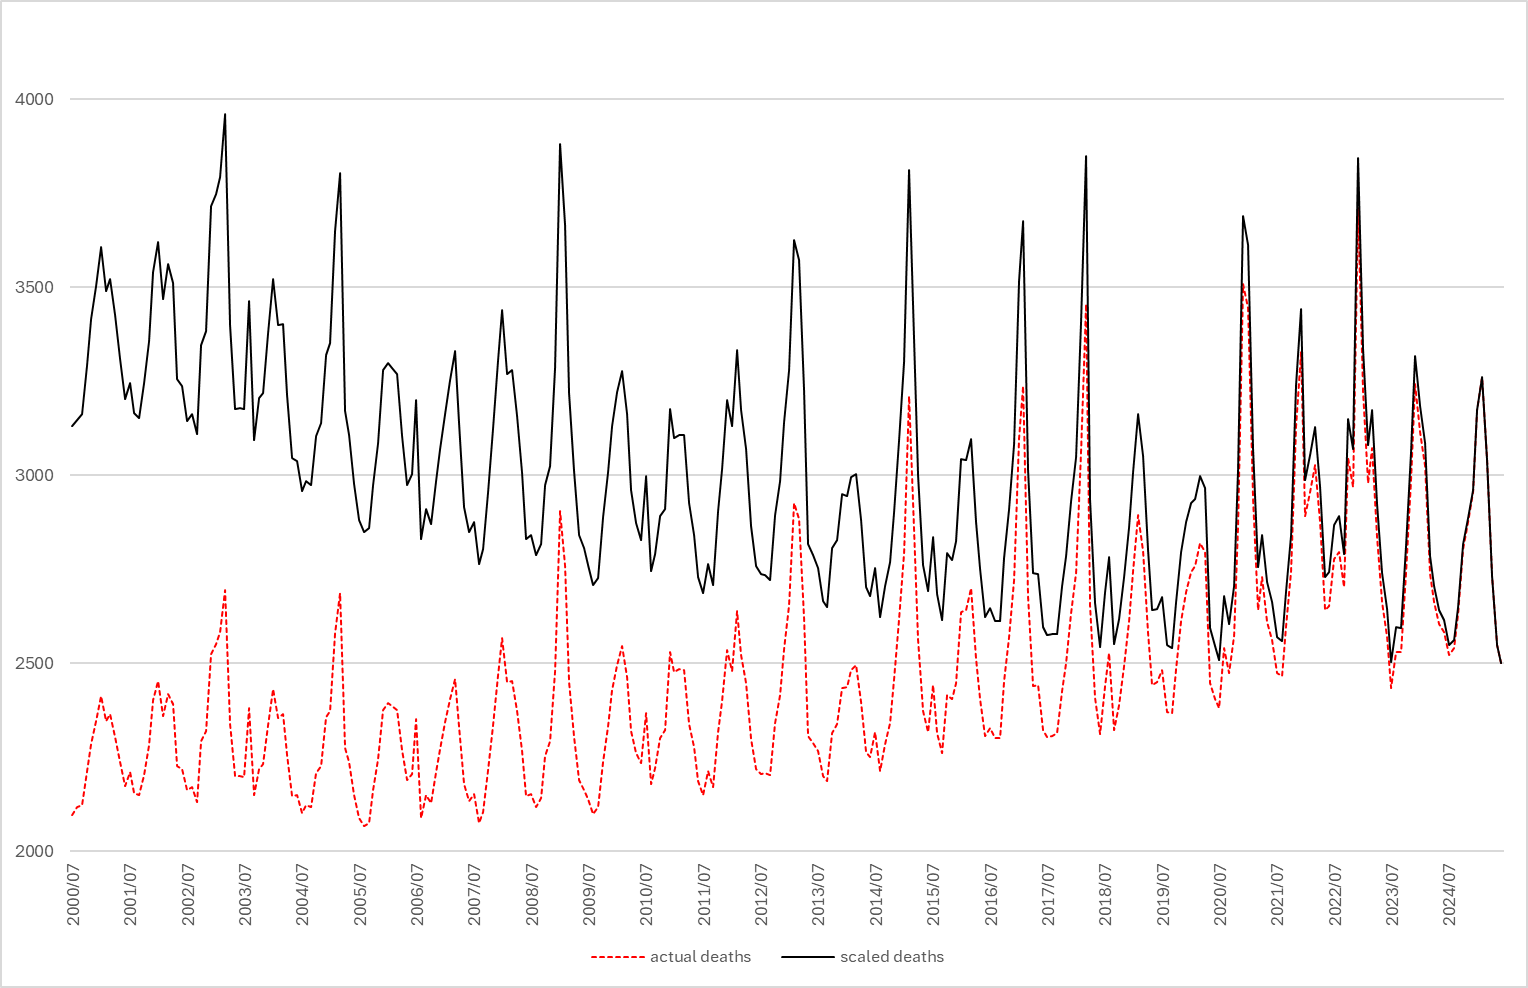
That dashed red curve seems to indicate rising death rates but that is misleading because the age structure of the population has been changing a lot. The solid black curve aims to repair this effect. For this curve, I took the population structure as of 2024/12/31 as reference point, applied death rates by age group to this population, and summed up.
So, in fact, when gauged to a fixed reference population death rates have mostly been going down - for whatever reasons: maybe advances in medicine, maybe people eating healthier food, maybe people smoking less, maybe climate change... Spikes caused by influenza, however, seem to persist at a certain height. The year 2022 is a curious exception (as noticed previously, and as to be discussed in the following) but things seem to have gone back to normal since then.
The above diagram may be a bit hard to decipher. I therefore re-ordered the data points, showing them month-by-month (all the Januaries in one diagram first, then all the Februaries, and so on). The green lines indicate the year 2022.
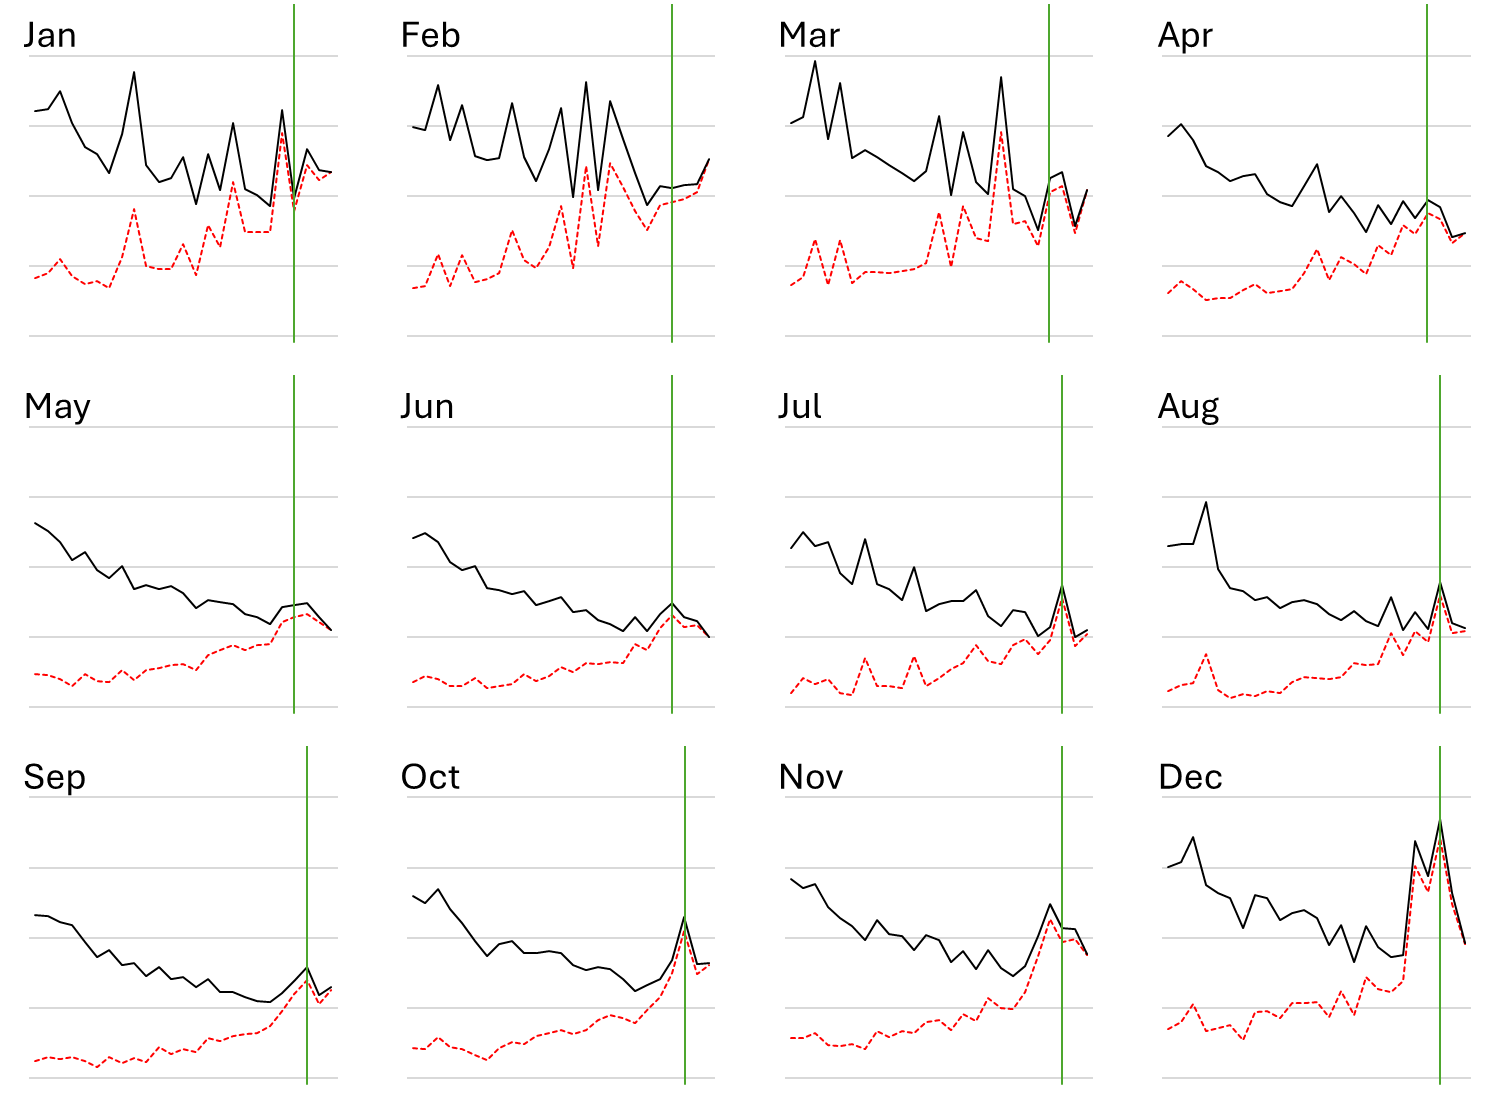
Strange, isn’t it? In 2022, the pandemic had been declared mostly over, and the blessed boosters had been dealt out in abundance. What did people die from?
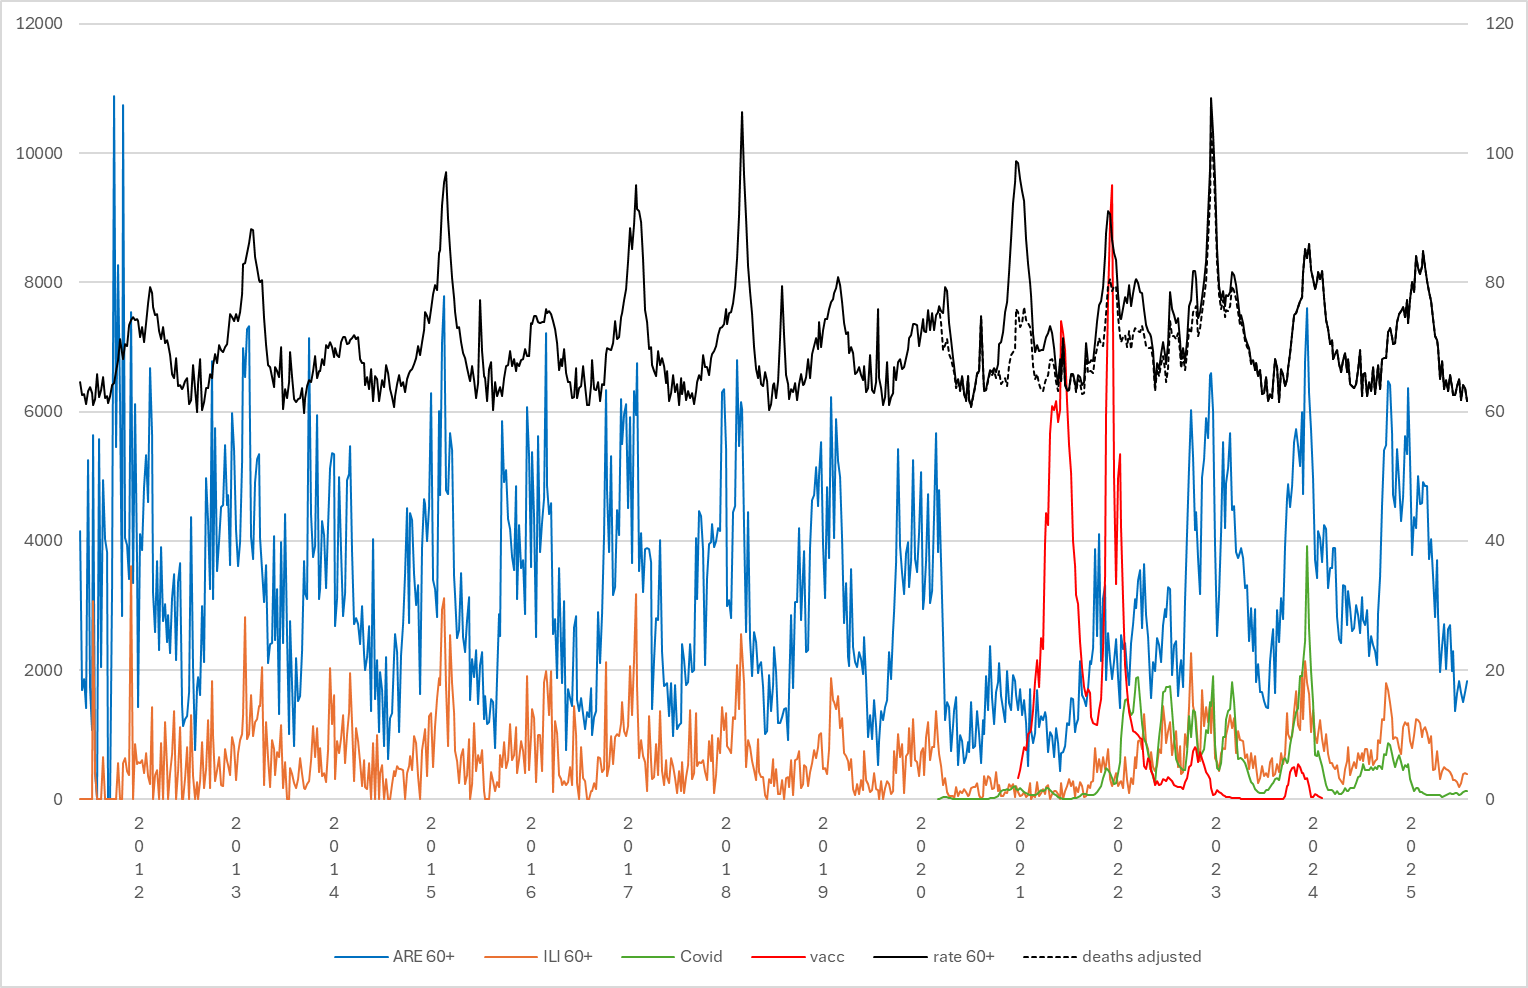
Maybe additional data can help to solve the mystery? Let me switch from month to calendar week first, and then bring in various incidence rates: for respiratory infections (ARE), for influenza-like illnesses (ILI), for Covid (official figures up to a point, after that scaling of wastewater data), and for Covid vaccination. Death rates (black; also adjusted for official Covid deaths as dashed curve), ARE and ILI are for the 60+ age group (sorry, no more fine-grained data here), Covid and vaccination at population level. Yes, it’s a bit of a mixed bag, and in danger of being out-Simpsoned, but for a first look it will do.
This is the same diagram, but with the first six seasons cut off (note also that there was no GrippeWeb surveillance before 2011/2012):
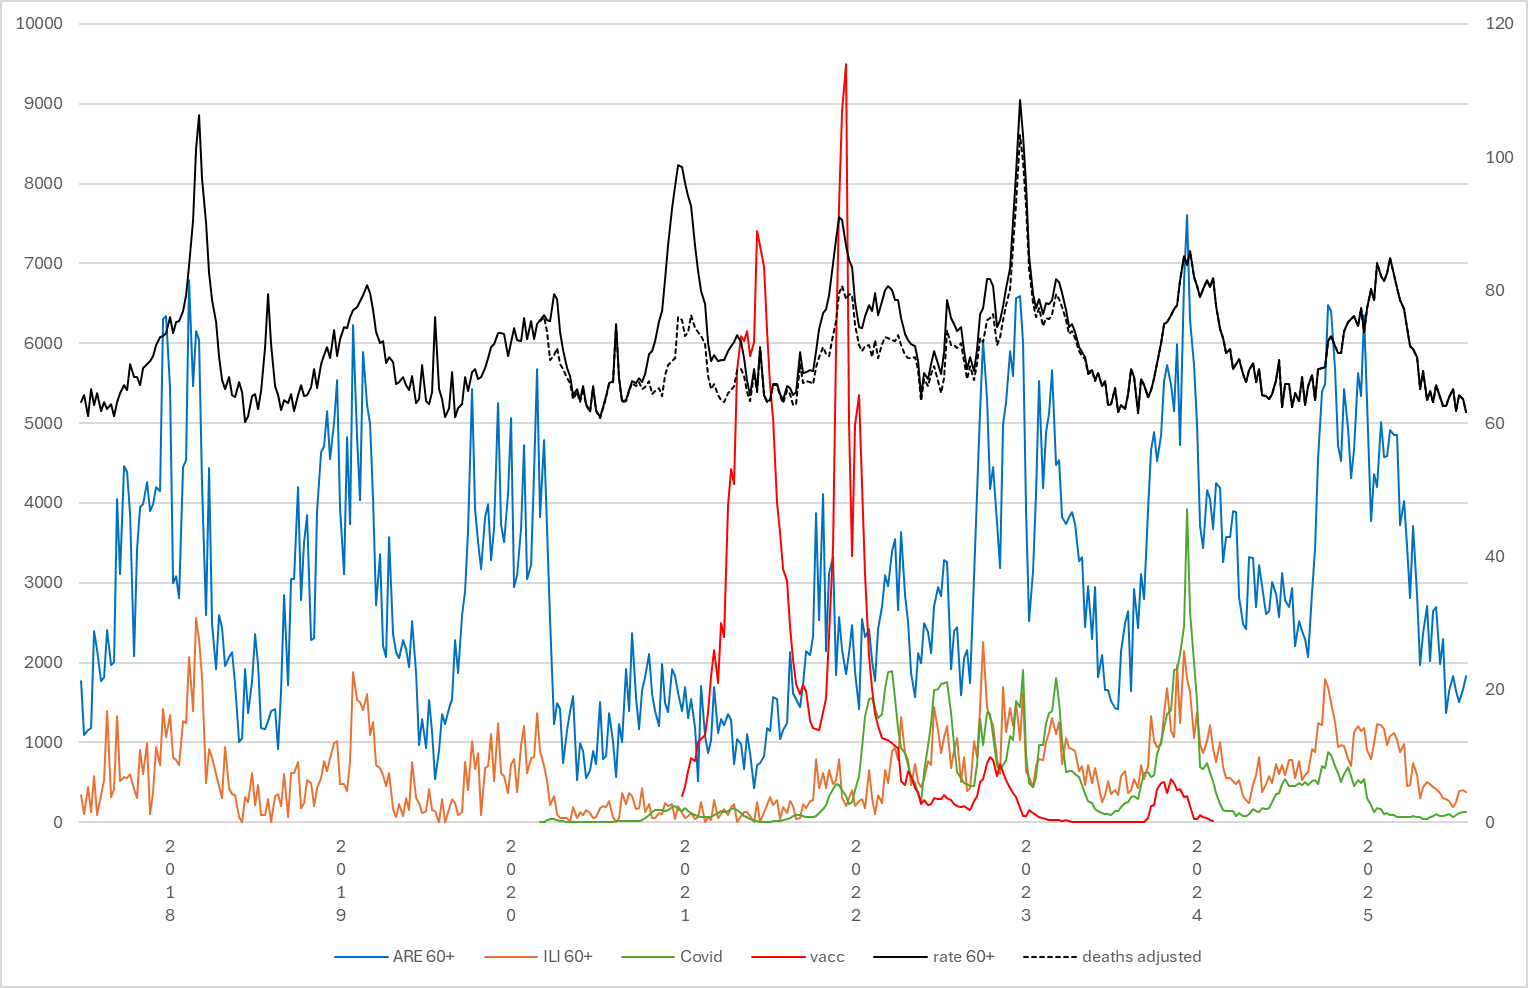
No ARE during the 2020/2021 season, no ILI, and laughably low Covid incidence rates when compared to later seasons - and yet a strangely smooth and broad mountain of deaths, which does not look at all like your usual influenza peak. As for the vaccinations, make of it what you want. My guess is that deaths directly attributable to vaccinations amount to maybe 20,000 or 30,000 in Germany, horrible but not enough to be detectable in diagrams like the above.
Anyway, both the 2023/2024 and the 2024/2025 season are unremarkable. I bet that influenza will take over again, and peaks in the numbers of deaths in the years to come will be seen in February and March, as it was before Covid.
No posts
Comments
Nothing yet. Say the first thing.
Sign in to join the conversation.